Madras Agric. J., 94 (7-12) : 242-255 July-December 2007
Performance evaluation of an automated surge irrigation in paired row furrows A.C. MATHEW* AND S. SENTHILVEL** * Sr.Scientist, Central Plantation Crops Research Institute, Indian Council of Agricultural Research, Kasaragod - 671 124. ** Professor, Water Technology Centre, Tamil Nadu Agricultural University, Coimbatore - 3. Abstract : An automatic surge irrigation system was fabricated and field tested to establish its efficacy under on-farm irrigation water management. The system was based on sequential operation. A time switch and an electromagnetic valve were the main components of the system. Field evaluation of this automatic surge irrigation system was carried out at Tamil Nadu Agricultural University, Coimbatore. Efficacy of automatic surge irrigation system over continuous flow system was experimentally evaluated in paired row furrows of 120 cm width in terms of waterfront advance times, infiltration patterns and soil moisture distribution efficiencies. Automatic surge flow was found to make the soil reach its basic infiltration rate much quicker, 35 to 50 percent of the time elapsed in continuous flow. This facilitates quicker waterfront advance resulting in more uniform storage and distribution of soil moisture from head to tail end of the field with minimum losses. Surge flow in 160 m long furrow was found to cause 48 percent reduction in the advance time as taken by the continuous flow and it took 59 percent of the net duration of irrigation to advance to the tail end. Though it is better than continuous flow in saving advance time the greater proportion for its advance time (59%) over the net irrigation time limits its application up to 120 m long furrows only. The longitudinal distribution of soil moisture after irrigation was found to be more uniform in furrows under automatic surge flow compared to continuous flow. Key Words: Automatic surge irrigation, paired row furrow, soil moisture, waterfront advance, cycle time, cycle ratio.
Introduction A scientific irrigation system should encompass an efficient water conveyance mode and an equally efficient application mode. Paired row is a special irrigation technique used for nonrice crops. It is a method in which crop rows are accommodated on both sides of furrow by increasing ridge spacing, thereby a common furrow is used for irrigating two rows. The paired row system is practiced in many parts of Tamil Nadu since it could save considerable amount of water and is suitable for row crops.
Surge irrigation, a relatively new technique of water application, claims to reduce the deep percolation losses to well within 10 percent and runoff loss within five percent thereby achieving as high as 85 percent application efficiency (Humphreys, 1989). Surge irrigation involves intermittent application of water at specified discharge rates in an ON-OFF cycling mode into individual furrows. This resulted in accelerated waterfront advance rates and minimum deep percolation losses (Coolidge et al., 1982; Duke et al., 1983) due to drastic reduction in the soil infiltration rates (Zohrab et al., 1985) during the cyclic
Performance evaluation of an automated surge irrigation in paired row furrows
flows. Mechanisms by which surge irrigation affects infiltration is given by Allen (1980). Thus a high order of irrigation application, storage and distribution efficiencies are possible under surge irrigation compared to continuous flow irrigation. However, the most successful performance of a surge irrigation layout depends on the design of surge cycle timing parameters and prediction of the net waterfront advance times to reach the furrow tail end within the stipulated duration of irrigation (Senthilvel et al., 2001). A well controlled irrigation system should not only optimize the spatial and temporal distribution of water, but also should economize the system’s structural requirement. Automation of irrigation is the best way to achieve these objectives, both technically as well as economically. However, automation of irrigation is yet to take off its wings in the Indian context though such type of systems are quite popular in other developed countries. Surge flow surface irrigation can be easily automated and is a viable option for potentially improving irrigation uniformities and efficiencies (Izadi et al., 1990). The present study envisaged objectives on: To design an automatic surge irrigation system layout suitable for paired row of 120 cm width and to evaluate the hydraulic performance of automated surge flow in a paired row furrows. Materials and Methods The field experiment was carried out in sandy clay loam soil at Tamil Nadu Agricultural University. The soils are deep and moderately drained. Characteristics of that are given in table 1. TNAU is situated in Western Agroclimatic zone of Tamil Nadu at 11° N latitude
243
and 77° E longitude and at an altitude of 426.70m from MSL. Fabrication of automatic surge flow device A commercially available Time Switch, 220/240V AC, 50/60 Hz, was used to regulate irrigation sequentially as per the pre set timings. The heart of the time switch was a quartz oscillator vibrating at a particular frequency. This frequency was converted to 1 Hz. pulse in an integrated circuit. This pulse drove a stepper motor, which in turn drove a gear train that was connected to a switching dial. According to a set time in the time switch a control circuit operated a solenoid valve to switch on or switch off irrigation. The field set up of this automatic irrigation system comprised of a 50 mm dia and 15 m long main (PVC pipe) with 25 mm dia orifices spaced 120 cm apart to suit the paired furrow spacing of 120 cm for paired row crops. The main pipe was kept at the head end of the field in such a way that the orifices were at the center of each furrow. An online electro magnetic valve was provided at the inlet end of the main pipe. The valve in turn was connected to an irrigation pipeline to which a continuous water supply was provided. The electro magnetic valve operates on 220V AC supply. The valve was connected to an electric supply through the time switch. The time switch was set to operate the valve according to the preset ON time and OFF time required for the surge effect. ON time(ToN) and OFF time(ToFF) were adjusted in the time switch according to the selected discharge rate and number of surges. Inflow rate (Q) and cycle ON time (T ON) were varied in combinations resulting in equal total volume of water applied per surge.
A.C. Mathew* and S. Senthilvel**
244
Table 1. Soil characteristics of the experimental site Mechanical Composition (%) Coarse sand Fine sand Silt Clay Loss (by difference)
30.12 26.82 12.44 28.60 2.02
Physical Properties Infiltration rate Bulk density Non capillary porosity Capillary porosity Field capacity Wilting point Hydraulic conductivity
2 cm/hr 1.34 Kg/m3 15.72% 21.87% 28.02% 11.56% 2.94cm/hr
Table 2. Net time of irrigation required for different treatments Discharge, lps
Net time of irrigation, min.
0.5 1.0 1.5
320 160 106.67
Table 3. Infiltration equations for continuous flow S.No. 1. 2. 3.
Inflow discharge, lps
Infiltration equation
0.5 1.0 1.5
l = 33.769 t-0.3678 l = 45.736 t-0.4535 l = 43.417 t-0.4416
Performance evaluation of an automated surge irrigation in paired row furrows
Hydraulic performance of automatic surge irrigation The study was intended to establish the effects of surging on surface flow hydraulics on a given soil under different stream sizes, cycle times, cycle ratios and furrow lengths. Extensive field trials were carried out to achieve the said objectives during the years 2001-’02 and 2002-’03. To study the hydraulics of automatic surge flow paired furrow irrigation, furrows of 120 cm width and 160 m length were taken with a given bed slope of 0.3%. Three inflow rates, 0.5, 1.0 and 1.5 lps were selected considering the maximum permissible nonerosive flow velocities for the selected furrow slope. Number of surge cycles selected were 4, 6 and 8 keeping a fixed ON time and changing the surge cycle ratios at 1/3, 1/ 2 and 2/3. When the furrow length was relatively short, the constant ON time/variable distance approach was used. Some researchers had also studied this method (Alemi and Goldhamer, 1988; Izuno and Podmore, 1986; Senthilvel, 1998). With this, the ON time for all surge cycles were the same, while the length of dry furrow wetted with each subsequent surge decreased. Continuous flow furrow irrigation using the same volume of water as in the other treatments was considered as control. Determination of surge flow parameters The net time of irrigation application (TN) and the number of surges (N) needed for each combination of cycle times (T c ), cycle ratios (Rc) and inflow rates (Q) were computed for the furrows, for a depth of irrigation of 5 cm, using volume balance equation as follows.
245
Net time of irrigation T N = W.L.d / Q where, T N = Net time of irrigation, min W = Furrow spacing, m L = Length of furrow, m d = Depth of irrigation, m Q = Inflow discharge, m3/min Surge ON time TON = TN / N where, TON = Surge ON time, min N = Number of surge cycles Surge OFF time T OFF = (1-R c)-TON/Rc where, T OFF = Surge OFF time = Surge cycle ratio Rc Net time of irrigation required for different treatments of discharge rate is given in table.2. Surge irrigation was given automatically for this net irrigation period with all combinations of number of surges (4,6 and 8) and cycle ratios (1/2, 1/3 and 2/3). All the runs were conducted at approximately the same antecedent moisture content on freshly prepared furrows. Results and Discussion Infiltration characteristics The basic infiltration rate of the soil was measured by double ring infiltrometer and was found to be 2cm/hr. The functional relationship between cumulative infiltration and elapsed time was found to be following the Kostiakov equation, Ic = 1.1163 t0509 with an R2 value of 0.9507
(1)
A.C. Mathew* and S. Senthilvel**
246
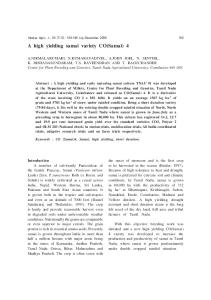
Effect of continuous flow on waterfront advance pattern Fig.1 depicts the waterfront advance time (Ta) Vs distance traveled by the waterfront (L) for different furrow inflow discharges (Q) - 0.5, 1.0 and 1.5 lps -through 160 m long paired furrows of 120 cm size laid on a uniform gradient of 0.3 percent. Table.3 furnishes the mathematical relationship between the length of flow and the time of advance in the best fitting empirical form: Ta = αL2 - βL + γ
(2)
where, Ta = Waterfront advance time, min L = Length of furrow traveled by the advancing waterfront, m
α, β and γ are waterfront advance characteristic constants It is obvious from Fig. 1 that the waterfront advance time to reach any distance increases with increase in the furrow length and decreases with increase in furrow inflow discharge. Effect of surge flow on waterfront advance pattern Fig.2 to Fig.4. depict the combined effect of furrow inflow rate (Q), surge cycle ratio (Rc) and number of surges (N) on the waterfront advance pattern over a 160 m long paired furrow. Increasing the furrow inflow discharge obviously caused quicker waterfront advances in all treatment combinations of length of
Performance evaluation of an automated surge irrigation in paired row furrows
247
Table 4. Net time to attain basic infiltration in surge flow. Discharge, lps
0.5 1.0 1.5
Net time elapsed, min. Cycle ratio 1/2
1/3
2/3
120 60 53
131 60 51
100 50 47
furrow, surge cycle ratio and number of surge cycles. The waterfront advance over the first surge during its design duration to cope up with the net duration of irrigation (Tn) and the number of surge cycles to complete irrigation (N) was the same as that of the continuous flow. During the subsequent surges increased discharges were found to accelerate the waterfront advance rates on account of reduced infiltration rates over the previously wetted portions of the furrow lengths. In general, irrespective of the surge cycle ratio and surge cycle number, increased furrow inflows were found to cause increased waterfront advance distances in surge flow. It may be concluded that surge flow had caused a reduction in the time of waterfront advance in all the test combinations of surge cycle ratio (Rc) and number of surge cycles (N) at the given rate of inflow compared to the continuous flow at the same rate. A better surging combination was found at a cycle ratio of 2/3 with eight numbers of surge cycles which made a relatively quicker waterfront advance time for the same discharge, furrow geometry and soil conditions. Effect of continuous/surge flow on infiltration along furrows Infiltration is the most important single physical process in furrow irrigation. Proper design and management of continuous or surge
irrigation depend on accurate knowledge of how infiltration changes with time. In the present study, the infiltration rates were measured by using the inflow-outflow method over a representative furrow of 120 cm width along a 40 m length of 160 m long test furrow. The experiments were carried out at the inflow rates of 0.5, 1.0 and 1.5 Ips. The results were compared with infiltration under continuous flow as control. Effect of discharge on infiltration under continuous flow The flow head and wetted area increases along with inflow discharge resulting in the added volume of infiltration. However, the rate of waterfront advance gets quickened due to increased flow head and it dominates over infiltration. Infiltration is a complex physical process that is difficult to describe accurately for anisotropic and heterogeneous conditions commonly found in irrigated fields. In addition, infiltration changes during the crop season due to factors such as soil compaction. Therefore an empirical approach to modeling intake is often more practical than a purely theoretical approach (Blair and Smerdon, 1985). Two commonly used equations are the Kostiakov and Extended Kostiakov (Balir, 1984).
248
A.C. Mathew* and S. Senthilvel**
Performance evaluation of an automated surge irrigation in paired row furrows
249
A.C. Mathew* and S. Senthilvel**
250
Infiltration equations of the standard Kostiakov form were fitted to the observations taken over a representative furrow length of 40 m based on the inflow-outflow method for different inflow rates (0.5, 1.0 and 1.5 lps). The Kostiakov infiltration equation is of the form l=ktn
(10)
where, I = Infiltration rate, cm/hr, t = Elapsed time, minutes and k & n are constants. Infiltration equations pertaining to continuous flow conditions are given in Table.3. However, the average basic infiltration rate in all the above cases was found to be around 4.6 cm/hr after an elapsed time of more than three hours. The initial infiltration rates were higher than 35 cm/hr. The tests were conducted at almost the same antecedent moisture content of 50% of the permissible depletion level of the available water holding capacity. These patterns of infiltration suggest that the time taken for the soil of the furrow to reach its basic intake rate is quite long which in turn results in more infiltration depths of water at the head reaches causing slow waterfront advances under continuous flow. Obviously, this condition leads to poor distribution of soil moisture with more deep percolation at head end and moisture deficit at the tail end of the furrow. Effect of discharge rate on infiltration under surge flow Discharge variations obviously result in infiltration variations under surge flow much similar to the continuous flow. Net time required to attain basic infiltration rate in surge flow for different discharge rates while keeping the number of cycles constant at eight is given in Table.4.
It is understood from the results that for a given furrow size, when discharge was increased, additional volume of water was supplied to the furrow section over reduced ON times resulted in quicker reduction in infiltration rates. The time taken to reach the basic infiltration rates under surge flow was smaller than that of continuous flow at the same discharge. The reduction in infiltration rate due to dewatering of the soil surface is relatively a rapid process that occurs during the first OFF time after wetting. This finding is consistent with the results of Coolidge et al. (1982). This relatively drastic reduction in infiltration rates over shorter spells of time during irrigation obviously results in quicker waterfront advance, lesser deep percolation losses and better soil moisture storage and distribution compared to continuous flow. Most investigators presume that reduction of intake rate is primarily the result of surging and that the reduction takes place almost immediately following dewatering of the soil surface (Coolidge et al., 1982). Malano (1982) noticed that the movement of dispersed fine particles into large pore spaces reduced infiltration. Izuno (1984) concluded that the infiltration was reduced with subsequent surges. Soil moisture distribution along the furrow The infiltration opportunity time varies from head end to tail end of the furrow all along its watercourse. Because of the same reason the soil moisture distribution after irrigation over the design net duration also changes. Consequently the irrigation efficiencies are also influenced. To achieve desirable irrigation efficiencies, a proper combination of the furrow inflow rate, ONOFF timing of surge cycle, surge cycle ratio and the number of surges over the design
Performance evaluation of an automated surge irrigation in paired row furrows
251
252
A.C. Mathew* and S. Senthilvel**
Performance evaluation of an automated surge irrigation in paired row furrows
253
A.C. Mathew* and S. Senthilvel**
254
net duration of irrigation to apply the desired depth of irrigation over the given furrow specifications and soil infiltration rates need to be arrived at. The relative efficiency of surge flow over continuous flow in achieving better soil moisture distribution along the furrow was studied at three discharge levels viz., 0.5, 1.0 and 1.5 lps on a uniform gradient of 0.3 percent. Soil moisture contents were recorded before and after irrigation at selected points from the head to tail end of the furrows up to a profile depth of one meter. The furrows were irrigated for a design depth of 5 cm of water at 50 percent of permissible depletion level of the available water holding capacity of the root zone (60 cm). The deep percolation of water below the effective root zone up to 100 cm was assessed from the difference in moisture content before and after irrigation.
considerable loss of water as deep percolation at the head end of the furrow under continuous flow. Due to this loss of water at the head end there was shortage at the tail end. The difference in soil moisture between continuous and surge flow decreased with increase in discharge rate. The large difference in soil moisture between continuous and surge flows at the tail end for lower discharge rates (0.5 and 1.0 lps) shows the moisture deficit that occurred due to continuous flow. The flat curve of continuous flow at the tail end for these lower discharge rates is due to the fact that the waterfront with these discharges failed to reach the tail end within the stipulated time of irrigation. Effect of surge flow on soil moisture storage and distribution has been worked out and are found to be in close lines with the findings of Senthilvel (1998).
Fig.5 and Fig.6 depicts the three dimensional view of soil moisture distribution after irrigation under continuous and surge flow respectively. For surge flow the cycle ratio was kept at Rc=2/3 with eight number of cycles to complete irrigation. This was done because it was this combination, Rc=2/3 and N=8, that produced the fastest surge flow. Under continuous flow, the high degree of variation in infiltration opportunity time from head to tail end of the furrows and the continuously decreasing rate of flow towards the tail end cause poor distribution of soil moisture along the furrow. It is obvious from the figures that the surge flow produced more uniform distribution of soil moisture compared to continuous flow under all discharges. It might also be noticed that as the discharge rate increased from 0.5 to 1.5 lps the uniformity of soil moisture distribution also increased, both under continuous flow and surge flow. It was obvious that there was
References Alemi, M.H. and Goldhamer, D.A. (1988). Surge Irrigation optimization model. Trans. ASAE 31 (2):519-526 Allen, N.L. (1980). Advance rate in furrow irrigation for cycled flow. M.S. Thesis. Agricultural and Irrigation Engineering Department, Utah State University, Logan. 79 pp. Blair, A.W. (1984). Infiltration and surge flow. Proceedings Surge Flow Irrigation Conference, Texas A&M University Extension Service, Midland, Texas, January-1984 Blair, A.W. and Smerdon, E.T. (1985). Effect of surge cycle ratio and cycle time on infiltration. Irrigation and Drainage Division specialty conference in San Antonia, Texas. ASAE report 1852: 155-161. Coolidge, P.S., Walker, W.R. and Bishop, A.A. (1982). Advance and runoff under surge
Performance evaluation of an automated surge irrigation in paired row furrows
flow furrow irrigation. ASCE. Jour. Irrigation and Drainage Div., 108(IRI): 35-42 Duke, H.R., Izuno, FT. and Podmore, T.K. (1983). Surge Irrigation Management. Agric. Water Management, 11(34):279-291 Humphreys, A.S. (1989). Surge irrigationManagement. ICID Bulletin. 38(2):49-61 Izadi, B., Heerman, D.F. and Klute, A. (1990). The role of redistribution and hysteresis in the surge irrigation phenomena. Trans. ASAE 33(3): 799-806 Izuno, FT. and Podmore, T.K. (1986). Surge Irrigation Management. Agric. Water Management, 11(34): 517-521 Izuno, FT., Podmore, T.H. and Duke, H.R. (1984). Infiltration under surge irrigation. ASAE, paper 84-2088, ASAE, St. Joseph, Ml.
255
Malano, H.M. (1982). Comparison of the infiltration process under continuous and surge flow. M.S. Thesis. Agricultural and Irrigation Engineering Department, Utah State University. Logan. Senthilvel, S. (1998). Hydraulic design and performance evaluation of a semi-automated surge irrigation device. Madras Agric. J., 85(7-9): 340-344 Senthilvel, S., Raviraj, A., Subramanian, K. and Balaji Kannan. (2001). Model validation and dimensional optimization of a surge flow furrow irrigation system. J. of Indian water resources society, 21(1):34-42 Zohrab, A.S., Walker, W.R. and Willards, L.S. (1985). Infiltration under surge flow irrigation. Trans. ASAE, 28(5): 1539-1543