Madras Agric. J., 94 (7-12) : 156-161 July-December 2007
Yield components analysis in American Cotton (Gossypium hirsutum L.) U.V. KALE, H.V. KALPANDE, S.N.ANNAPURVE AND V.K. GITE Department of Agricultural Botany, Marathwada Agricultural University, Parbhani - 431 402 (MS)
Abstract: Evaluation of 42 upland cotton genotypes revealed high heritability with high GCV and genetic gain for number of bolls, number of sympodia, boll weight and plant height and these could be improved by simple selection. Correlation and path analysis studies revealed that number of sympodia, number of bolls, number of seeds and boll weight had significant positive association with seed cotton yield per plant in addition to exhibiting direct positive effect on it. Key words: Cotton, Variability, Correlation, Path analysis.
Introduction The success of any breeding programme usually depends upon the quantum of genetic variability present in the breeding material. Improvement in yield and its components depends on the nature and magnitude of genetic variability available in the material for exploitation. Thus, knowledge of genetic variability, heritability and genetic advance in cotton is very essential for breeder to choose good parents and to decide the appropriate breeding methodology for crop improvement. To make selection more effective, it is always desirable to understand and to identify different yield attributes. Correlation of characters is a measure of strength of relationship between group of characters. The estimation of correlation coefficient is an important step in planning selection experiments, as it forms the basis for developing a selection index. Path coefficient analysis provides an effective means of finding the direct and indirect causes of association. To cater to the above needs, the present study was formed to get knowledge regarding variability, character association and path analysis for yield and yield
components in American Cotton (Gossypium hirsutum L.). Materials and Methods The experimental materials consisted of 42 genotypes including 35 F4 populations advanced from four crosses, five parents along with two checks. The experiment was conducted in Randomized Block Design with two replications during kharif 2002 at Department of Agricultural Botany, Marathwada Agricultural University, Parbhani. Recommended package of practices and plant protection measures were adopted to raise a good crop. Each genotype was grown in five rows of 6m length by adopting spacing of 60 x 60 cm. Observations were recorded on twenty randomly selected plants for seed cotton yield per plant (g) and its components viz., days to 50 per cent flowering, days to maturity, plant height (cm), number of monopodia per plant, number of sympodia per plant, number of bolls per plant, number of seeds per plant, 100 seed weight (g), boll weight (g), ginning outturn (%) and staple length (mm). From mean values of each character,
2.88 4.54 8.96 37.67 23.47 66.02 8.06 8.36 73.35 20.96 4.96 6.21 2.12 4.67 0.66 7.06 21.77 31.46 2.08 0.59 2.56 8.01 1.24 5.79 40.00 58.00 24.50 99.80 92.90 97.70 51.50 33.60 94.20 64.70 58.40 70.30 2.25 2.88 8.85 18.39 11.83 32.42 5.45 7.05 18.02 11.17 22.56 8.78 3.56 3.78 17.87 11.41 12.27 32.79 7.60 12.17 18.57 18.95 29.12 10.47 2.65 9.22 0.42 11.87 120.31 238.64 1.97 0.24 0.39 43.04 31.78 66.86 6.64 15.89 1.72 11.90 129.43 244.12 3.83 0.736 0.420 66.52 52.95 95.06 73.62 105.48 3.63 18.74 92.72 47.65 25.78 7.05 3.49 38.21 24.99 93.13 78.39 114.34 9.67 24.75 103.60 64.59 29.31 7.96 5.55 47.53 35.61 123.25 68.85 100.81 5.95 15.01 81.01 33.51 23.21 5.05 2.71 33.16 22.15 80.05 Days to 50% flowering Days to maturity No.of monopodia plant-1 No.of sympodia plant-1 Plant height (cm) No. of bolls plant-1 No. of seeds boll-1 100 seed weight (g) Boll weight (g) Ginning outturn (%) Staple length (mm) Seed cotton yield plant-1 (g)
Genetic Expected advance genetic (GA) advance (% of mean) Genotypic Heritability (GCV) (%) Phenotypic (PCV) Genotypic Minimum Maximum
Mean
Phenotypic
Coefficients of variation Variance Range Character
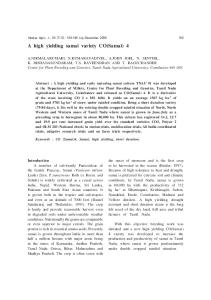
Table 1. Estimate of mean, components of variance, heritability (broad sense) and expected genetic advance in respect of twelve characters in cotton.
Yield components analysis in American Cotton (Gossypium hirsutum L.)
157
genotypic and phenotypic coefficients of variation, heritability (broad sense), genetic advance, genotypic and phenotypic correlation coefficients were computed using standard statistical procedures as suggested by Johnson et al. (1955). The correlations were further partitioned into direct and indirect effects by path coefficient analysis as per Dewey and Lu (1959). Results and Discussion Genetic variability The perusal of data from Table 1 revealed significant differences among genotypes for all the twelve characters studied. The characters viz., number of bolls per plant, staple length, number of sympodia per plant, boll weight, plant height and ginning out turn showed high PCV and GCV estimates. Similar findings were reported for above characters except staple length by Kapoor and Kaushik (2003) and Tuteja et al. (2004). The PCV was higher than the respective GCV for all the characters denoting environmental factors influencing their expression to some degree or other. The differences in the values of PCV and GCV were very less for number of bolls per plant, number of sympodia per plant, boll weight and plant height suggesting their relative resistance to environmental alteration. These findings were in agreement with Kapoor and Kaushik (2003) and Gumber et al. (2005). Wide differences between the PCV
G P
G P
G P
G P
G P
G
G P
G P
G P
G P
Days to maturity
No.of monopodia plant-1
No.of sympodia plant-1
Plant height (cm)
No. of bolls Plant -1
No.of seeds boll -1
100 seed weight (g)
Boll weight (g)
Ginning outturn (%)
Staple length (mm)
0.617** 0.258
Days to maturity
0.347* 0.039
-0.128 -0.110
No.of monopodia plant -1
0.401** 0.184
0.444** 0.337*
-0.195 0.129
No.of sympodia plant-1
* Significant at 5% level ; ** Significant at 1% level
G P
-
Days to 50% flowering
Character
-0.132 -0.125
-0.102 -0.072
-0.350* -0.204
-0.111 0.078
Plant height (cm)
Table 2. Genotypic and phenotypic correlation coefficients in cotton. No.of seeds boll-1
0.283 0.278
0.286 0.283
0.198 0.078
0.131 0.097
0.364* 0.235
-0.043 -0.022
0.338* 0.243
0.028 0.095
0.395** 0.213
-0.339* 0.313* -0.221 0.146
No.of bolls plant-1
-0.041 -0.255
-0.196 -0.097
0.179 0.130
-0.271 -0.154
-0.405** -0.025
-0.606** -0.278
0.064 0.069
0.387* 0.263
0.331* 0.128
-0.071 -0.045
-0.203 0.171
-0.069 -0.061
0.233 -0.058
-0.246 -0.192
0.128 0.173
-0.202 0.125
-0.126 -0.132
0.165 0.061
0.354* 0.233
0.240 0.428** 0.214 0.376*
0.239 0.174
-0.166 0.728** -0.149 0.687**
0.122 0.405** 0.078 0.190
0.027 0.447** 0.040 0.332
-0.151 0.071
Staple Seed length cotton (mm) yield plant-1
0.392* 0.190
0.344* 0.318*
-0.170 -0.145
0.450* 0.715** 0.322* 0.603**
0.087 0.085
-0.442** -0.695** -0317* -0.136 -0.375* -0.128
0.513** 0.320*
0.281 0.225
-0.084 -0.076
0.718** 0.602**
0.548** 0.223
0.439** 0.198
-0.101 0.070
100 seed Boll Ginning weight(g) weight(g) outturn (%)
158 U.V. Kale, H.V. Kalpande, S.N.Annapurve and V.K. Gite
Yield components analysis in American Cotton (Gossypium hirsutum L.)
and GCV as in the case of staple length, ginning outturn, number of monopodia per plant and 100 seed weight implied its susceptibility to environmental fluctuation. Determination of the magnitude and nature of heritable and non heritable components of variation will enable the breeder to know the characters which respond to selection. The genetic advance values should also be considered simultaneously as high heritability combined with high genetic advance is likely to result in maximum functional gain during selection (Johnson et al., 1955). High genetic advance estimates were indicative of additive gene effects and such variations could be effectively exploited by vigorous selection for improvement of particular character. High heritability coupled with high genetic advance was observed for number of sympodia per plant, number of bolls per plant, boll weight, plant height and ginning outturn indicating the possibility of improvement of these characters through selection. These results were in conformity with those of Kapoor and Kaushik (2003) for number of sympodia per plant, number of bolls per plant, boll weight and plant height and Tuteja et al. (2004) for ginning outturn. Correlation Studies on correlation revealed that the genotypic correlation coefficients were larger than the phenotypic ones (Table 2), indicating the high proneness to environmental fluctuation. This might have diluted the expression of correlation between characters at phenotypic level (Bhambota et al., 1994). The characters viz., number of sympodia per plant, ginning outturn, days to maturity, number of bolls per plant and boll weight exhibited significant and positive correlation with seed cotton yield
159
per plant both at genotypic and phenotypic level, where as number of monopodia per plant and number of seeds per boll exhibited significant and positive correlation with seed cotton yield per plant only at genotypic level. Similar results were also reported by Ahuja and Tuteja (2001) for ginning outturn, Altaher and Singh (2003) for boll weight and Kaushik et al. (2003) for number of bolls per plant, number of sympodia per plant and number of monopodia per plant. Path analysis As simple correlation does not provide the true contribution of the characters towards the yield, these genotypic correlations were partitioned into direct and indirect effects through path coefficient analysis. Path analysis (Table 3) revealed that number of sympodia per plant had the highest positive direct effect followed by boll weight, number of seeds per boll and number of bolls per plant. These results were in agreement with those of Altaher and Singh (2003) for number of bolls per plant and boll weight and Kaushik et al. (2003) for number of sympodia per plant and boll weight. The characters viz., ginning outturn, 100 seed weight, days to maturity, number of monopodia per plant, days to 50 per cent flowering and plant height showed negative direct effects on seed cotton yield per plant. Similar results were reported by Gururajan (2000) for plant height and Ladole and Meshram (2000) for days to 50 per cent flowering, number of monopodia per plant and 100 seed weight. The direct effects of ginning outturn, days to maturity and number of monopodia per plant were negative but their positive correlation with seed cotton yield per plant could be due to the high indirect effects through number of sympodia per plant.
-0.0591
0.0364
0.0076
0.0115
-0.066
0.020
0.0185
0.0038
0.0075
-0.0060
0.0089
Days to 50% flowring
Days to maturity
No.of monopodia plant-1
No.of sympodia plant-1
Plant height (cm)
No. of bolls Plant -1
No.of seeds boll -1
100 seed weight (g)
Boll weight (g)
Ginning outturn (%)
Staple length (mm)
Residual effect = 0.0528
Days to 50% flowering
Character
-0.0081
-0.0366
-0.0156
0.0270
-0.0019
0.0132
0.0068
0.0268
-0.0608
0.0232
0.0086
-0.2442
1.0595
0.3023
-0.3993
0.4989
0.4226
-0.1943
1.0753
0.5911
0.6543
-0.2876
-0.0128
0.0042
-0.0102
-0.0090
0.0022
-0.0142
-0.0500
0.0066
0.0051
0.0175
0.0550
-0.0032
0.0248
0.0021
0.0289
0.0229
No.of seeds boll-1
0.0023
0.0027
-0.0007
0.0121
0.0375
0.0242
-0.0019 -0.0030
0.0035 0.0732
0.0396 0.0267
0.0027
0.0027
0.0019
0.0013
-0.0032
No.of bolls plant-1
* Significant at 5% level ; ** Significant at 1% level
-0.0044
-0.0722
0.0404
0.0996
-0.0650
-0.0224
0.0575
-0.0127
0.0570
-0.1643
-0.1013
Days to No.of No.of Plant maturity monopodia sympodia height plant -1 plant-1 (cm)
0.0397
0.1797
0.4588
0.1776
0.1516
0.0326
0.0933
-0.0318
0.1068
-0.1129
0.0586
-0.3065
0.6812
-0.2669
0.3008
-0.3493
-0.1917
0.0573
-0.4892
-0.3750
-0.2993
0.0688
0.0071
0.0032
0.0006
0.0050
0.0012
0.0017
0.0017
-0.0012
0.0009
0.0002
-0.0011
-0.1701
0.7150**
0.3439*
-0.3169*
0.3536*
0.4277**
0.1256
0.7284**
0.4047**
0.4467**
-0.2020
Staple Correlation length with Seed (mm) cotton yield plant-1
Diagonal values indicated direct effect.
0.3528
0.2242
-0.1965
-0.5076
0.0207
0.0996
-0.0909
0.1374
0.2053
0.3076
-0.0323
100 seed Boll Ginning weight(g) weight(g) outturn (%)
Table 3. Path coefficient analysis of yield components on seed cotton yield at genotypic level in cotton.
160 U.V. Kale, H.V. Kalpande, S.N.Annapurve and V.K. Gite
Yield components analysis in American Cotton (Gossypium hirsutum L.)
This investigation revealed that it would be rewarding to lay emphasis on number of bolls per plant, number of sympodia per plant and boll weight in selection programme of cotton, as these characters showed high GCV, heritability, genetic advance and also exhibited high positive direct effect confirming its significant positive correlation with seed cotton yield per plant. References Ahuja, S.L. and Tuteja, O.P. (2001). Association and genetic variability for yield and fibre quality traits in coloured linted strains of Gossypium hirsutum cotton. J. Cot. Res. Dev., 15: 226-228.
161
Gumber, R.K., Chahal, G.S. and Verma, P.K. (2005). Genetic evaluation of Gossypium arboreum genotypes for yield and fibre quality. J. Cot. Res. Dev., 9: 44-48. Gururajan, K.N. (2000). Yield component analysis in Egyptian cotton (Gossypium barbadense L.). J. Indian Soc. Cot. Improv., 25: 1722. Johnson, H.W., Robinson, H.F. and Comstock, R.E. (1955). Estimates of genetic and environmental variability in soybean. Agron. J., 47 : 314-318. Kapoor, C.J. and Kaushik, S.K. (2003). Variability, heritability and genetic advance studies in cotton (Gossypium hirsutum L.). J. Cot. Res. Dev., 17: 240-241.
Altaher, A.F. and Singh, R.P. (2003). Yield components anaysis in upland cotton (Gossypium hirsutum L.). J. Indian Soc. Cot. Improv., 28: 151-157.
Kaushik, S.K., Kapoor, C.J. and Koli, N.R. (2003). Association and path analysis in American cotton (Gossypium hirsutum L.). J. Cot. Res. Dev., 17: 24-26.
Bhambota, S.K., Sood, B.C. and Gartan, S.L. (1994). Contribution of different characters towards seed yield in chickpea (Cicer arietinum L.). Indian J. Genet., 54: 381388.
Ladole, MY. and Meshram, L.D. (2000). Correlation and path coefficient analysis in naturally coloured cotton (Gossypium hirsutum L.). J. Cot. Res. Dev., 14: 89-92.
Dewey, D.R. and Lu, K.H. (1959). A correlation and path coefficient analysis of components of crested wheat grass seed production. Agron. J., 51: 515-518.
Tuteja, O.P., Sunil Kumar and Puneet Luthra (2004). Variability, heritability and genetic advance studies in CMS based hybrids in upland cotton (Gossypium hirsutum L.). J. Cot. Res. Dev., 18: 42-43.