RESEARCH NOTES Madras Agric. J., 94 (7-12) : 269-272 July-December 2007
269
Research Notes
Studies on correlation and path coefficient analysis in rice crop as influenced by nitrogen fertilizer and sunnhemp green manuring T.L. NEELIMA, V.B. BHANU MURTHY AND A.V.RAMANJANEYULU College of Agriculture, ANGRAU, Rajendranagar, Hyderabad - 500 030, Andhra Pradesh
Yield is the result of interaction between genotype and environment (G x E). It is closely associated with many growth and yield attributing characters. This relation may be positive or negative. It can be studied through correlation. In other words, the systematic inter-relationship between the variables can be understood by using correlation (Rangaswamy, 2005). Path coefficient analysis helps in separating the direct effect from indirect effect by partitioning the correlation coefficients. The information on correlation and path coefficient studies in regular agronomic experiments is meagre. Hence, the present investigation was undertaken to assess and measure the magnitude of relationship between grain yield of rice and other characters. The field experiment was conducted at College Farm, College of Agriculture, Rajendranagar, Hyderabad during kharif, 2004. The experimental site was of sandy loam in nature with pH 7.2, organic carbon 0.31 per cent and 207, 23 and 258 kg ha-1 of available N, P2O5 and K2O respectively. The experiment was laid out in a split plot design with four main treatments (total portion, root, shoot and no incorporation of Sunnhemp as green manure) and four sub treatments (0, 60, 120 and 180 kg Nitrogen ha-1). Sunnhemp, a green manure crop was sown during the end of May, 2004. After 60 days, it was incorporated as per the treatments. Six
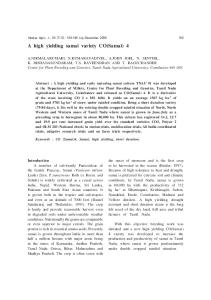
days after incorporation of sunnhemp the main plots were divided into sub plots. Nitrogen was applied as per the treatment and 60 kg each of P2 O5 and K2O ha-1 were applied uniformly in all the treatments under test. The observations on various growth characters (plant height, tiller number and total dry matter production) and yield attributes (productive tillers, length of panicle, grains per panicle, filled grains per panicle and test weight) were recorded on selected plants in all treatments. The correlation and path coefficient analysis were carried out according to the method described by Dewey and Lu (1959). The data on correlation coefficients between growth characters, yield attributes and grain yield of rice have been presented in Table 1. It clearly showed that all the characters except number of leaves, productive tillers, length of panicle and grains per panicle were highly significant (p = 0.01) and found to be positively correlated with grain yield of rice. Straw yield (r = 0.91), plant height and dry matter production (r = 0.88) and LAI (r = 0.84) had higher correlation coefficients but their direct effects varied. The direct effect (Table 2) was highest for straw yield (0.589). Though number of leaves and productive tillers showed a positive correlation with seed yield of rice their correlation coefficients were less (r = 0.40 and 0.37, respectively). Similar results had been published earlier by Sharma et al.
1.00 1.00
0.88**
1.00
0.33 1.00
0.48*
Plant Dry No.of height matter leaves (cm) production (g/plant)
** Significant at 1% level (P=0.01) * Significant at 5% level (P=0.05)
Grain yield (kg/ha)
Straw yield (kg/ha)
Test weight (g)
Filled grains per panicle
Grains per panicle
Length of panicle (cm)
Productive tillers
Tiller number
LAI at 60 DAS
No. of leaves
Dry matter production (g/plant)
Plant height (cm)
Characters
1.00
0.08
0.88**
0.77**
LAI at 60 DAS
1.00
0.76**
-0.010
0.62**
0.46*
Tiller number
1.00
0.86**
0.65**
-0.11
0.47*
0.39
1.00
-0.38
-0.25
-0.17
0.73**
0.12
0.20
Produc- length of tive panicle tillers (cm)
1.00
0.70**
-0.03
-0.035
-0.18
0.58**
0.09
0.23
Grains per panicle
Table 1. Correlation coefficients between growth characters, yield attributes and grain yield of rice
1.00
0.81**
0.69**
0.01
0.11
0.19
0.5488
0.44*
1.00
0.29
-0.17
-0.02
0.30
0.48*
0.81**
0.20
0.69**
0.55** 0.74**
Filled Test grains weight per (g) panicle
100
0.67**
0.53**
0.20
0.24
0.42*
0.54**
0.83**
0.43*
0.96**
0.90**
Straw yield (kg/ha)
1.00
0.91**
0.84**
0.55**
0.12
0.24
0.37
0.53*
0.83**
0.40*
0.88**
0.88**
Grain yield (kg/ha)
270 T.L. Neelima, V.B. Bhanu Murthy and A.V. Ramanjaneyulu
-0.270
0.022
Dry matter -0.237 production (g/plant)
0.033
0.081
0.051
0.007
0.027
-0.083
0.205
0.156
0.530
No of leaves
LAI at 60 DAS
Tiller number
Productive tillers
Length of panicle (cm)
Grains per panicle
Filled grains per panicle
Test weight (g)
Straw yield (kg/ha)
0.253
0.041
0.203
-0.212
0.088
-0.002
-0.011
0.008
0.068
-0.088
0.487
0.170
0.007
0.066
-0.021
0.0122
0.085
0.105
0.005
-0.236
0.090
LAI at 60 DAS
0.321
0.101
0.043
0.013
-0.030
0.016
0.111
0.080
-0.007
-0.168
0.054
Diagnal values show direct effects
0.249
0.062
0.003
0.010
-0.045
0.019
0.096
0.068
-0.007
-0.126
0.046
Tiller Producti number ve tillers
** Significant at 1% level (P=0.01) ; * Significant at 5% level (P=0.05)
0.564
0.145
0.166
-0.032
0.015
0.009
0.069
0.092
0.103
0.117
Plant height (cm)
0.056
Plant Dry No of height matter leaves (cm) production (g/plant)
Characters
0.139
-0.005
0.258
-0.260
0.121
-0.007
-0.027
-0.018
0.050
-0.033
0.023
Length of panicle (cm)
0.119
-0.035
0.301
-0.370
0.085
-0.001
0.004
-0.019
0.039
-0.024
0.026
Grains per panicle
0.315
0.062
0.374
-0.297
0.083
0
0.013
0.020
0.037
-0.120
0.064
0.397
0.211
0.110
0.061
-0.003
0.006
0.053
0.085
0.133
-0.185
0.086
Filled Test grains weight per (g) panicle
Table 2. Direct (diagonal) and indirect (off diagonal) effects of different characters on grain yield of rice
0.589
0.142
0.200
-0.04
0.028
0.008
0.061
0.087
0.029
-0.2258
0.105
0.91**
0.84**
0.55**
0.12
0.24
0.37
0.53*
0.83**
0.40*
0.88**
0.88**
Straw Correlati yield on with (kg/ha) grain yield
Studies on correlation and path coefficient analysis in rice crop as influenced by nitrogen fertilizer ..... 271
272
(1997). Of all the characters, plant height (0.88), total dry matter (0.88) and straw yield (0.91) seems to be highly correlated with the grain yield of rice. The dry matter production and grains per panicle though showed significant and positive correlation with grain yield (r = 0.88 and 0.12 respectively) of rice, yet had negative values (-0.270 and -0.370 respectively) in their direct effects. The path analysis revealed that plant height, number of leaves, LAI, tiller number, productive tillers, length of panicle, filled grains per panicle, test weight and straw yield were found to be most cardinal characters of grain yield as they had positive direct influence on grain yield of rice (Table 2). These results are in conformity with the findings of Sharma et al. (1997). The dry matter production and grains per panicle of rice had negative indirect effect on all characters under study. The effect of residual factors (0.214) over the grain yield
T.L. Neelima, V.B. Bhanu Murthy and A.V. Ramanjaneyulu
of rice indicates 21 per cent variability. It means characters studied in the present experiment accounted for 79 per cent of the variability. References Dewey, D.R. and Lu, K.H. (1959). A correlation and path coefficient analysis of components of crested wheat grass seed production. Agronomy Journal, 51: 515-518. Gupta, R.R. (1972). Interrelationship studies among some yield attributes in Rai [Brassica juncea (L.) Czern & Coss]. Madras Agric. J., 59: 421-425. Rangaswamy, R. (2005). A Textbook of Agricultural Statistics. New Age International (P) Limited Publishers. PP. 140-155. Sharma, S.K., Singh, D.P. and Singh, Correlation and path coefficient Indian mustard [Brassica juncea & Coss]. Haryana J. of Agron., 68.
P. (1997). studies in (L.) Czern 13(1): 64-
Madras Agric. J., 94 (7-12) : 272-276 July-December 2007 Research Notes
Genetical Studies In Rice (Oryza sativa L.) Under Saline Situation P. KARTHIKEYAN, Y. ANBUSELVAM, M. VENKATESAN AND K.PALANIRAJA Faculty of Agriculture, Annamalai University, Annamalainagar - 608 002. Variation is the basis of plant breeding. The success of any crop improvement programme will largely depend on the magnitude and range of variability in the available genetic stock. A critical estimate of genetic variability is a prerequisite for initiating appropriate breeding procedures in crop improvement programmes. The heritable variation is masked by nonheritable variation, which creates difficulty in
exercising selection. Hence, it becomes necessary to spilt over- all variability into its heritable and non-heritable components with the help of certain genetic parameters, which may enable the breeders to plan out proper breeding programme, since many characters of economic importance are highly influenced by environmental conditions. Therefore, the progress of a population mainly depends upon the amount