Madras Agric. J., 94 (7-12) : 147-150 July-December 2007
147
Genetic variability and path analysis in bellary onion (Allium cepa var. cepa L.) for storage losses M.ANANTHAN1 AND G.BALAKRISHNAMOORTHY2 1 Associate Professor, ICAR-KVK, CSRC, Ramanathapuram-623 503 2 Professor (Horticulture), ADAC&RI, Trichy. Abstract: Sixty-two genotypes of onion were collected and evaluated. The range, phenotypic and genotypic coefficients of variation, heritability and genetic advance for the thirteen characters were studied. In storage loss, higher estimates of genotypic and phenotypic coefficients of variation were recorded for bulb weight, reducing sugars, non-reducing sugars, total sugars, total loss and sulphur content. For storage loss, bulb weight, total loss, reducing sugars and sulphur content the higher heritability coupled with high genetic advance were registered. Path co-efficient analysis, indicted that the reducing sugars, protein and total loss had the strongest positive direct effect on storage loss. Key words : Onion. Genetic variability, Path co-efficient of variation
Introduction Bellary onion is one of the important vegetable crops grown for its bulb. It has high nutritive value and export potential. To improve the bulb yield and economic dry matter yield characters, information on genetic variability and inter-relationship among different traits is necessary. The improvement in any crop is proportional to the magnitude of its genetic variability present in the genotypes. The present investigation aimed at assessing the variability, analysis of association and path coefficient of different characters for storage loss. Materials and methods Sixty-two onion genotypes collected from the various parts of the country were grown in a randomized block design with two replications at Horticultural College and Research Institute, Tamil Nadu Agricultural University, Coimbatore-641 003 during rabi season of 200304. Each entry was transplanted accommodating 150 plants with a spacing 45x15 cm. All the
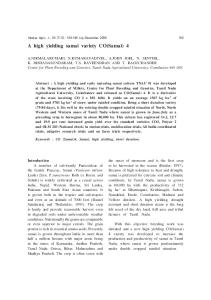
recommended package of practices was followed for raising a healthy crop. The observations were recorded on neck thickness, bulb weight, shape index, total soluble solids, moisture, dry matter, reducing sugars, non-reducing sugars, total sugars, pyruvic acid, protein, sulphur and total losses at 120 days after storage. The data were statistically analyzed to estimate phenotypic and genotypic coefficients of variation and heritability (Allard, 1960) along with path coefficient analysis by Dewey and Lu (1959). Results and Discussion A wide range of variations was obtained in most of the characters studied (Table 1). However, higher estimates of genotypic and phenotypic co-efficients of variations (GCV and PCV) were registered for bulb weight followed by reducing sugars, non-reducing sugars, total sugars, total loss in weight at the end of storage period and sulphur content of bulbs. The higher magnitude of heritability and genetic gain for bulb weight indicated that this important
M. Ananthan and G. Balakrishnamoorthy
148
Table 1. Variance, heritability (Broad sense) and genetic advance for storage characters of bellary onion (Allium cepa var. cepa L.) Characters
Genotypic variance
Phenotypic variance
GCV (%)
PCV (%)
Heritability (%)
Genetic advance
Genetic advance as per cent mean
0.02 388.64 0.01
0.02 397.67 0.01
16.28 54.21 11.08
16.40 55.83 11.15
98.52 95.34 98.86
0.27 58.32 0.23
33.28 109.75 22.70
Total soluble solids
1.80
1.83
11.92
12.02
98.40
2.74
24.37
Moisture Drymatter Reducing sugars
2.74 2.72 1.23
2.78 2.78 1.25
1.86 15.14 28.47
1.87 15.27 28.65
98.24 98.39 98.72
3.37 3.37 1.49
3.79 30.94 58.26
Non-reducing sugars
1.70
1.72
22.08
22.25
98.41
2.71
45.11
Total sugars Pyruvic acid Protein Sulphur
3.81 0.48 0.03 158.16
3.86 0.49 0.03 162.77
20.02 6.56 13.33. 21.94
20.15 6.61 13.45 22.26
98.12 98.37 98.29 98.73
3.49 1.41 0.34 38.74
40.97 13.40 27.23 45.13
Total loss at end of storage period
140.08
141.89
28.13
28.31
94.73
24.32
57.58
Neck thickness Bulb weight Shape index
economic trait could be improved by simple selection method. On the other hand, high heritability and low genetic gain were found for the remaining characters that suggested the role of non-additive genes for high heritability. Thus, these traits could be improved through hybridization and selecting the desirable recombinants in the segregating progenies. These results are in conformity with those of Randhawa et al. (1974) and Buso and Costa (1979), who had observed high heritability for bulb weight. However, McCollum (1968) reported lower heritability for bulb weight while Magdum (1981) registered the lowest heritability for shape index.
In the present investigation, the onion genotypes registered significant differences in chemical composition of bulbs also but range of variation was comparatively narrow when compared to morphological and storage characters. All biochemical constituents estimated showed very high values of heritability. However due to limited variation existed among the genotypes studied, the scope for improving these characters through selection also limited. Bajaj et al. (1980) reported narrow range of variability for dry matter and TSS contents, which was comparable with the results obtained in the present investigation. Patil and Kale (1990) obtained higher heritability for dry matter. Similar results were seen in the present investigation.
-0.0331 0.0428 -0.0109 0.0196
* Significant at 5 per cent level Residual effect = 0.2259
** Significant at 1 per cent level,
0.0219 0.0223 -0.0190 -0.0302 0.0006 -0.0058 0.0003 Su
149
Path analysis was carried out on thirteen storage related component traits and the results (Table 2) indicated that the maximum positive direct effect of reducing sugars and protein contents on total loss at the end of storage period indicating that among the component characters, reducing sugars and protein contents contributed maximum for total loss. Hence, in the selection programme these characters need a separate emphasis. This finding is in conformity with the results of Sharma et al. (1997). On the contrary, Bajaj et al. (1990) reported that maximum percentage of total sugars and reducing sugars led to minimum loss during storage period.
-0.1840
-0.0039 0.3648** 0.0100 -0.0228 -0.0404 0.0002 Pt
-0.0052
0.0017
-0.0185
-0.0119
0.0132
0.2964**
-0.0026 -0.0262 -0.1393 -0.0380 -0.0149 0.0001 PA
0.0043
-0.0052
-0.0164
-0.0233
0.0274
0.0356
0.0018 0.0236 -0.1500 -0.3540** -0.1112 0.0001 TS
-0.0045
-0.0045
-0.0411
-0.0517
0.0586
0.1866
0.0081 0.1429 -0.0066 -0.0873 -0.1379 -0.1036 -0.0116 0.0098 0.0223 0.0026 0.0001 NRS
-0.0013
0.0053 0.1068 -0.0150 0.7565** 0.5681** -0.2854** 0.0314 -0.0280 -0.0132 00006 0.0001 RS
-0.0004
-0.0068 0.0439 -0.0349 -0.1898 -0.0397 0.0002 DM
-0.0002
-0.0057
-0.0565
-0.0945
0.1092
-0.0801
0.0066 -0.0459 0.0343 0.1936 0.0408 -0.0002 Mt
0.0003
0.0053
0.0564
0.0946
-0.1091
0.0782
-0.0114 0.0767 -0.0261 -0.1659 -0.0208 0.0002 TSS
-0.0013
0.0023
-0.0878
0.0608
0.0703
-0.1919
-0.0003 0.0096 0.0115 0.0253 -0.0014 -0.0002 SI
-0.0007
0.0629
-0.0031
0.0080
-0.0099
0.0311
0.0065 -0.0646 -0.0205 0.0549 0.0185 -0.0001 BW
0.0291
-0.0016
0.004
0.0009
-0.0006
-0.0340
0.0106 -0.0644 .0100 0.0118 -0.1030 0.0061 0.0011 NT
0.004
0.0116
0.0183
0.0184
-0.0214
NRS RS DM Mt TSS SI BW NT Charac -ters
Table 2. Path coefficient analysis for storage studies of bellary onion (Allium cepa var. cepa L.)
TS
PA
Pt
Su
Genetic variability and path analysis in bellary onion (Allium cepa var. cepa L.) for storage losses
Besides, among the indirect effects of all the traits studied, reducing sugars through nonreducing sugars, protein through non-reducing sugars, total sugars through non-reducing sugars, moisture content through total sugars on the total loss at the end of storage period were positive and high. Hence, the total loss during the storage period in onion might be considered as the result of the high amount of reducing sugars, protein, total sugars, moisture content and low level of nonreducing sugars. Next to these traits, bulb weight, shape index and dry matter content also contributed the total loss at the end of storage period. The
150
results clearly indicated that these characters need emphasis in selection programme of onion genotypes for storage. The present findings are in conformity with that of Sharma et al. (1997). From the path analysis for storage studies, it was evident that reducing sugars, protein, total sugars and moisture content in the bulbs were the primary total loss determinants during storage and at the end of storage. The low residual effect registered in the present path analysis inferred that the components chosen to build up the path analysis appeared to be adequate and appropriate.
M. Ananthan and G. Balakrishnamoorthy
Bajaj, K.L., Kaur, G., Singh, J. and Gill, S.P.S. (1980). Chemical evaluation of some important varieties of onion (Allium cepa L.). Qualities Plantarum, 30(2): 117-122. Dewey, D.R. and Lu, K.K. (1959). A correlation and path analysis of components of crested wheat grass seed production. Agron. J., 51: 515-518. Buso, J.A., Costa, C.P. and Da, C.P. (1979). Heredity and correlations of onion bulb traits (Allium cepa L.). Pl. Breed. Abstr., 50(4): 3324. McCollum, G.D. (1968). Heritability and genetic correlation of soluble solids, bulb size and shape in White Spanish onion. Canadian J. Genet. Cytol., 10: 508-514.
Allard, K.W. (1960). In: Principles of plant Breeding, John Wiley and Sons, Inc., New York.
Magckiin, S.B. (1981). Genetic diversity in onion (Allium cepa L.) germplasm with special reference to storage quality. M.Sc. (Hort.) Thesis, Mahatma Phule Krishi Vidyapeeth, Rahuri, Maharastra.
Bajaj, K.L., Kumar, G. and Chadha, M.L. (1990). Varietal variations in some important chemical constituents of onion (Allium cepa L.). Trop. Sci., 30: 391-395.
Sharma, S., Sidhu, A note on varieties of Sci., 24(2):
References
A.S. and Bajaj, K.L. (1997). chemical evaluation of some onion (Allium cepa L.). Veg. 159-161.