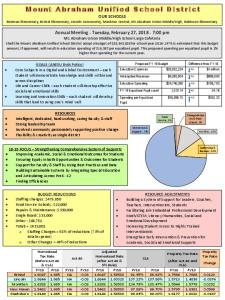
MAUSD Budget Presentation 12/18/17
I Believe...
Robin Sharma
“Change is hard at first, messy in the middle and gorgeous in the end.”
How did we get here?
We can reimagine the way in which we serve our students. MAUSD will emerge strong and prepared to improve outcomes.
Governor’s Office
6,3,1 cradle to career $80 Million hole declining population ● increasing poverty ● ● ● ●
1. Making VT More Affordable 2. Growing the Economy 3. Protecting the vulnerable
Agency of Education ● declining enrollment ● growing costs per pupil ● growing staff-student ratios
MAUSD Board No increase in cost per equalized pupil over 2017-2018 Set by the MAUSD Board on October 24
The Challenge Improve outcomes for students while spending less than in 2017-2018
Budget Target $24,587,256 No changes = approximately $1,100,000 over target
The Challenge ● Can’t be achieved with the same level of staffing ● Can’t improve outcomes for students by operating the same way with fewer resources
The Opportunity ● Evidence in the Ends Report suggests we need to change ● We can redesign the way we support students, faculty & staff ● We can improve outcomes for students and meet the budget target
The Opportunity
● Flexibility & creativity as single district ● Intelligent, dedicated, hardworking, caring faculty and staff ● Strong leadership team ● An involved community passionately supporting positive change
Max DePree
“We cannot become what we need to be by remaining what we are.”
Our Focus Areas ○ ○ ○ ○ ○
Improving outcomes for students Ensuring equity Support for faculty & staff Building sustainable systems Finding efficiencies
Where do we go from here?
Timber Stand Improvement An action whereby landowners remove trees and other vegetation from their woodlands with a focus on improving the woodlands’ ability to achieve its desired purpose.
References
● Education Quality Standards (Amended April, 2014) ○
A set of rules to ensure all students in VT public schools are afforded educational opportunities that are substantially equal in quality and enable them to achieve or exceed the standards approved by the State Board of Education
● Picus Odden & Associates Report (January, 2016) ○ Using the Evidence-Based Method to Identify Adequate Spending Levels ○
for Vermont Schools Prepared for the Vermont Legislative Joint Fiscal Office
● District Management Group Report (November 2017) ○ ○
Expanding and Strengthening Best-Practice Supports for Students Who Struggle Prepared for the Vermont Agency of Education
Comprehensive System of Supports ● Students ■ Social/Emotional ■ Academic ● Adults ■ Best Practices ■ Use of Data
Our Work How do we re-think, re-design and strengthen how we utilize the greatest resource in our budget - the faculty and staff - to achieve better outcomes for students as they relate to our priorities?
Priorities for MAUSD: (from the vtMTSS Field Guide) ● A Systemic & Comprehensive Approach ● Effective Collaboration ● High Quality Instruction and Intervention ● Balanced and Comprehensive Assessment System ● Well-Designed Professional Learning (Building of Expertise)
Comprehensive System of Supports
● Equity ■ Opportunities for students ■ Outcomes for students ● Integrated & Articulated ■ Special Education as part of the system ■ Articulated PreK - 12
Priorities for MAUSD: Strategic Plan Goals ● Expertise in Learning ● Social Emotional Learning and Physical Development ● Equity ● Community
Priorities for MAUSD:
Instructional Support Model ● part of a clearly articulated system ● focus on student achievement and collaboration throughout MAUSD ● clearly defined roles and responsibilities ● develops expertise throughout MAUSD
Instructional Support Model ● build and maintain capacity within and among all stakeholders: ○ Leadership, Curriculum Coordinators, Instructional Coaches, Teachers/Instructors, Interventionists and Special Educators, Additional Student and Systems Support (Support Staff, Volunteers, Community Partners, etc.)
Target FY 19 Education Spending $24,587,256
The Numbers
Total Education Equalized Spending Pupils
Spending per Equalized Pupil
FY 17
$23,861,663
1593.12
$14,977.94
FY 18
$24,902,985 (+$1,041,322)
1534.90 (- 58.22)
$16,224.50 (+ $1,246.56)
FY 19 (proposed)
$24,614,043 (- $288,942)
1515.44 * (- 19.46)
$16,242.18 (+ $17.68)
FY 19 Proposed is over target by $26,787 or $17.68 per EQP
Expenditure Comparison FY 18
FY 19
Total Expenses
$30,088,896
$28,853,027
Revenue
$5,185,911
$4,238,984
Education Spending
$24,902,985
$24,614,043
Equalized Pupils
1534.9
1515.44
Cost per Eq. Pupil
$16,224.50
$16,242.18
Target FY 19 Education Spending $24,587,256 FY19 Education Spending w/ No Changes $25,679,080 $24,587,256 $1,091,824 Over FY19 Ed Spending Target
Target FY 19 Cost Per Eq. Pupil Target $16,224.50 FY 19 Cost Per Eq. Pupil w/ No Changes $16,944.97 $16,224.50 $720.47 over per Eq. Pupil Target
Ed Spending Reductions to Achieve $1,091,824 in Savings Staffing changes: $603,094 Food Service Subsidy: $22,000 Repairs & Maintenance: $330,000 Single Board: $33,000 Totals = $988,094 Staffing Changes = 55% of reductions (73% of total expense) Other Changes = 45% of reductions
Staffing Reductions ●
16.16 FTE Support Staff Positions ○ 3.16 Custodian ○ 9.6 Special Education Assistants ○ .4 SLP - A ○ 3.0 General Education Assistants
●
11.9 FTE Professional Positions ○ 6 Core Classroom Teachers ○ 1.6 Special Areas Teachers ○ 1.0 Nurse ○ 2.5 Central Office Positions ○ .8 SLP (Currently Filled by Presence Learning)
●
.7 FTE Administrator Positions
Staffing Increases Explained ●
6.3 Coordinator/Coach/Interventionist ○ Building a System of Support for: ■ Leaders ■ Coaches ■ Teachers ■ Interventionists ■ Students ○ STEM, Humanities, Social and Emotional Development
●
1.2 Special Educators ○ Increasing Student Access to Highly Trained Interventionists
●
1.0 School Psychologist ○ Strengthen Early Intervention & Prevention for Academic, Social and Emotional Supports
Staffing Increases ●
8.5 FTE Professional Positions ○ 6.3 Coordinator/Coach/Interventionists ○ 1.2 Special Educators ○ 1.0 School Psychologist
● ● ●
16.16 FTE Support Staff Positions 3.4 FTE Professional Positions .7 FTE Administrator Positions
Net Staffing Reductions
Total Net Reductions: 20.26 FTE
Staffing Ratios
Staff:Students
FY 18
FY 19
1:4.6
1:4.9
FY19 Expense Breakdown FY 19 Expenses Instruction & Support Leadership & Business Facilities Transportation (to and from school)
$20,929,746.61
% of Expenses 72.54%
$3,215,044
11.14%
$3,578,815.44
12.40%
$956,352.57
3.31%
Food Service
$173,068.00
.60%
Totals
$28,853,027
99.99%