Molecular Ecology (1998) 7, 1441Ð1455
R E V I E W A RT I C L E
Mitochondrial DNA variable number tandem repeats (VNTRs): utility and problems in molecular ecology D AV I D H . L U N T, * L AW R E N C E E . W H I P P L E and B R A D L E Y C . H Y M A N Department of Biological Sciences, University of Hull, Hull HU6 7RX, UK, Department of Biology, University of California, Riverside, CA 92521, USA
Abstract Analysis of mitochondrial (mt)DNA size polymorphism in the form of variable number tandem repeats (mtVNTRs) has become an increasingly popular methodology for addressing questions in molecular ecology. When detected by PCR, mtVNTR analysis can provide a sensitive, rapid, and cost-effective measure of genetic variability that may be exploited in studies of population differentiation and biogeography. Despite the emergence of this approach, there has been little critical evaluation of its success or utility as a practical tool. In this review, we identify problematic methodological, theoretical and interpretive factors that can influence the utility of mtVNTR analysis. The reliability of the procedure is considered in terms of both detection of alleles and scoring of intra-individual allele frequencies. While many of the potential technical problems of the technique do not raise serious practical concerns, this rapid and sensitive methodology is seriously compromised by the difficulty of reliably assessing allele frequencies, of assaying only germline tissue, and in our ignorance of the mechanisms generating mtVNTR diversity. Thus, although there is a considerable potential for mtVNTR pilot studies to assess genetic diversity, the utility of the technique to resolve broader questions in molecular ecology should be treated cautiously until such a time as the system is better understood. Keywords: genetic subdivision, heteroplasmy, Meloidogyne, mtVNTR Received 9 January 1998; revision received 15 April 1998; accepted 17 June 1998
Introduction Animal mitochondrial DNA (mtDNA) is typically characterized as a highly economized genome with few sections of noncoding DNA, intergenic regions or repetitive sequences (Harrison 1989). An exception to this is the Ôcontrol regionÕ, commonly termed the D-loop in vertebrates or AT-rich region in invertebrates. The control region is thought to contain the sites of initiation of replication and transcription (of at least one strand and frequently both) including polymerase binding and termination sites (Clayton 1992). A frequent feature of many, but not all, control regions are short, tandemly repeated sequences, often predicted to fold into thermodynamically stable secondary structures. These repeats appear to be conserved in position across a range of
Correspondence: D. H. Lunt. Fax: + 44 (0) 1482 465458; E-mail:
[email protected] © 1998 Blackwell Science Ltd
(mostly mammalian) species and are hypothesized to be involved in the termination of transcription by nature of their complex secondary structure (Hoelzel et al. 1995; Casane et al. 1997; Wilkinson et al. 1997). It is worth noting, however, that in all but a small number of species the control region is designated as such by virtue of its lack of coding structure rather than any direct evidence for replicative or transcriptional involvement, and thus should more correctly be designated ÔputativeÕ. While size heteroplasmy (the coexistence of nonidentical mtDNA molecules in the same individual) was once thought to be very rare, it now appears to be a common occurrence, due in large part to the increased sensitivity of detection allowed by the polymerase chain reaction (PCR). In the vast majority of cases where mitochondrial genome size variation is observed it is a direct consequence of variable numbers of tandem repeats (VNTRs) in or adjoining the control region (Rand 1993; Hoelzel et al. 1995; Wilkinson et al. 1997).
1442
D . H . L U N T, L . E . W H I P P L E A N D B . C . H Y M A N which are greater than 1 bp in length and arranged in a direct (rather than inverted) orientation. Such repeats are almost invariably tandemly arranged, although short intervening sequences are very occasionally observed (see Table 1).
Such mitochondrial DNA VNTRs (mtVNTRs) have now been characterized at the sequence level in over 150 species (Table 1) and inferred by RFLP analysis from many more (see Rand 1993). Here we use mtVNTR to describe mtDNA repeat sequences in noncoding regions Table 1 mtVNTRs characterized at the sequence level Repeat size (bp)
No. of Repeats
Heteroplasmy
Reference
8 63 102
5 1Ð21 1Ð ≈ 50
No Yes No
Okimoto et al. (1991); Hugall et al. (1994); Whipple et al. (1998); D. H. Lunt et al. (unpublished)
Soil nematode Caenorhabditis elegans
43
6
ND
Okimoto et al. (1992)
Meadow grasshopperठChorthippus parallelus
777
2
No
Zhang et al. (1995)
Locust¤ Locusta migratoria
155
2
ND
Flook et al. (1995)
Crickets Gryllus spp. N = 2
220
1Ð7
Yes
Rand & Harrison (1989)
Honey bee Apis mellifera
196
1Ð3
ND
Cornuet et al. (1991)
Fruit fly*à Drosophila melanogaster
464 338Ð373
4 5
Yes Yes
Monteforte et al. (1993); Lewis et al. (1994)
Fish MinnowठCyprinella spiloptera
260
2Ð3
No
Broughton & Dowling (1994)
82 81
1Ð6 1Ð4
Yes Yes
Brown et al. (1992) Miracle & Campton (1995)
Cod Gadus morhua
40
2Ð6
Yes
çrnason & Rand (1992)
American plaice Hipploglossoides platessoides
61
2
ND
Lee et al. (1995)
Winter flounder 62 Pseudopleuronectes americanus
6Ð8
ND
Lee et al. (1995)
Yellowtail flounder Limanda ferruginea
62
6Ð8
ND
Lee et al. (1995)
Darters, Percidae N = 35
10Ð11
5Ð16
ND
Turner (1997)
Sea bass* Dicentrarchus labrax
17 48
1Ð19 6Ð19
Yes Yes
Cesaroni et al. (1997)
Amphibians Rice frogद Rana limnocharis
15
2
ND
Macey et al. (1997)
Frog Rana castesbeiana
40 11
6 9
ND ND
Yonema (1987)
Tree frogs Rhacophorus taipeianus R. moltrechti
40 40
4Ð5 7
ND ND
45
2
ND
Organism Invertebrates Root knot nematode* Meloidogyne spp.
Sturgeon* Acipenser transmontanus Acipenser oxyrhynchus
Clawed frog¦ Xenopus laevis
Yang et al. (1994)
Wong et al. (1983)
© 1998 Blackwell Science Ltd, Molecular Ecology, 7, 1441Ð1455
M I T O C H O N D R I A L D N A VA R I A B L E N U M B E R TA N D E M R E P E AT S Table 1 continued. Repeat size (bp)
No. of Repeats
Heteroplasmy
Reference
4Ð32
3- > 50
Yes
Berg et al. (1995)
Dunlin** Caladris alpina
4
18Ð23
ND
Wenink et al. (1994)
Turnstone** Arenaria interpres
7 11
1Ð14 1Ð8
ND ND
Wenink et al. (1994)
Loggerhead shrike Lanius ludovicianus
128
2Ð3
Yes
Mundy et al. (1996)
Chicken¦ Gallus domesticus
29
2
ND
Dejardins & Morais (1990)
Other vertebrates Carnivores** N = 21
2Ð10
14Ð103
Yes
Hoelzel et al. (1995)
Bats N = 41
78Ð85
2Ð9
Yes
Wilkinson et al. (1997)
Evening bat Nycticeius humeralis
81
5Ð8
Yes
Wilkinson & Chapman 1991
European rabbit Oryctolagus cuniculus
20 153
7Ð20 2Ð10
ND Yes
Mignotte et al. (1990); Dufresne et al. (1996); Casane et al. (1997)
Cottontail rabbit** Sylvilagus floridanus
124
8
ND
Casane et al. (1997)
European hare Lepus europaeus
140
6Ð7
ND
Casane et al. (1997)
Pika Ochotona refescens
178
4
ND
Casane et al. (1997)
Japanese monkeyà Macaca fuscata
160
1Ð3
Yes
Hayasaka et al. (1991)
Horse Equus caballus
8
2Ð29
Yes
Xu & çrnason (1994)
Donkey** Equus asinus
8 8
0Ð9 1Ð7
Yes Yes
Xu et al. (1996)
White rhinoceros Ceratotherium simum
10
10Ð35
Yes
Xu & çrnason (1997)
Sheep¦ Ovis aries
29 74
2 4
ND ND
Zardoya et al. (1995)
Catà** Felis catus
80Ð82 6Ð8
3 37
Yes ND
Lopez et al. (1996)
Pig Sus scrofa
10
14Ð29
Yes
Ghivizzani et al. (1993)
Lungfish Protopterus dolloi
25
3
ND
Zardoya & Meyer (1996)
Shrews* N = 5
78Ð79 12Ð14
1Ð5 14Ð22
Yes Yes
Stewart & Baker (1994); Fumagalli et al. (1996)
Organism Birds Ciconiiforme birds N = 15
ND, not determined. *Partial repeat copies at array ends. Noncoding region of undetermined function. àMinor length difference between repeats. ¤May include portions of tRNA, srRNA coding regions. ¦Nontandem, direct orientation. **Mosaic of subrepeats. © 1998 Blackwell Science Ltd, Molecular Ecology, 7, 1441Ð1455
1443
1444
D . H . L U N T, L . E . W H I P P L E A N D B . C . H Y M A N
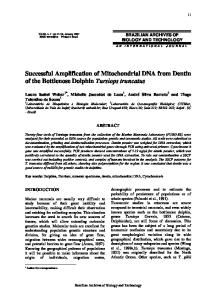
Central to many areas of biology are the concepts of population subdivision. mtDNA has been extensively utilized both in terms of character-based subdivision and haplotype frequency differences (Avise 1994), and the general characteristics which have lead to the popularity of mtDNA as a molecular marker for detecting genetic subdivision have been reviewed elsewhere (e.g. Harrison 1989; Avise 1994). The use of mtVNTRs as markers for detecting population substructure is increasing, due in part to both the increasing recognition of the importance of such data and the tractability of PCR-based approaches. The hypervariable repeats that comprise mtVNTRs allow sensitive frequency-based approaches to population subdivision, a strategy which may be particularly useful for analysing intraspecific variability when sequence divergence is not great enough to allow a cladistic approach. Several studies have specifically set out to use mtVNTRs as markers for population subdivision because mtVTNRs have the following properties: (i) they provide variability appropriate for the questions under consideration; (ii) they can be assayed rapidly, often with conserved PCR primers; (iii) they are easily scored on agarose gels; and (iv) they are applicable to analysis of small organisms or biological samples. An example of PCR-amplified mtVNTRs is shown in Fig. 1. Here, a 63 bp mtVNTR has been amplified from six individual root knot nematodes (Meloidogyne incognita) and shows considerable heteroplasmy in most samples but reveals one homoplasmic individual (sample 2) carrying only one mtDNA form at this locus. Differences can also be seen to exist in the intra-individual frequencies of the different amplified products. Despite its sensitivity the utility of mtVNTRs as a tool for population subdivision is as yet uncertain, however, because no study has examined the robustness, power and tractability of mtVNTRs in general.
Examples of mtVNTRs in molecular ecology There is now a very considerable number of mtVNTRs characterized at the sequence level (Table 1) and many
Table 2 mtVNTR genetic diversity apportioned between hierarchical levels Organism
Ci
Cip
Cpt
Root knot nematodes Sea bass Atlantic cod Evening bats
0.58 0.35 0.07 0.29 0.67 0.04 0.80 0.08 0.12 0.26 0.67 0.07
Reference
Whipple et al. (1998) Cesaroni et al. (1997)* çrnason & Rand (1992) Wilkinson & Chapman (1991)
Ci, diversity within individuals; Cip, diversity between individuals within the same population; Cpt, diversity between populations (Birky et al. 1989). *C values differ between the two mtVNTRs.
more described from RFLP studies (Rand 1993) with a growing number being used in the context of molecular ecology. Although most diversity (88Ð96%; see Table 2) is typically found within individuals, or between individuals within populations, some studies have found that the remaining diversity significantly differentiates between populations. Rand & Harrison (1989; Rand 1994) have used PCR-amplified mtVNTRs and mtDNA restriction fragment length polymorphisms (RFLPs) of the American field and beach crickets Gryllus pennsylvanicus and G. firmus, respectively, to address questions concerning the phylogeography and separation of these species. Analysis of mtVNTR frequencies revealed significant differences between the two species in pure but not in hybrid populations. Cesaroni et al. (1997) have employed PCR analysis of mtVNTR variation in populations of the sea bass Dicentrarchus labrax and were able to detect differences between eastern and western Mediterranean regions. Wilkinson & Chapman (1991) were able to differentiate between both eastern USA colonies and specific matrilines of the evening bat Nycticeius humeralis using copy number and frequency differences in a D-loop 81 bp repeat. Mundy et al. (1996) characterized the copy number of a 128 bp tandem repeat in the endangered San Fig. 1 Root knot nematode 63 bp mtVNTRs. Nematodes were assayed by PCR amplification as described previously (Hyman & Whipple 1996). Lanes 1 and 8 are a 123 bp size ladder. Lanes 2Ð7 are individual nematodes. Lane 2 is homoplasmic for 10 repeats while other nematodes show variable heteroplasmy of repeat numbers and frequencies.
© 1998 Blackwell Science Ltd, Molecular Ecology, 7, 1441Ð1455
M I T O C H O N D R I A L D N A VA R I A B L E N U M B E R TA N D E M R E P E AT S Clemente loggerhead shrike (Lanius ludovicianus mearnsi) and observed an absence of certain alleles in the endangered island population compared to the mainland, possibly due to the effects of reduced population size. Wenink et al. (1994) amplified and sequenced the control region from several representatives of two shorebirds, the dunlin and turnstone, from geographically separated regions. Although mtVNTR copy-number differences were observed between locations, the authors suggest that these repeats may be useful more as Ôa kind of mtDNA fingerprint for individualsÕ than in differentiating isolated populations. Miracle & Campton (1995) surveyed mtVNTRs in the threatened Gulf of Mexico sturgeon Acipenser oxyrhynchus desotoi in the Suwannee river. They were unable to detect a phylogeographic pattern in the incidence of heteroplasmy of this 81 bp repeat, a result that they indicate is consistent with a recent bottleneck event for this subspecies. çrnason & Rand (1992) assayed the apportionment of mtDNA size variation in Atlantic cod (Gadus morhua) sampled from the Icelandic and northeastern American coasts. Although the mtVNTR diversity revealed little genetic structuring, the authors note that this compared very favourably to the complete lack of nucleotide sequence variability detected between samples in the hypervariable D-loop region. For mtVNTR amplification, as for any other technique, it is necessary to determine whether the data produced accurately reflect heritable allele frequencies occurring within the organismsÕ germline. Furthermore, it is essential to determine the power of the approach at different levels of study. For example, is the technique of most use in resolving intra- or interspecific differences? We consider below a series of questions addressing the power and consistency of mtVNTRs. From a methodological viewpoint, a distinction is made between those studies which try to score only the presence or absence of an allele, and those which also try to score their frequencies within an individual.
Are the bands amplified consistently? In our studies, and those of other workers who have addressed these issues, identical banding patterns are
1445
amplified from replicates of the same DNA sample. In this respect mtVNTRs are not different from standard PCR with well-designed primers and should not pose problems of reproducibility. It is worth noting that we have experienced variable success with different commercially available polymerases, reaction volumes and MgCl2 concentrations. This variability has not been in generating artefactual bands, merely in failing to amplify all but the most robust alleles in poorly optimized PCR conditions. It seems essential, therefore, to carry out extensive optimization procedures before data collection is attempted to ensure that reaction conditions are not at a threshold of amplification.
Are the bands detected consistently? Although the amplified bands do not typically differ between replicates, the detection and scoring of amplified mtVNTRs can be a significant source of error. Our method of choice is 2.5% TBE buffered agarose (Sambrook et al. 1989) prestained with ethidium bromide (2.5 µg/mL) and run in TBE, containing ethidium bromide, at ≈ 5 V/cm (i.e. slowly). Significantly different band profiles can be obtained by varying these gel conditions. Figure 2 shows equal aliquots of the same two PCR reactions run on gels of different resolving powers, such as are typically described in the literature. These gel images illustrate that a consequence of running mtVNTRs on too low a percentage gel, or of poor stainingÐdestaining, may be that only the major alleles are detected. Here we use Ômajor allelesÕ to mean those most frequent and readily observable alleles (which will probably be amplified and detected even under suboptimal conditions), and Ôminor allelesÕ as the other, less abundant, types. Thus in Fig. 2 it is tempting to score the mtVNTR patterns differently between the different gel replicates even though they are identical aliquots from the same reaction tube. This is particularly evident for the smaller, less abundant minor alleles. Densitometric analysis of these gel images did not improve the consistency of the analysis. Although such quantitative treatments do allow the estimation of relative allele frequencies, if bands are partially comigrating, or so dif-
Fig. 2 Fractionation of mtVNTRs under different electrophoresis conditions. Scoring of allelic variants may not be consistent between gels even though DNA samples are identical aliquots from the same reaction tubes. Agarose gel concentrations: (a) 0.9%; (b) 1.25%; (c) 2.5%.
© 1998 Blackwell Science Ltd, Molecular Ecology, 7, 1441Ð1455
1446
D . H . L U N T, L . E . W H I P P L E A N D B . C . H Y M A N
fuse that the signal is only slightly above background, the determination of band identity and frequency remains compromised. While this example is not intended to be a complete determination of ideal gel conditions for mtVNTRs, and different conditions will be appropriate for repeats of different lengths, it does illustrate very clearly that a certain degree of subjectivity is often present in how allele classes are scored. These scoring vagaries should not be a problem if complete representation is not essential, and the treatment is consistent across samples. In practice, however, this is rarely the case and comparison of these observations to those described in many studies indicates that investigators may typically ignore all but the major allele classes present within their samples. This type of error may compromise frequency-based assays to a greater extent than allele presence/absence approaches.
Do PCR assays accurately reflect mtVNTR allele populations? There exists, of course, a tacit assumption that the mtVNTR size classes assayed by PCR are a faithful representation of the mtVNTRs present within the organism. That is, output from the PCR accurately reflects the input template DNA. This is not necessarily an unreasonable a priori assumption. Several of the causes for violation of this assumption are considered below. Although their relative importance is not yet well investigated, they are still very much worth considering because to ignore them in experimental design or data analysis may ultimately prove costly.
Null alleles There are several documented reasons for the inability of repeat arrays to be amplified by PCR primers. Microsatellite VNTR analysis occasionally reveals Ônull allelesÕ, which are thought to occur when mutations at the primer-binding site disrupt the ability for the oligonucleotide to anneal (Callen et al. 1993). Thus, although the repeat locus is present, no VNTRs are detected. These are likely to be of small concern to analysis of mtVNTRs as flanking region mutations are known to be much less frequent than repeat number changes (çrnason & Rand 1992; Miracle & Campton 1995) and are unlikely to significantly influence the data. PCR can also be prevented from amplifying the locus if the intervening sequence has sufficient secondary structure to prevent the polymerase from reaching the second primer site, and this is particularly relevant to GC-rich templates (Landre et al. 1995). Secondary structure problems are unlikely to prevent amplification of mtVNTRs as control regions typically contain neutral to AT-rich sequences which, even in the
absence of specific procedures to alleviate such PCR problems (e.g. Landre et al. 1995), will typically melt at 72 ¡C extension temperatures.
Size-biased amplifications Perhaps of more concern are questions surrounding the ability of most thermostable polymerases to amplify with equal efficiency across different repeat sizes. Although repeat arrays are typically short (less than 1 kb, see Table 1), they can occasionally expand to sizes that may prevent amplification by standard PCR protocols. This should not pose a significant problem with due attention. In the species with which we are most familiar, the root knot nematode Meloidogyne javanica, the repeat arrays described by Okimoto et al. (1991) revealed a 102 bp tandem repeat of ≈ 3 kb, and transfer hybridization experiments have revealed this array to reach sizes close to double this length in some Australian isolates (Hugall et al. 1994). With one possible exception (Xu & çrnason 1994), the mtVNTRs characterized to date show predominantly continuous, and often normally distributed, size classes (Fig. 3). This might suggest that investigators would probably be aware of a large class of alleles absent due to PCR nonamplification, as such amplification size limits would truncate the distribution and be apparent upon inspection of the data. Although systematic size biases may conceivably act to produce an artefactual, yet Gaussian, distribution, it seems unlikely because, even with relatively large array sizes, transfer hybridization experiments and direct cloning approaches indicate that PCR amplification of mtVNTRs is not size biased (Fig. 4, discussed below, and Xu & çrnason 1994). Should amplification size become problematic with standard procedures many protocols exist for long PCR which can comfortably amplify any size of mitochondrial repeat array (Barnes 1994). A second problem which might influence the recovery of representative data could be preferential amplification of shorter repeat arrays. Given appropriate extension times, we find no evidence of selective recovery of only shorter mtVNTRs. The existence of such bias can be examined by mixing together known molar amounts of cloned repeat arrays into different ratios, and testing the limits of detection. In our studies a large repeat array (11 repeats, 693 bp) was consistently amplified even when a 50:1 excess of a shorter array (two repeats, 126 bp) was used as the starting template mix (our unpublished data). An approach to detecting amplification frequency bias involves examining the repeat size class distribution. One might expect that the distribution of allele sizes would be skewed towards shorter PCR products if a significant bias existed for amplification of shorter arrays. Such skewed distributions have not been observed in any of our studies © 1998 Blackwell Science Ltd, Molecular Ecology, 7, 1441Ð1455
M I T O C H O N D R I A L D N A VA R I A B L E N U M B E R TA N D E M R E P E AT S
1447
Fig. 3 Allele frequency histograms revealing differences in frequency distribution profiles. With the exception of the root knot nematode, figures are redrawn from published data. A. Horse 8 bp repeat (Xu & çrnason 1994). B. Sea bass 17 bp repeat (Cesaroni et al. 1997). C. Root knot nematode 63 bp repeat. D. White rhinoceros 10 bp repeat (Xu & çrnason 1997). E. Sea bass 48 bp repeat (Cesaroni et al. 1997).
(even when comparing 106 pooled nematodes with a very large range of allele sizes), and only very rarely in published studies (Fig. 3) despite orders of magnitude variation in minimum and maximum array sizes (see Table 1). Some previous studies have suggested that biological processes, such as selection for smaller repeat size or directional mutation bias, may influence the distribution of VNTR size classes (Rand & Harrison 1986; Cesaroni et al. 1997; Wierdl et al. 1997). As such, skewed distributions to smaller size classes may potentially be either a biological process or a methodological laboratory artefact and should be noted early by investigators and the causes © 1998 Blackwell Science Ltd, Molecular Ecology, 7, 1441Ð1455
carefully determined by manipulation of amplification conditions. Given a suitable extension time it may be imagined that all alleles would amplify in a representative fashion. In practice, however, polymerase stalling is thought to be a major cause of failure to amplify longer targets (Barnes 1994). The underlying reasons for this may involve those polymerases without 3Õ-exonuclease activity being sensitive to extension from misincorporated nucleotides. Thus, polymerase mixtures that can incorporate 3′-exonuclease activity along with excess concentrations of nucleotide precursors (especially for base-biased templates) may alleviate these problems. A related con-
1448
D . H . L U N T, L . E . W H I P P L E A N D B . C . H Y M A N
Fig. 4 Comparison of allele frequencies measured by PCR and transfer hybridization. The 63 bp Meloidogyne mtVNTR allele frequencies are plotted as a function of repeating copy number. A. Pooled allele frequencies of PCR amplification products from eight individual nematodes. B. Allele frequencies measured using transfer hybridization of cellular DNA from bulked nematodes of the same isolate. Inset represents digoxygenin-detection of alleles aligned with measured allele frequencies.
cern might arise from poor-quality DNA templates, such as are often encountered when working with field-preserved specimens or museum samples. In such circumstances there is the potential for differential degradation of mtVNTRs with different lengths. Given the extremely high copy number of mtDNA it is not yet clear to what extent this differential degradation would depress the representation of longer alleles. Without systematic investigation of such factors it will be difficult to conclude that skewed size distributions are due to purely biological processes. These same processes will also impact the accurate estimation of relative allele frequency data within an individual, particularly among allele classes of significantly different size (see below).
Nonhomogeneous tissues A further concern, particularly for large and long-lived animals, is the distribution of mtVNTRs across tissue types. As mtVNTRs are frequently hypervariable, and drift (and/or selection) may rapidly change the frequencies of mtDNA polymorphisms (Koehler et al. 1991; Jenuth et al. 1997), different tissue types or body locations can contain significantly different frequencies or classes of mtVNTR. The distribution of mtDNA point mutations in mice (Jenuth et al. 1997) and of mtVNTRs in rabbits (Casane et al. 1994) have revealed that different tissue
types contain variable allele frequencies which seem to be brought about by both drift and tissue-specific selection. Such tissue-specific mtDNA compositions also seem to play an important role in several human pathologies (Wallace 1994). There is no reason to suspect that this condition would not also hold for small animals. In Meloidogyne nematodes (which may possess ≈ 1000 cells and therefore have complete body representation in the PCR reaction), the mutation rate for the 63 bp mtVNTR appears to be very high and our investigations indicate that there can be noticeable allelic differences between sibs (Whipple 1997), perhaps indicating somatic mutation and drift. As mtDNA in the germline is a very small percentage of the total body mtDNA, the DNA assayed has the potential to be different from that component which is passed on to the next generation. A productive approach, until such time as frequency differences between germline and somatic mtDNAs are better characterized, would be to only sample germline tissue. In practice, however, few studies have taken this approach and it may prove impractical for small organisms or for studies processing large numbers of individuals.
Is the frequency of alleles accurately assayed? For the investigator, when assaying mtVNTRs present within an individual, one is able to score them in either a © 1998 Blackwell Science Ltd, Molecular Ecology, 7, 1441Ð1455
M I T O C H O N D R I A L D N A VA R I A B L E N U M B E R TA N D E M R E P E AT S qualitative (presence/absence) or quantitative (relative frequency) manner. Qualitative assessment was discussed above with respect to reliable scoring of size classes. Quantitative approaches, however, are much more powerful because data set variability is not limited by the number of size classes maintained; rather the addition of a frequency component greatly expands the potential variation within the dataset. In contrast to techniques which have a longer history in population biology of allele frequency analysis (e.g. allozymes and microsatellites), mtVNTR alleles are found at variable frequencies within an organism as well as at different frequencies between different populations. This nested variability is the basis of the development of hierarchical statistics for assaying allele diversity (Birky et al. 1989). Although different hierarchical levels may be addressed depending upon the nature of the study, values are typically assigned to the amount of genetic diversity observed within an individual (mtDNA diversity as heteroplasmy; Ci) the diversity among individuals within a deme (Cip) and the total diversity among demes (Cpt). It is interesting to note that, unlike DNA sequence polymorphisms, most studies record a large proportion of the total diversity within individuals (Ci; Table 2). Relating the quantitative measurement of PCR product to initial template concentrations is a difficult process requiring careful consideration. This is emphasized by the literature on quantitative PCR (e.g. Diaco 1995; Koehler 1995). Although one may be able to standardize conditions among samples processed simultaneously, small differences between trials may significantly influence amplification profiles. As the estimated frequencies are relative to each other, in that comparisons are made between products in the same reaction tube, mtVNTRs are typically robust to these concerns. Certain experimental conditions may influence the relative frequencies, however, including the PCR cycle number and initial template DNA concentration (Jeffreys et al. 1988). Direct tests of the efficiency of PCR in recovering mtVNTR frequencies are possible by utilizing transferhybridization approaches. Figure 4 shows the results of such an experiment for the 63 bp mtVNTR of the phytonematode M. incognita. Total genomic DNA was prepared from ≈ 106 juvenile nematodes, digested with the restriction enzyme DdeI (which cleaves adjacent, but external to, the repeat array), fractionated on a 1.5% agarose gel, transferred to a nylon membrane and probed with a digoxygenin-labelled 63 bp repeat sequence using standard techniques (Sambrook et al. 1989). Eight randomly chosen individuals from the same isolate were each amplified using 63 bp mtVNTR-specific PCR primers as described previously (Hyman & Whipple 1996; Whipple 1997). Comparisons of the size class frequency histograms taken from the PCR amplification (Fig. 4a) and transfer© 1998 Blackwell Science Ltd, Molecular Ecology, 7, 1441Ð1455
1449
hybridization experiment (Fig. 4b) show strong similarity. Both experiments revealed allele sizes ranging from five to 12 repeats. In both histograms the most frequent size class is seven repeats, with 10 repeats also being a major component. The frequency plots are not entirely identical, which may be explained in large part by the several orders of magnitude difference in sample sizes. The figure does illustrate, however, that PCR is at the very least broadly representative of the template sizes and concentrations found in vivo.
Assaying for population subdivision For a technique to be useful and tractable as an estimator of genetic subdivision it needs to fulfil many of the experimental criteria discussed earlier. One of the most important considerations, however, is that it should have a mutation-fixation rate appropriate for the questions being addressed. That is, the mutation rate to new allele classes and heritable changes in frequency should occur rapidly enough that genetically isolated populations can be readily differentiated, yet not so frequently nor unequally that they saturate, or homoplasy becomes problematic. What then are the typical rates and patterns of mutation in mtVNTRs and how do these influence the detection of genetic subdivision?
Mutation rates in mtVNTRs The mutation rate to different size classes appears large, illustrated by the fact that heteroplasmy is detected in very many organisms with frequencies of heteroplasmic individuals up to 100% (Table 1). This implies that the mutation rates are greater than the coalescent processes for these molecules. Several factors may influence drift and coalescence, including the size of the germline bottleneck, although one would expect them to apply equally to synonymous point mutations as well as mtVNTRs. In practice, length heteroplasmy is much more frequently detected than sequence heteroplasmy (e.g. çrnason & Rand 1992). This may be due to either the ease of detection of length heteroplasmy, higher selective constraints on point mutations, or a higher mutation rate. Rand & Harrison (1989) have estimated the per generation mutation rates for mtVNTRs in the cricket Gryllus firmus to be in the order of 10Ð4. Wilkinson & Chapman (1991) studied mtVNTR copy-number changes in motherÐoffspring pairs of the evening bat Nycticeius humeralis and estimated a per generation mutation rate of 10Ð2. MotherÐoffspring pairs of European rabbits have been used to estimate a very similar (10Ð2) per generation mutation rate (Casane et al. 1994). Typical values for accumulation of mtDNA point mutations in humans have been thought to be in the order of 10Ð6Ð10Ð8 (estimated from Brown et al. 1979;
1450
D . H . L U N T, L . E . W H I P P L E A N D B . C . H Y M A N
Kondo et al. 1993). A recent study sequencing the hypervariable domains of the human control region from large pedigrees, however, indicates a per generation rate larger than previously reported and much more similar to those observed for mtVNTRs (Parsons et al. 1997). It is hard to directly compare mtVNTR and point mutation rates, however, as estimates are derived from different taxa and mutational rates are known to vary significantly both between different regions of the mtDNA molecule and between different mtVNTRs in the same organism. For nuclear VNTR arrays it has been suggested that both repeat unit length and repeat array length may be correlated with mutation rate (e.g. Wierdl et al. 1997). Whether this relationship holds for mtVNTRs, however, is far from clear. For example, in the Meloidogyne system, where repeating units are 8, 63 and 102 bp in length, the 63 bp mtVNTR appears to be 2Ð3 times more mutable than the 102 bp array, with change in 8 bp copy number a very rare event (D. H. Lunt, B. C. Hyman, unpublished). Bacterial plasmid systems have been used to investigate the influence of DNA structure on the frequency of sequence deletions and duplications (Trinh & Sinden 1993). These experiments indicated that the frequency of deletion or duplication could vary more than 500-fold in a sequence-dependent fashion. Similar results implicating the sequence-specific nature of microsatellite mutation rates and the influence of their flanking sequences have also been obtained in primates (Jurka & Pethiyagoda 1995). There may well be many competing factors that influence change in mtVNTRs which are repeat-specific and as yet poorly investigated. This indicates that it is important to assay the variability with a pilot study before embarking upon a large project as mutation rates may vary considerably both among and within taxa.
Models of the mutational process An important consideration in using mutational events to estimate diversity levels is to have a conceptual model of the nature of the mutational process. This allows one to assess the relative importance of different types of change, ascertain whether certain alleles are more closely related than others, and make some prediction about the likelihood and extent of homoplasy. Traditionally, two extreme models have been applied to VNTRs, although neither was developed with tandem repeats in mind. The stepwise mutation model (SMM) (Ohta & Kimura 1973) allows the addition or subtraction (with equal probability) of a single unit from the current allele size, and may result in convergence on a repeat size already present in the population (homoplasy). In contrast, by the infinite allele model (IAM) (Kimura & Crow 1964) the mutational process can change the current allele
size by any number of units and will create novel alleles not previously present in the population. Although the small changes involved in SMM may seem more intuitive to many researchers who have worked with simple repeat arrays, determining which model best fits microsatellite VNTR data has been problematic (Jarne & Lagoda 1996). The IAM, for example, has been suggested to be particularly applicable for microsatellites where the loci studied contain multiple continuous (compound) repeats which may have many and more-complex states (Estoup et al. 1995). This situation may be comparable to those mtVNTRs described in Table 1 as having a mosaic of subrepeats. More recently two new models have been applied to microsatellite data and both are consistent with the observed or hypothesized behaviour of mtVNTRs. The two-phase mutation model (TPMM) (Di Rienzo et al. 1994) is related to the SMM and states that a mutational change will result in a single step with probability P and a multistep change with probability 1 Ð P. The TPMM, similar to the SMM, assumes a symmetrical mutation process with equal an likelihood of increase or decrease in allele size, with the number of units by which mutation changes the array size in the multistep phase being drawn from a geometric distribution. Thus the TPMM incorporates rare but major changes in repeat array size alongside a more conservative mode of change, and Di Rienzo et al. (1994) discuss evidence for microsatellites that this may be due to more than one mutational pathway. A similar situation may exist for mtVNTRs where slipped strand mispairing (the misalignment of repeat units during replication, Levinson & Gutman 1987) might be responsible for the frequent small changes observed in many systems, with inter- or intramolecular recombination (Lunt & Hyman 1997) causing gross changes in array size. The model of Garza et al. (1995) may be used to address the interaction of physical constraints upon mtVNTR size and the existence of a nonsymmetrical mutation process leading to systematic increase or decrease of array size. It has been suggested that replication time may be of critical importance to the propagation of mtDNA molecules, with smaller genomes replicating more rapidly and prospering (Rand & Harrison 1986). On the other hand, significant amounts of mtDNA are present as mtVNTRs in some taxa (≈ 5kb in some Meloidogyne spp.) and their position at, or adjacent to, origins of replication may indicate that they promote their own copy-number amplification. Some form of selection will certainly limit the maximum array size and it may be that these physical constraints and biased mutation processes need to be taken into account to achieve a realistic model of mtVNTR mutation. The models of Birky et al. (1983, 1989), which are frequently used for mtVNTR anaysis (e.g. Rand & Harrison 1989; Wilkinson & Chapman 1991; çrnason & Rand 1992; © 1998 Blackwell Science Ltd, Molecular Ecology, 7, 1441Ð1455
M I T O C H O N D R I A L D N A VA R I A B L E N U M B E R TA N D E M R E P E AT S Cesaroni et al. 1997; Whipple et al. 1998) assume an IAM, and seem more applicable to organelle sequences or mosaic repeats than mtVNTRs. Models based on the SMM may be more realistic for simple (not mosaic) mtVNTRs yet in terms of population differentiation one must then consider whether the amount of homoplasy (which is implicit in SMM) will influence the data set. Certainly this will be problematic if one intends to use diagnostic alleles which are reasonably similar in size to other alleles in the population. More empirical data will be needed to determine whether there is any consensus in the way in which mtVNTRs evolve and to assess which evolutionary models best fit the data. However, at the present time, caution should be employed in assessing the robustness of diversity indices which may be founded on unsubstantiated models of mutational change.
How does mutation change copy number? We can examine published frequency profiles to estimate to some degree the nature of the changes involved in generating mtVNTR diversity. One might expect that if, for instance, repeat gain were more frequent than repeat loss the distribution of allele sizes would be skewed towards larger repeat sizes. Although such skewed distributions are not typical, they are occasionally detected (see Fig. 3). A problem with trying to deduce genetic processes from allele size distributions is the compounding effects of biased allele amplification and detection (see above), and the (putative) effects of selection for array size (e.g. the Ôrace for replicationÕ discussed in Rand & Harrison 1986). Most available allele size distributions appear to approximate Gaussian curves, although as additional systems are rigorously scored by PCR, a technique sensitive enough to reveal the lowest frequency alleles expected at the tails of the distribution, we may come to better understand the generality of this statement. Frequency distributions of a very different nature are also found in the literature. The 8 bp mtVNTR found in the horse control region was studied in a single individual by both direct cloning of mtDNA and PCR amplification of the repeats (Xu & çrnason 1994). The frequency distribution appears to be bimodal with the bulk of clones appearing to have larger repeat copy numbers (Fig. 3). Although in certain experimental circumstances it might be imagined that normal distributions could be produced by PCR amplification biases, it is hard to explain the highly faithful recovery of frequency profiles observed by Xu & çrnason (1994) in the horse as an artefact. Here very similar sizeclass distributions were produced by both direct cloning from purified mtDNA and PCR amplification. Moreover, there was no apparent PCR bias towards the shorter template repeat arrays. Skewed distributions have been reported for the short (17 bp) repeat, but not the long © 1998 Blackwell Science Ltd, Molecular Ecology, 7, 1441Ð1455
1451
(48 bp) mtVNTR in the sea bass (Cesaroni et al. 1997). A complicating factor with distributions skewed towards low repeat numbers is the repeat-size history. For example, if the original progenitor of a certain population was homoplasmic for a repeat size of three, and there were equal mutation probabilities (by a single step) in either direction, the distribution would tend to become skewed because zero repeats provides an absolute lower limit to the distribution. Such a distribution might resemble that in Fig. 3B. It is difficult therefore to distinguish selection from historical factors, and other approaches need to be taken before conclusions can be made about which biological processes are operating. Apparent Gaussian repeat frequency distributions are shown in Fig. 3 by M. incognita nematode 63 bp repeats, the 48 bp mtVNTR of the sea bass (Cesaroni et al. 1997), and the 10 bp mtVNTR of the white rhinoceros (Xu & çrnason 1997). Although simple models of repeat number change are frequently invoked for nuclear VNTRs, there remains no consensus (Jarne & Lagoda 1996), and the mechanistic nature of mtVNTR size mutation is no clearer. Slippedstrand mispairing (Levinson & Gutman 1987), illegitimate elongation (Buroker et al. 1990) and recombination (Lunt & Hyman 1997) are all mechanisms for altering mtVNTR copy number, and indeed may all act at different times in the history of a repeat array. While slipped-strand mispairing and illegitimate elongation may produce the most frequent changes, copy-number changes may be less dramatic than intramolecular recombination which is known to cause large deletions in the Meloidogyne repeat arrays (Lunt & Hyman 1997) and may cause very rapid shifts in copy number. Although Casane et al. (1994) have shown in the European rabbit that mtVNTR deletions of one repeat copy are more frequent than deletions of two, which are in turn more frequent than deletion of three repeats, many more pedigree and heteroplasmy studies are necessary to effectively characterize the nature of change typically observed in mtVNTRs. Once this information becomes available, however, it will allow us to greatly refine estimates of genetic divergence using mtVNTRs.
Identification of genetic subdivision Repeat arrays of identical copy number may be a consequence of shared ancestry or convergence from alleles of different sizes following mutation. If one does not assume an IAM of mutation to different mtVNTR copies, the existence of repeat number homoplasy must be acknowledged to some degree. As such, simple band-sharing indices are prone to potentially significant sources of error and should be used with caution. Such problems of homoplasy can be imagined to increase with increasing taxonomic distance, although the amount of homoplasy
1452
D . H . L U N T, L . E . W H I P P L E A N D B . C . H Y M A N
will also be influenced by the mutational behaviour of the locus in question (see above). Alternatively, however, the coalescence of different populations or species to very different (and completely diagnostic) array sizes has probably occurred between more distantly related taxa, although in practice this has not yet proved a reliable tool in extended studies of animal systems (Hugall et al. 1994; Wilkinson et al. 1997; Whipple et al. 1998). Hierarchical statistics are frequently employed to better understand the apportionment of diversity between organismal levels, including between demes (Birky et al. 1989; Rand & Harrison 1989). A likelihood ratio test, or Gtest (Sokal & Rolf 1987), of subdivision is combined to estimate whether allele frequency distributions are significantly different between taxa. Even relatively small proportions of the total diversity (e.g. Cpt = 4.3%, Cesaroni et al. 1997) have been suggested as sufficient to distinguish between populations from geographical localities. On a cautionary note, Whipple et al. (1998) found that the magnitude of these differences was independent of the known genetic relationships between the populations under study. Thus populations which had been separated and maintained in culture for less than 20 generations showed as much interpopulation diversity (Cpt) as isolates of a much more distant relationship sampled from geographically widespread locations. Unfortunately this appears to be the only example for which the historical relationships between the populations under study are well determined. The examples of mtVNTRs in molecular ecology published to date indicate that they are most applicable to the study of intraspecific phylogeography or the separation of closely related species. Presently, however, there are ambiguities concerning the mechanism(s) of generating mtVNTR variation and the models for describing these. Consequently the statistics for describing genetic subdivision from mtVNTR data may require cautious interpretation. In particular, until such time as more studies are carried out, and comparisons can be made using multiple molecular methodologies, the real diagnostic power of Cpt ranging from 4% to 11% (Table 2) will remain unclear.
Discussion mtVNTRs as genetic markers mtVNTRs have many characteristics which make them powerful and tractable tools for the analysis of genetic diversity, although, as cautioned throughout this review, some attention needs to be paid to their utility in each specific situation. mtVNTRs can be highly variable, allowing discrimination of intraspecific populations which have diverged only recently. Alternatively, these repeat arrays
can exhibit very little or no copy-number variation even between more divergent samples. Although mtVNTRs are not universally available in all species, as are some sequence-based approaches or random amplification techniques, they are characterized in over 150 species (see Table 1) and may prove a frequent and useful option for many researchers. This PCR-based methodology has proved rapid, inexpensive and technically uncomplicated in our studies, but we caution that some significant investment in initial characterization is necessary to obtain suitably reliable data. The information produced is in the form of both frequency and character state data, allowing a range of analysis options, although as mutation rates may be quite high in some systems, homoplasy must be carefully considered in interpretation of mtVNTR data.
Reliability and reproducibility of the technique The technique of sampling and scoring mtVNTRs appears to be both reasonably robust to small technical errors and reproducible between samples. When experiments are carried out under standardized conditions these should not significantly affect the analysis as comparisons using this technique are relative band frequency comparisons within a sample. The main concern should be to standardize treatments across samples, especially with respect to template concentration and PCR conditions, because suboptimal amplification conditions may significantly influence the number and frequency of bands scored. Many of the concerns outlined above involve the subjective nature of character and frequency scoring and it is very important for authors to include reproducibility tests and to analyse data sets for distribution skews, as these may reveal any intrinsic bias in the generation of allele states or frequencies. It is unfortunate that mtVNTR assays may not be suitably consistent between laboratories as this does not allow studies to be extended, rechecked or added to a database by other workers without rescoring all previous samples. This is a major weakness of this technique and will not diminish, particularly as the creation of databases of standardized genetic measures becomes more widespread. Thus, although hypervariable mtVNTRs may allow a rapid, cost-effective and extremely sensitive method to assay population substructure, caution should be employed until the investigator can verify that the level of variability detected is truly representative of that contained within the study organisms. In conclusion, mtVNTRs may prove a very useful technique to rapidly judge initial diversity levels within species and between closely related taxa. After consideration of the errors intrinsic to the process and in the analysis of data it is apparent that we need to know very much © 1998 Blackwell Science Ltd, Molecular Ecology, 7, 1441Ð1455
M I T O C H O N D R I A L D N A VA R I A B L E N U M B E R TA N D E M R E P E AT S more about the variability of such loci before they can truly be used as both robust and sensitive estimators of genetic subdivision in molecular ecology, and until that time we urge caution.
Acknowledgements We would like to thank Laurent Excoffier and three anonymous referees for constructive advice on the manuscript. This work was funded by a USDA grant to B.C.H.
References çrnason E, Rand DM (1992) Heteroplasmy of short tandem repeats in mitochondrial DNA of Atlantic cod, Gadus morhua. Genetics, 132, 211Ð220. Avise JC (1994) Molecular Markers, Natural History and Evolution. Chapman & Hall, New York. Barnes WM (1994) PCR amplification of up to 35-kb DNA with high fidelity and high yield from lambda bacteriophage templates. Proceedings of the National Academy of Sciences, USA, 91, 2216Ð2220. Berg T, Moum T, Johansen S (1995) Variable numbers of simple tandem repeats make birds of the order Ciconiiformes heteroplasmic in their mitochondrial genomes. Current Genetics, 27, 257Ð 262. Birky CW, Fuerst P, Maruyama T (1989) Organelle gene diversity under migration, mutation and drift: equilibrium expectations, approach to equilibrium, effects of heteroplasmic cells and comparison to nuclear genes. Genetics, 121, 613Ð627. Birky CW, Maruyama T, Fuerst P (1983) An approach to population and evolutionary genetic theory for genes in mitochondria and chloroplasts, and some results. Genetics, 103, 513Ð526. Broughton RE, Dowling TE (1994) Length variation in mitochondrial DNA of the minnow Cyprinella spiloptera. Genetics, 138, 179Ð 190. Brown JR, Beckenbach AT, Smith MJ (1992) Mitochondrial DNA length variation and heteroplasmy in populations of the white sturgeon (Acipenser transmontanus). Genetics, 132, 221Ð 228. Brown WM, George M, Wilson AC (1979) Rapid evolution of animal mitochondrial DNA. Proceedings of the National Academy of Sciences, USA, 76, 1967Ð1971. Buroker NE, Brown JR, Gilbert TA et al. (1990) Length heteroplasmy of sturgeon mitochondrial DNA: an illegitimate elongation model. Genetics, 124, 157Ð163. Callen DF, Thompson AD, Shen Y et al. (1993) Incidence and origin of ÔnullÕ alleles in the (AC)n microsatellite markers. American Journal of Human Genetics, 52, 922Ð927. Casane D, Dennebouy N, de Rochambeau H, Mounolou JC, Monneret M (1994) Genetic analysis of systematic mitochondrial heteroplasmy in rabbits. Genetics, 138, 471Ð480. Casane D, Dennebouy N, de Rochambeau H, Mounolou JC, Monnerot M (1997) Nonneutral evolution of tandem repeats in the mitochondrial DNA control region of lagomorphs. Molecular Biology and Evolution, 14, 779Ð789. Cesaroni D, Venanzetti F, Allegrucci G, Sbordoni V (1997) Mitochondrial length variation and heteroplasmy in natural populations of the European sea bass, Dicentrarchus labrax. Molecular Biology and Evolution, 14, 560Ð568. © 1998 Blackwell Science Ltd, Molecular Ecology, 7, 1441Ð1455
1453
Clayton DA (1992) Transcription and replication of animal mitochondrial DNAs. International Review of Cytology, 141, 217Ð232. Cornuet J-M, Garnery L, Solignac M (1991) Putative origin and function of the intergenic region between COI and COII of Apis mellifera L. mitochondrial DNA. Genetics, 1128, 393-403. Dejardins P, Morais R (1990) Sequence and gene organization of the chicken mitochondrial genome. Journal of Molecular Biology, 212, 599Ð 634. Diaco R (1995) Practical considerations for the design of quantitative PCR assays. In: PCR Strategies (eds Innis MA, Gelfand DH, Sninsky JJ), pp. 84Ð108. Academic Press, San Diego. Di Rienzo A, Peterson AC, Garza JC et al. (1994) Mutational processes of simple sequence repeat loci in human populations. Proceedings of the National Academy of Sciences, USA, 91, 3166Ð3170. Dufresne C, Mignotte F, Gueride M (1996) The presence of tandem repeats and the initiation of replication in rabbit mitochondrial DNA. European Journal of Biochemistry, 235, 593Ð 600. Estoup A, Garnery L, Solignac M, Cornuet J-M (1995) Microsatellite variation in honey bee (Apis mellifera L.) populations: hierarchical genetic structure and test of the Infinite Allele and Stepwise Mutation Models. Genetics, 140, 679Ð695. Flook PK, Rowell CHF, Gellissen G (1995) The sequence, organization, and evolution of the Locusta migratoria mitochondrial genome. Journal of Molecular Evolution, 41, 928Ð 941. Fumagalli L, Taberlet P, Favre L, Hausser J (1996) Origin and evolution of homologous repeated sequences in the mitochondrial DNA control region of shrews. Molecular Biology and Evolution, 13, 31Ð 46. Garza JC, Slatkin M, Freimer NB (1995) Microsatellite allele frequencies in humans and chimpanzees, with implications for constraints on allele size. Molecular Biology and Evolution, 12, 594Ð603. Ghivizzani SC, Mackay SLD, Madsen CS et al. (1993) Transcribed heteroplasmic repeated sequences in the porcine mitochondrial DNA D-loop region. Journal of Molecular Evolution, 37, 36Ð 47. Harrison RG (1989) Animal mtDNA as a genetic marker in population and evolutionary biology. Trends in Ecology and Evolution, 4, 6Ð11. Hayasaka K, Ishida T, Horai S (1991) Heteroplasmy and polymorphism in the major noncoding region of mitochondrial DNA in Japanese monkeys, associated with tandemly repeated sequences. Molecular Biology and Evolution, 8, 399Ð415. Hoelzel AR, Lopez JV, Dover GA, OÕBrien SJ (1995) Rapid evolution of a heteroplasmic repetitive sequence in the mitochondrial DNA control region of carnivores. Journal of Molecular Evolution, 39, 191Ð199. Hugall A, Moritz C, Stanton J, Wolstenholme DR (1994) Low, but strongly structured mitochondrial DNA diversity in root knot nematodes (Meloidogyne). Genetics, 136, 903Ð912. Hyman BC, Whipple LE (1996) Application of mitochondrial DNA polymorphism to Meloidogyne molecular population biology. Journal of Nematology, 20, 268Ð276. Jarne P, Lagoda PJL (1996) Microsatellites, from molecules to populations and back. Trends in Ecology and Evolution, 11, 424Ð429. Jeffreys AJ, Wilson V, Neumann R, Keyte J (1988) Amplification of human minisatellites by the polymerase chain reaction:
1454
D . H . L U N T, L . E . W H I P P L E A N D B . C . H Y M A N
towards DNA fingerprinting of single cells. Nucleic Acids Research, 16, 10953Ð10971. Jenuth JP, Peterson ACS, Houbridge EA (1997) Tissue-specific selection for different mtDNA genotypes in heteroplasmic mice. Nature Genetics, 16, 93Ð95. Jurka J, Pethiyagoda C (1995) Simple repetitive sequences from primates: compilation and analysis. Journal of Molecular Evolution, 40, 120Ð126. Kimura M, Crow JF (1964) The number of alleles that can be maintained in a finite population. Genetics, 49, 725Ð738. Koehler TH (1995) General aspects and chances of nucleic acid quantitation by PCR. In: Quantitation of mRNA by Polymerase Chain Reaction (eds Koehler TH et al.), pp. 3Ð14. Springer, Berlin. Koehler CM, Lindberg GL, Brown DR et al. (1991) Replacement of bovine mitochondrial DNA by a sequence variant within one generation. Genetics, 129, 247Ð255. Kondo R, Horai S, Satta Y, Takahata N (1993) Evolution of hominoid mitochondrial DNA with special reference to the silent substitution rate over the genome. Journal of Molecular Evolution, 36, 517Ð531. Landre PA, Gelfand DH, Watson RM (1995) The use of cosolvents to enhance amplification by the polymerase chain reaction. In: PCR Strategies (eds Innis MA, Gelfand DH, Sninsky JJ), pp. 3Ð16. Academic Press, San Diego. Lee W-J, Conroy J, Howell WH, Kocher TD (1995) Structure and evolution of teleost mitochondrial control regions. Journal of Molecular Evolution, 41, 54Ð 66. Levinson G, Gutman GA (1987) Slipped-strand mispairing: a major mechanism for DNA sequence evolution. Molecular Biology and Evolution, 43, 203Ð221. Lewis DL, Farr CL, Farquhar AL, Kaguni LS (1994) Sequence, organization, and evolution of the A+T-rich region of Drosophila melanogaster mitochondrial DNA. Molecular Biology and Evolution, 11, 523Ð 538. Lopez JV, Ceverio S, O-Brien SJ (1996) Complete nucleotide sequence of the domestic cat (Felis catus) mitochondrial genome and the transposed mtDNA tandem repeats (Numt) in the nuclear genome. Genomics, 33, 229Ð 246. Lunt DH, Hyman BC (1997) Animal mitochondrial DNA recombination. Nature, 387, 247. Macey JR, Larson A, Anajeva NB, Fang Z, Papenfuss TJ (1997) Two novel gene orders and the role of light-strand replication in rearrangement of the vertebrate mitochondrial genome. Molecular Biology and Evolution, 14, 91Ð 104. Mignotte F, Gueride M, Champagne A-M, Mounolou J-C (1990) Direct repeats in the non-coding region of rabbit mitochondrial DNA: involvement in the generation of intra- and interindividual heterogeneity. European Journal of Biochemistry, 194, 561Ð 571. Miracle AL, Campton DE (1995) Tandem repeat sequence variation and length heteroplasmy in the mitochondrial DNA Dloop of the threatened gulf of Mexico sturgeon, Acipenser oxyrhynchus desotoi. Journal of Heredity, 86, 22Ð27. Monteforte A, Barrio E, Latorre A (1993) Characterization of the length polymorphism in the A+T-rich region of the Drosophila obscura group species. Journal of Molecular Evolution, 36, 214Ð 223. Mundy NI, Winchell CS, Woodruff DS (1996) Tandem repeats and heteroplasmy in the mitochondrial DNA control region of the loggerhead shrike (Lanius ludovicianus). Heredity, 87, 21Ð26.
Ohta T, Kimura M (1973) A model of mutation appropriate to estimate the number of electrophoretically detectable alleles in a finite population. Genetical Research, 22, 201Ð204. Okimoto R, Chamberlin HM, Mcfarlane JL, Wolstenholme DR (1991) Repeated sequence sets in mitochondrial DNA molecules of root knot nematodes (Meloidogyne): nucleotide sequences, genome location and potential for host-race identification. Nucleic Acids Research, 19, 1619Ð1626. Okimoto R, Macfarlane JL, Clary DO, Wolstenholme DR (1992) The mitochondrial genomes of two nematodes, Caenorhabditis elegans and Ascaris suum Genetics, 130, 471Ð498. Parsons TJ, Muniec DS, Sullivan K et al. (1997) A high observed substitution rate in the human mitochondrial DNA control region. Nature Genetics, 15, 363Ð368. Rand DM (1993) Endotherms, ectotherms, and mitochondrial genome-size variation. Journal of Molecular Evolution, 37, 281Ð295. Rand DM (1994) Concerted evolution and RAPping in mitochondrial VNTRs and the molecular geography of cricket populations. In: Molecular Ecology and Evolution: Approaches and Applications (eds Schierwater B, Streit B, Wagner GP, DeSalle R), pp. 227Ð245. BirkhŠuser, Basel, Switzerland. Rand DM, Harrison RG (1986) Mitochondrial DNA transmission genetics in crickets. Genetics, 114, 955Ð970. Rand DM, Harrison RG (1989) Molecular population genetics of mtDNA size variation in crickets. Genetics, 121, 551Ð569. Sambrook J, Fritsch EF, Maniatis T (1989) Molecular Cloning: a Laboratory Manual. Cold Spring Harbor Press, New York. Sokal RR, Rolf FJ (1987) Introduction to Biostatistics. W.H. Freeman, New York. Stewart DT, Baker AJ (1994) Patterns of sequence variation in the mitochondrial D-loop region of shrews. Molecular Biology and Evolution, 11, 9Ð 21. Trinh TQ, Sinden RR (1993) The influence of primary and secondary DNA structure in deletion and duplication between direct repeats of Escherichia coli. Genetics, 134, 409Ð422. Turner TF (1997) Mitochondrial control region sequences and phylogenetic systematics of darters (Teleostei: Percidae). Copeia, 1997, 319Ð 338. Wallace DC (1994) Mitochondrial DNA sequence variation in human evolution and disease. Proceedings of the National Academy of Sciences, USA, 91, 8739Ð8746. Wenink PW, Baker AJ, Tilanus MGD (1994) Mitochondrial control-region sequences in two shorebird species, the Turnstone and the Dunlin, and their utility in population genetic studies. Molecular Biology and Evolution, 11, 22Ð31. Whipple LE (1997) Mitochondrial DNA length diversity among Meloidogyne isolates of established genetic relationships. MSc Thesis, University of California, Riverside, USA. Whipple LE, Lunt DH, Hyman BC (1998) Mitochondrial DNA length variation in Meloidogyne incognita isolates of established genetic relationships: utility for nematode population studies. Fundamental and Applied Nematology, 21, 265Ð271. Wierdl M, Dominska M, Petes TD (1997) Microsatellite instability in yeast: dependence on the length of the microsatellite. Genetics, 146, 769Ð779. Wilkinson GS, Chapman AM (1991) Length and sequence variation in evening bat D-loop mtDNA. Genetics, 128, 607Ð617. Wilkinson GS, Mayer F, Kerth G, Petri B (1997) Evolution of repeated sequence arrays in the D-loop region of bat mitochondrial DNA. Genetics, 146, 1035Ð1048. © 1998 Blackwell Science Ltd, Molecular Ecology, 7, 1441Ð1455
M I T O C H O N D R I A L D N A VA R I A B L E N U M B E R TA N D E M R E P E AT S Wong JFH, Ma DP, Wilson RK, Roe BA (1983) DNA sequence of the Xenopus laevis mitochondrial heavy and light strand replication origins and flanking tRNA genes. Nucleic Acids Research, 11, 4977Ð 4995. Xu X, çrnason U (1994) The complete mitochondrial DNA sequence of the horse, Equus caballus: extensive heteroplasmy of the control region. Gene, 148, 357Ð362. Xu X, çrnason U (1997) The complete mitochondrial DNA sequence of the white rhinoceros, Ceratotherium simum, and comparison with the mtDNA sequence of the Indian rhinoceros, Rhinoceros unicornis. Molecular Phylogenetics and Evolution, 7, 189Ð194. Xu X, Gullberg A, çrnason U (1996) The complete mitochondrial DNA (mtDNA) of the donkey and mtDNA comparisons among four closely related mammalian species pairs. Journal of Molecular Evolution, 43, 438Ð 446. Yang Y-J, Lin Y-S, Wu J-L, Hui C-F (1994) Variation in mitochondrial DNA and populaton structure of the Taipei treefrog Rhacophorus taipeainus in Taiwan. Molecular Ecology, 3, 219Ð 228. Yonema Y (1987) The nucleotide sequence of the heavy and light strand replication origins of the Rana catesbeiana mitochondrial genome. Journal of the Nippon Medical School, 54, 429Ð 440.
© 1998 Blackwell Science Ltd, Molecular Ecology, 7, 1441Ð1455
1455
Zardoya R, Meyer A (1996) The complete nucleotide sequence of the mitochondrial genome of lungfish (Protopterus dolloi) supports its phylogenetic position as a close relative of land vertebrates. Genetics, 142, 1249Ð 1263. Zardoya R, Villalta M, Lopez-Perez MJ, Garrido-Pertierra A, Montoya J (1995) Nucleotide sequence of the sheep mitochondrial D-loop and its flanking tRNA genes. Current Genetics, 28, 94Ð 96. Zhang D-X, Szymura JM, Hewitt GM (1995) Evolution of structural conservation of the control region of insect mitochondrial DNA. Journal of Molecular Evolution, 40, 382Ð 391.
This work was carried out in the laboratory of Bradley Hyman at the University of California, Riverside. Group interests focus on understanding the molecular basis of structural diversity and genetic organization exhibited by animal mitochondrial DNA, and in applying molecular approaches to nematode population structure. Data was collected as part of David LuntÕs postdoctoral studies and Lawrence WhippleÕs MSc Thesis. D.H.L. is now a lecturer in molecular ecology at the University of Hull, UK.