NeuroImage 17, 1227–1239 (2002) doi:10.1006/nimg.2002.1246
Multidimensional Scaling of Integrated Neurocognitive Function and Schizophrenia as a Disconnexion Disorder D. E. Welchew,* G. D. Honey,* ,† T. Sharma,† T. W. Robbins,‡ and E. T. Bullmore* ,† ,1 *Department of Psychiatry, University of Cambridge, Cambridge, United Kingdom; †Institute of Psychiatry, King’s College London, London, United Kingdom; and ‡Department of Experimental Psychology, University of Cambridge, Cambridge, United Kingdom Received December 14, 2001
INTRODUCTION Multidimensional scaling (MDS) is a multivariate statistical technique that can be used to define subsystems of functionally connected brain regions based on the analysis of functional magnetic resonance imaging (fMRI) data. Here we introduce three-way multidimensional scaling as a method for the analysis of a group of fMRI data, which yields both a generic interregional configuration in low-dimensional space and a measure of each individual’s deviation from the generic configuration. The distance between two generic interregional configurations obtained by MDS of two groups of data can be minimized by generalized Procrustes analysis, and the probability under the null hypothesis (that the two groups are sampled from the same population) of any residual group difference in interregional configurations can be assessed by a permutation test. These methods are developed and applied to activated fMRI time series acquired from 19 patients with schizophrenia and 20 normal comparison subjects during the performance of a semantic categorization and subvocal rehearsal task. The first three scaling dimensions are interpretable in terms of the major anatomical or functional subsystems of the activated system: “left–right,” “input processing– other,” and “subvocal output– other”. We found no significant global or local differences between groups in interregional configurations in this 3D space. However, there was significantly greater variability of interregional configurations within the group of patients with schizophrenia. The implications for schizophrenia as a disconnexion disorder are discussed. © 2002 Elsevier Science (USA) Key Words: dysconnectivity; psychosis; MRI; distance; nonparametric inference.
1 To whom correspondence should be addressed at the University of Cambridge, Department of Psychiatry, Brain Mapping Unit, Addenbrooke’s Hospital, Cambridge CB2 2QQ, UK. Fax: ⫹44(0)1223 336581. E-mail:
[email protected]. URL: http://www.psychiatry.cam. ac.uk/bmu.
Functional magnetic resonance imaging (fMRI) has been widely used to elucidate the understanding of segregated or regionally specialized brain function. To do this, fMRI time series data are usually modeled and tested in a univariate mode of analysis, treating each voxel as a discrete observation. Functional MRI can also be used to understand integrated or regionally distributed brain functions; in which case multivariate modes of data analysis are required to characterize associations or dependencies between multiple voxels or regions-of-interest. In the simplest (bivariate) case, the observation of correlation between the time series for two regions can be used to infer that the regions are functionally connected (Friston, 1994), i.e., they may have functional effects on each other and/or share a common input. More sophisticated multivariate methods previously applied to fMRI data analysis include primarily graphic or exploratory techniques, such as principal components analysis (PCA), which can be useful for summarizing a complex set of interregional relationships in terms of a few principal components or major dimensions of variance (Bullmore et al., 1996). The first few principal components define the (mutually orthogonal) temporal patterns of activity that account for the largest proportions of total variance– covariance in the system. A plot of regions in the space of the first few PCs can then be used to define functional subsystems or groups of regions in close proximity in functional space which share important temporal patterns of activity. It may be possible post hoc to relate the configuration of regions in the space of the first few PCs to prior knowledge of their anatomical or physiological properties. Other exploratory techniques include minimum spanning trees (Baumgartner et al., 2001) and cluster analysis. In a more inferential vein, canonical discriminant analysis (Bullmore et al., 1996; Worsley et al., 1997) has been used to identify functions that optimally discriminate the regions comprising a functional connectivity or correlation matrix, and partial least
1227 ©
1053-8119/02 $35.00 2002 Elsevier Science (USA) All rights reserved.
1228
WELCHEW ET AL.
squares has been combined with a permutation test to assign a probability under the null hypothesis to an observed association between distributed brain activation and experimental or other exogenous variables (McIntosh et al., 1996). Path analysis or structural equation modeling has also been used to fit causal or directional models of interregional association to correlation or covariance matrices and to test the null hypothesis that the path models fitted to two correlation matrices acquired from different groups or under different experimental conditions are the same (McIntosh et al., 1994; Bullmore et al., 2000). Here we consider some multivariate techniques for the analysis of integrated brain function that are based on classical multidimensional scaling (MDS), as originally developed by Torgerson (1952). In its simplest form, classical MDS is equivalent to principal components analysis, hence its alternative name of principal coordinates analysis (Friston et al., 1996). In this paper, we are mainly concerned with two extensions of this basic technique. First, we introduce the method of three-way multidimensional scaling for analysis of integrated brain function based on a group of functional magnetic resonance (MR) images. In three-way MDS, a set of m interregional distance matrices, each estimated for an individual fMRI dataset, may be analyzed simultaneously to yield both a generic MDS solution and a measure of each individual’s deviation from the interregional configuration characteristic of the group. Second, we develop and apply a permutation test based on Procrustes analysis to assign a probability to observations on two groups of interregional distance matrices under the null hypothesis that the two groups in question were sampled from the same population. Generalized Procrustes analysis (GPA) is a technique by which two configurations of n equivalent points in p dimensions are translated, rotated, and scaled to minimize the sum of squared distances between them [see Bookstein (1998) for prior applications of Procrustes analysis to the morphometric characterization of anatomical images]. This is particularly appropriate for the configurations obtained by MDS of two different groups of data, as these results may share an underlying structure that is arbitrarily different in terms of its scaling and axial rotation. Procrustes analysis minimizes these spurious differences between two generic configurations and allows the residual difference between them to be estimated. A permutation test, randomly reassigning each individual to one of two groups prior to three-way MDS and GPA, is designed to test the probability of the observed interconfigurational difference under the null hypothesis. We suggest that these techniques may be of particular relevance to the investigation of patterns of functional connectivity in patients with psychiatric or cognitive disorders. For example, in patients with
schizophrenia there is some evidence both for generically abnormal patterns of structural and functional interregional connectivity and for abnormal variability of time series activity at a univariate level (Holt et al., 1999). The possibility of increased variability or heterogeneity of interregional correlations in patients with schizophrenia has not previously been investigated directly but seems likely a priori. We have therefore illustrated the methodological issues by the analysis of two groups of functional MRI data acquired from 19 patients with schizophrenia and 20 comparison subjects. METHODS Sample Nineteen right-handed male patients (mean age ⫽ 36.8 years, standard deviation (SD) ⫽ 9 years) with an operationalized diagnosis of chronic schizophrenia (DSM-IV, 1987) were recruited from the Bethlem Royal and Maudsley NHS Trust, London, UK. The patients were chronically medicated with typical antipsychotic drugs (mean duration of illness ⫽ 13.9 years, SD ⫽ 8.6 years) and had well-controlled psychotic symptoms at the time of scanning (mean score on the positive subscale of the Positive and Negative Syndrome Scale (PANSS) (Kay et al., 1987) ⫽ 11.2, SD ⫽ 6.0; mean negative subscale score ⫽ 14.5, SD ⫽ 6.8; mean general psychopathology subscale score ⫽ 25.8, SD ⫽ 10.1). Twenty right-handed, psychiatrically and neurologically normal volunteers (10 male, 10 female; mean age ⫽ 44.4 years, SD ⫽ 14.7) were also recruited from within the local community by advertisement. There was no significant age difference between the groups. All subjects gave informed consent in writing. The study was approved by the local research ethics committee. Experimental Design We used a blocked periodic AB design to activate brain systems for semantic decision and subvocal articulation, as previously described (Bullmore et al, 2000). During the activation condition, the subject was cued every 2.5 s by the visual presentation of a word, e.g., “goat,” and was required to decide whether the word represented a living or nonliving entity and to internally rehearse or subvocally articulate that decision. All words were in the high-frequency range and between three and seven letters in length. During the baseline (B) condition, the subject was asked simply to fixate on an isoluminant screen. Five cycles of alternation between 30 s epochs were presented in the course of each 5-min experiment; the B condition was always presented first.
1229
MULTIDIMENSIONAL SCALING OF INTEGRATED NEUROCOGNITIVE FUNCTION
TABLE 1 Euclidean Distance Matrix across All 39 Subjects Euclidean distance LVEC LVEC LSTG LPFC LSMA LIFG LIPL RVEC RSTG RPFC RSMA RIPL
350.41 417.37 407.10 478.14 407.20 420.74 399.72 422.74 438.03 436.57
LSTG
LPFC
LSMA
LIFG
LIPL
RVEC
RSTG
RPFC
RSMA
RIPL
350.41
417.37 351.39
407.10 361.88 355.70
478.14 445.96 437.18 427.57
407.20 380.84 394.52 378.20 436.13
420.74 403.64 414.55 407.60 475.18 389.83
399.72 347.93 370.56 361.19 439.40 368.36 354.43
422.74 389.01 389.27 390.31 474.69 410.47 423.91 364.45
438.03 399.48 416.81 353.73 463.79 412.66 436.85 405.20 383.85
436.57 394.37 415.11 404.98 483.12 398.39 417.95 368.86 402.91 425.48
351.39 361.88 445.96 380.84 403.64 347.93 389.01 399.48 394.37
355.70 437.18 394.52 414.55 370.56 389.27 416.81 415.11
427.57 378.20 407.60 361.19 390.31 353.73 404.98
436.13 475.18 439.40 474.69 463.79 483.12
fMRI Data Acquisition Gradient-echo echo-planar T2*-weighted images depicting blood oxygen level-dependent contrast were acquired using a 1.5T GE Signa system (General Electric, Milwaukee, WI) with the following parameters: number of slices, 14; slice thickness, 7 mm; interslice gap, 0.7 mm; inplane resolution, 3 mm; TE, 40 ms; TR, 3000 ms; flip angle, 90°; number of signal averages, 1. Activation Mapping and Regional fMRI Time Series Extraction After the correction of temporal offsets due to multislice acquisition and head movement-related effects in the fMRI time series at each voxel (Bullmore et al., 1999), a linear regression model was fitted by least squares to estimate experimentally induced signal changes in the context of residual autocorrelation with fractal or long-memory structure (Bullmore et al., 2001a). This yielded maps of the amplitude of response to the activation condition at each voxel, which were coregistered by an affine transformation in standard space (Talairach and Tournoux, 1988). In a random effects analysis robust to modest group size, the median amplitude of activation over all subjects in each group was tested against its null distribution by a permutation test (Brammer et al., 1997) to construct a generic brain activation map for each group of subjects. The motion-corrected fMRI time series volume for each subject was also registered in standard space and a set of 11 regional time series was recovered in each subject (see Fig. 1). Each regional time series was the average of the time series at the voxel indexed by regional coordinates in standard space and its eight nearest neighbors in 2D (total regional volume ⫽ 0.57 cm 3) and was translated to give a mean signal of zero. Two-Way Multidimensional Scaling A single proximity matrix is used for two-way MDS. To construct a single matrix based on a group of fMRI
389.83 368.36 410.47 412.66 398.39
354.43 423.91 436.85 417.95
364.45 405.20 368.86
383.85 402.91
425.48
data, one can simply concatenate the individual time series for each region and then estimate the interregional distances between concatenated series. We did this using all the data from both groups to produce the single distance matrix shown in Table 1 and also using all the data from each group separately to produce a single proximity matrix for each group. In all cases, we used the Euclidean distance between N timepoints measured at two regions i and j as our measure of interregional distance:
冑冘 N
d i, j ⫽
共i t ⫺ j t兲 2 .
(1)
t⫽1
From a set of N timepoints measured at p regions, a symmetrical (p ⫻ p) distance matrix D is estimated which summarizes the distance d i, j between each pair of regions i and j. Multidimensional scaling of this matrix locates the variables in an r-dimensional subspace such that the distances between variables in the reduced space ␦ i, j is as close as possible to their original distances, i.e., the stress measure V⫽
冘 冘 共d i
j
2 i, j
⫺ ␦ i,2 j兲
(2)
is a minimum (Krzanowski, 1988; Everitt and RabeHesketh, 1997). Iterative minimization of V is constrained by the choice of the number of dimensions r in the reduced space. The maximum number of possible dimensions for MDS is dictated by the number of regions p included in the analysis; in this study p ⫽ 11 and therefore the maximum r ⫽ 5. This is because we have only (p 2 ⫺ p)/2 unique interregional distances on the basis of which to estimate pr weightings of each of p regions on each of r dimensions. With p ⫽ 11, the number of
1230
WELCHEW ET AL.
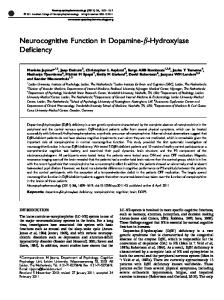
FIG. 1. Generic brain activation maps for 39 subjects performing a semantic categorization and subvocal rehearsal task. Colored voxels are activated with one-tailed voxelwise P ⬍ 0.0001; at this size of test we expect less than one false-positive test over the whole map. The cross hairs locate the origin of the x and y coordinates of the Talairach space in the plane of each slice; the z coordinate in millimeters above or below the intercommissural line is shown for each slice. Functional MRI time series were recovered from each individual dataset in the regions indicated by the green squares: left and right ventral extrastriate cortex (L/RVEC; Talairach {x, y, z} coordinates (mm) ⫺40 and ⫹40, ⫺65, ⫺5; left inferior frontal gyrus (LIFG; ⫺48 and ⫹48, ⫹7, ⫹10); left and right dorsal prefrontal cortex (L/RPFC; ⫺40 and ⫹40, ⫹5, ⫹35); left and right inferior parietal lobule (L/RIPL; ⫺33 and ⫹33, ⫺50, ⫹43); left and right superior temporal gyrus (L/RSTG ⫺56 and ⫹56, ⫺36, 10) and medial premotor cortex (SMA; ⫺3 and ⫹3, ⫺5, ⫹54).
interregional distances available for MDS is 55; therefore, the maximum number of dimensions is 5. Given this constraint, the choice of r is guided by the inspection of curves describing the monotonic reduction in stress V (Eq.2) with increasing r (see Fig. 2). Higher dimensional solutions inevitably reduce the stress but are also more difficult to represent and perhaps to interpret. If the stress curve is nonlinear (as in Fig. 2), this may suggest that the best trade-off between stress reduction and parsimony of the solution is obtained by including only those first few dimensions which are associated with disproportionately large decrements in stress. Three-Way Multidimensional Scaling and Weirdness
FIG. 2. Stress curves for the two groups; patients, solid line, circular points; comparison subjects, broken line, square points. The curvilinear graphs demonstrate a monotonic decrease in the stress of scaling solutions as the dimensionality is increased from 1 through 5. By inspection, a reasonable choice for dimensionality of MDS is r ⫽ 2 or 3; incorporation of higher dimensions is associated only with linear decrements in stress.
A set of m proximity matrices is used for three-way MDS, one for each individual in each group. A lowdimensional solution is found iteratively to minimize “S-Stress,” a modification of the stress measure defined in Eq. 2 to use squared distances [this modification was introduced by Takane et al. (1977) to allow both metric and nonmetric data to be analyzed with this technique]. As in two-way MDS, the number of dimensions for the reduced space is decided by the examination of cumulative reductions in stress with increasing dimensionality. The outputs of the analysis include both a generic interregional configuration and the deviation of each individual from the
MULTIDIMENSIONAL SCALING OF INTEGRATED NEUROCOGNITIVE FUNCTION
1231
(stretching) of the generic solution that produces the best fit to that individual matrix. The distribution of these weights reflects the variability of individual
FIG. 3. Multidimensional scaling solution for all subjects (N ⫽ 39) in two dimensions. The coordinates of 11 brain regions are plotted in the space of two dimensions which have been labelled left/right and frontal/posterior on the grounds that the regions are clearly cosegregated in the four quadrants of the plot according to these anatomical characteristics. FIG. 4. Multidimensional scaling solution for all subjects (N ⫽ 39) in three dimensions. Each panel shows a scatterplot of the 11 brain regions in the space of two of the dimensions. Top left, dimension 1 (input processing/other) versus dimension 2 (left/right); top right, dimension 1 (Input processing/other) versus dimension 3 (subvocal output/other); bottom right, dimension 2 versus dimension 3. The regional abbreviations are left/right prefrontal cortex (L/RPFC), left/right superior temporal gyrus (L/RSTG), left/right ventral extrastriate cortex (L/RVEC), left/right inferior parietal lobule (L/RIPL), left/right supplementary motor area (L/RSMA), and left inferior frontal gyrus (LIFG).
generic configuration. Specifically, each contributing matrix is given a weight for each dimension in the generic solution, representing the transformation
FIG. 5. Multidimensional scaling solutions separately estimated in three dimensions for (a) the comparison subjects (N ⫽ 20) and (b) the patients with schizophrenia (N ⫽ 19). As in Fig. 3, each panel shows a scatterplot of the 11 brain regions in the space of two of the three dimensions: top left, dimensions 1 versus 2; top right, dimensions 1 versus 3; bottom right, dimensions 2 versus 3. The same three dimensions are identified in both groups separately as in the combined data—left/right, input processing/other, and subvocal output/other—although the rank order of these dimensions differs between groups. The arrows are used simply to distinguish regions lying in close proximity to each other.
1232
WELCHEW ET AL.
proximity matrices within the group and can be summarized in terms of the “weirdness” w k of the kth subject (Takane et al., 1977):
冢 冑冘 冉 冊 冣 冘 wT r
cos ⫺1
d⫽1
r
k ⫽
d,k
w d,k
d⫽1
cos
d
⫺1
Td 1
2
䡠 r
.
(3)
冑r
Here, w d,k denotes the weighting of the kth of m subjects on the dth of r dimensions and Td ⫽ ¥ km⫽ 1w d,k is the sum of weights on the dth dimension over all m subjects in the group. The possible values of weirdness range from zero (when a subject has weights in proportion to the group mean weights) to one (if a subject has nonzero weights on only a single dimension). Within each group of subjects, a high mean weirdness therefore indicates a high degree of variability of individual interregional configurations relative to the generic configuration, or a high degree of within-group heterogeneity in terms of integrated neurocognitive function. Three-way MDS solutions were estimated for subjects in both groups based on the estimated common space for all subjects. The null hypothesis of zero between-group differences in mean weirdness was tested against the t distribution. Generalized Procrustes Analysis To compare the generic configurations obtained for each group, whether by two-way or three-way MDS, generalized Procrustes analysis was used to transform one solution onto the other. GPA takes two configurations of the same set of points in an r-dimensional space and finds the translation, rotation, and scaling necessary to minimize the sum of squared distances between corresponding points in each dimension. This allows the comparison of generic MDS solutions even if two dimensions are reversed, if one is a reflection of another, or if they have different scales—features that have negligible effect on the interpretation as long as the dimensions themselves are similar. More formally, Procrustes analysis takes two matrices representing configurations of the same object points, X(N, r x) and Y(N, r y), such that n is the number of points and r x and r y are the dimensionalities of each configuration; without loss of generality, we assume r x ⫽ r y ⫽ r (if r x ⫽ r y, the smaller matrix can be padded with columns of zeroes until r x ⫽ r y). The [i, d]th element of each matrix denotes the coordinates of the ith point (region) on the dth dimension. Each matrix is
first translated so that its centroid is at the origin by subtraction of group mean coordinates on each dimension from the coordinates on corresponding dimensions of each point. Each mean-centred matrix is then standardized so that it has unit total squared distance from its centroid, ensuring that the rotation of Y onto X is equivalent to the rotation of X onto Y. Then one matrix is rotated and dilated such that the residual discrepancy between the two matrices is minimized: we will assume that X is the “base” matrix and Y is the “match” matrix which is to be rotated and dilated to correspond to it as closely as possible. We then wish to find the orthogonal matrix Q which rotates Y so as to minimize the sum of the squared distances between the corresponding points in X and Y:
冘关 冘共x n
M2 ⫽
p
i, j
⫺ y i, j兲 2兴
i⫽1 j⫽1
⫽ trace关共X ⫺ Y兲共X ⫺ Y兲 T兴
(4)
⫽ trace共XX T ⫹ YY T ⫺ 2XY T 兲 . If we denote the rotation of Y by YQ and substitute this into Eq. 4, it is clear that the orthogonal matrix Q which minimizes M 2 will maximize trace(2XQ TY T). It can be shown (Krzanowski, 1988) that this matrix is defined by Q ⫽ VU T, where V and U are products of the singular value decomposition (SVD) of XY T ⫽ ULV T. The last step is to dilate the configuration of points in the rotated match matrix YQ such that its points are on the same scale as X. We can denote this dilation cYQ, where c is a scalar the optimum value of which is defined by trace(L)/trace(YY T). The minimum value of M 2, denoted m 2, can therefore be written down in terms of X, Y and the products of the SVD of XY T as m 2 ⫽ c 2trace共YY T兲 ⫺ 2c 䡠 trace共XQ TY T兲 ⫹ trace共XX T兲 ;
(5)
i.e., this statistic summarizes any difference remaining between configurations X and Y after translation, rotation, and dilation. Permutation Testing of between-Group Difference in Interregional Configuration Permutation tests are particularly useful when one wishes to assess the probability under the null hypothesis of some test statistic for which a distributional approximation by asymptotic theory may not be appropriate or available (Edgington, 1995; Good, 1994; Bullmore et al., 2001b; Nicholls and Holmes, 2002). Here we wished to test the null hypothesis that the (minimal) difference remaining (after GPA) between two generic interregional MDS solutions was no more than might be expected under the null hypothesis that the
MULTIDIMENSIONAL SCALING OF INTEGRATED NEUROCOGNITIVE FUNCTION
two groups of data were sampled from the same population. We could find no well-established theoretical approximation to the null distribution of m 2, so we designed a permutation test. This involved randomly reassigning the observed data matrices on all 39 subjects to one of two groups of the same size as that of the observed groups. MDS was then separately applied to the resampled data in each group and GPA was used to minimize the discrepancy between generic interregional configurations, yielding an estimate of m 2 under the null hypothesis after each permutation. This process was repeated 1499 times to generate a permutation distribution comprising 1500 elements (including the estimate of m 2 in the observed data). The one-tailed probability P of the observed difference under the null hypothesis is then simply the number of elements in the permutation distribution which are larger than the observed value of m 2 divided by the total size of the permutation distribution (1500). A comparable procedure was used to assess betweengroup differences in integrated functional anatomy at a regional level. The between-group distance after GPA was separately estimated for each region in the observed data and after each permutation. This allowed us to test the set of null hypotheses that there was no between-group difference in the functional configuration of each brain region separately considered. All permutation tests were conducted using a threedimensional solution in both two-way and three-way MDS. The results were very similar for both two-way and three-way MDS and therefore only the two-way MDS results will be discussed in detail. Computational Aspects The INDSCAL algorithms implemented in ALSCAL, within Statistical Package for the Social Sciences (SPSS v.10.0.7; SPSS Inc., Chicago, IL), were used for two-and three-way MDS. For metric scaling, the iterative minimization routine in ALSCAL converges monotonically to a unique solution; there is no real risk of local minima. ALSCAL was called by scripts written in SPSS syntax. This allowed much easier batch manipulation of the resulting configurations. Iteration was terminated when the S-stress improvement was less than 10 ⫺5, the stress reached 0.0001 or better, or after 500 iterations. Generalized Procrustes analysis was done using ProTest (D. A. Jackson, University of Toronto, Toronto, Ontario, Canada). Weirdness was estimated by a C program written by D.E.W. based on the relevant routine within the ALSCAL package (Young, 1982). All operations were run on a ⫻86 personal computer under both Windows 2000 Professional and Debian Linux. Processing time was approximately 30 min per 1000 permutations, allowing large distributions to be generated for a relatively small computational overhead.
1233
RESULTS Generic Activation Mapping Slices from a generic brain activation map estimated on the basis of all 39 fMRI datasets are shown in Fig. 1. There is clearly distributed activation throughout a network including right (R) and left (L) ventral extrastriate cortex [VEC; approximate Brodmann areas (BA) 18 and 19], bilateral dorsal prefrontal cortex (PFC; BA 9), predominantly left-sided inferior frontal gyrus (IFG; BA 44), left-sided superior temporal gyrus (STG; BA 22), medial premotor cortex (BA 6) corresponding to supplementary motor area (SMA), and bilateral inferior parietal lobule (IPL; BA 7). Two-Way MDS The form of the stress curve is nearly identical in the two groups, suggesting that the same choice of r will be equally appropriate for both (Fig. 2). There are relatively major decremental reductions in stress as r is increased from 1 through 3; thereafter the curve is approximately linear. This suggests that a reasonable trade-off between stress reduction and parsimony would be achieved by choosing r ⫽ 2 or r ⫽ 3. The two-dimensional solution for all 39 subjects is summarized in Fig. 3. The axes and points are labeled in accordance with the following interpretation of the first two dimensions: dimension 1 is designated “left/ right” on the grounds that all left-sided regions have positive coordinates and all right-sided regions have negative coordinates; dimension 2 is designated “frontal/posterior” on the grounds that the occipital, temporal, and parietal regions tend to have negative coordinates, whereas the medial and lateral frontal regions have positive coordinates. Thus when r ⫽ 2 both dimensions can be interpreted simply in terms of the anatomical relations between regions. The three-dimensional solution for all 39 subjects is summarized in Fig. 4. The left–right dimension identified by the 2D solution is persistent in 3D, though it is now the second dimension rather than the first. However, the anatomical distinction between the frontal and posterior regions identified by the second dimension of the 2D solution has been replaced by two dimensions in which some frontal and posterior regions are cosegregated from other regions. We propose functional, rather than anatomical, interpretations for these dimensions. The first dimension is now designated “input processing/other” on the grounds that the left ventral occipital, superior temporal, and frontal regions implicated in word reading and semantic analysis have positive coordinates, whereas all other regions have negative coordinates. The third dimension is now designated “subvocal output/other” on the grounds that the medial premotor, left prefrontal, and inferior parietal regions implicated in subvocal re-
1234
WELCHEW ET AL.
subdivision of the activated system into subsystems specifically responsible for input processing and subvocal output generation and monitoring (Bullmore et al., 1996, 2000). The three-dimensional MDS solutions computed separately for each group are shown in Fig. 5. It is clear that the anatomical and functional subdivisions of the system identified by analysis of the combined data are
FIG. 6. Illustrations of Procrustes analysis. The top panel (a) shows scaling and translation of all 11 regions in the generic MDS solution for the patient group. The bottom panel (b) shows the rotation of regions in the patient configuration (red squares) to coincide as closely as possible with the position of corresponding regions in the control group configuration (black circles). Green circles denote the regional configuration of the patient group after Procrustean deformation and dashed lines between green circles and black circles indicate the distances remaining between the two configurations after deformation. Note that for reasons of graphic clarity only the rotation of a subset of regions is shown here and also that these results are represented in 2D, but generalized Procrustes analysis was actually applied to match two 3D configurations as closely as possible.
hearsal have negative coordinates, whereas other brain regions have positive coordinates. Interpretation of these dimensions in terms of the putative function of segregated subsystems is clearly less automatic than interpretation in terms of anatomical properties such as lateralization. However, as discussed in greater detail below, there is convergent evidence from prior multivariate analyses of other datasets acquired during the performance of this task for a major functional
FIG. 7. Permutation distribution for residual distance metric m 2 summarizing the difference between two generic 3D MDS solutions after generalized Procrustes analysis. The observed distance between control and patient group configurations was 0.183, which is ranked 331 of a total of 1500 values of m 2 obtained by random resampling of the data. The probability of the observed distance by a permutation test is therefore simply 1-(331/1500) ⫽ 0.744. FIG. 8. Permutation distributions for residual distances between each brain region in the two generic configurations after generalized Procrustes analysis. The observed distances are shown as black circles; the regional abbreviations are as listed in the legend to Fig. 3. The key point is that the observed interregional distance consistently lies within the 95% confidence interval of the mean interregional distance under the null hypothesis.
MULTIDIMENSIONAL SCALING OF INTEGRATED NEUROCOGNITIVE FUNCTION
reproduced within each group analyzed separately, although the relative ordering is somewhat different. In controls, the first dimension represents subvocal output/other, the second dimension represents input processing/other, and the third dimension represents left/ right. In patients, the first dimension represents input processing/other, the second dimension represents left/ right, and the third dimension represents subvocal output/other. Bearing in mind that the within-group analyses are necessarily based on numbers of subjects smaller than those of the combined-group analysis, it is possible that this apparent difference in rank order of the dimensions may simply reflect sampling variation under the null hypothesis. The hypothesis of zero between-group differences in interregional configurations following 3D MDS is tested more formally below. Three-Way MDS The dimensional structure of the generic solutions for each group separately, and for both groups combined, were estimated by three-way MDS very similar to the results already described by two-way MDS (data not shown). The subject weights for each individual on each dimension were estimated in relation to the generic configuration estimated using all data, and weirdness was estimated for each subject by Eq. 3. Mean weirdness in the group of comparison subjects was 0.184 (SD ⫽ 0.103) and 0.271 in the patient group (SD ⫽ 0.125); for the two-sample t test, ⫽ 2.38, df ⫽ 37, two-tailed P ⫽ 0.02. There was a modest but significant positive correlation between age and weirdness over all subjects: r ⫽ 0.105, two-tailed P ⫽ 0.04. There were no significant correlations within the patient group between weirdness and positive or negative symptom scores on the PANSS or between weirdness and the duration of antipsychotic drug treatment. There was also no difference in weirdness between male and female comparison subjects. Procrustes Analysis and Permutation Tests The steps of mean-centring, standardization, rotation, and dilation that are implicit in Procrustes analysis are illustrated in Fig. 6, which shows the Procrustean deformation of the generic interregional configuration of the patients to conform as closely as possible with the generic interregional configuration of the comparison subjects. The long-tailed permutation distribution for m 2, the test statistic for an overall difference in two generic configurations, is shown in Fig. 7. It is clear that the residual sum of distances between corresponding regions in the two configurations derived from the observed data is of the same order as that expected under the null hypothesis: one-tailed P ⫽ 0.74. Although our choice of r ⫽ 3 was guided by inspection of the stress curves (Fig. 2), one might wonder if significant be-
1235
FIG. 9. Repeated random resampling of the data, followed by 3D MDS and generalized Procrustes analysis, generates clouds or swarms of regional points in low-dimensional space (for graphic clarity only two dimensions are shown here). The observed regional coordinates for the control group (black circles) and the patient group (black squares) after Procrustean matching are also shown in the same space. It is clear that the residual distances between regions in the two observed configurations (indicated by black arrows) are not great and that the observed regional coordinates for both groups typically lie within the swarm of corresponding regional coordinates generated by resampling.
tween-group differences in interregional configuration could be demonstrated in the context of higher dimensional solutions. To test this, we repeated the permutation test with r ⫽ 5, but the observed difference between groups remained highly probable under the null hypothesis. The corresponding distributions for each region considered separately are summarized in Fig. 8. It is clear that the residual distance between each region in the two observed configurations is probable under the null hypothesis: all two-tailed P values were ⬎0.005 (the threshold value after Bonferroni correction for multiple comparisons). Another way of visualizing the results of data resampling in this context is to plot the clouds or swarms of regional coordinates on each of the first two (or three) dimensions generated by repeated permutation of the data after their Procrustean deformation to correspond as closely as possible to the generic configuration of the comparison subjects. A 2D example of this plot is shown in Fig. 9. This indicates that the regional coordinates observed for each of the generic configurations are generally separated by small residual distances after Procrustean deformation and that the observed regional coordinates for both groups generally lie within the swarm of corresponding regional coordinates generated under the null hypothesis by data resampling. We have confirmed these results by inspection of a 3D version of this plot, but it is difficult to represent intelligibly in the two dimensions of a printed page, so these results are not shown here.
1236
WELCHEW ET AL.
DISCUSSION There are two main methodological aspects to this work. First, we have applied the well-established technique of three-way multidimensional scaling (also known as individual differences scaling) to the analysis of groups of functional MRI data. This has allowed us to define a generic interregional configuration in a lowdimensional space, with quite readily interpretable dimensions in this example, and to quantify the deviation of each individual proximity matrix from the generic configuration. This may be of general interest as a way of quantifying the variability of integrated cognitive function (weirdness) within a group of data, and here we have shown that the variability of configuration is significantly greater in a group of patients with schizophrenia (than in an age-matched group of normal comparison subjects) and tends to become greater with age over all subjects. These observations suggest that changes in variability of integrated neurocognitive function may be associated with normal aging as well as the occurrence of neuropsychiatric disorders. The other main contribution has been to develop and apply a permutation test based on generalized Procrustes analysis and MDS that allows an inferential approach to the question of group differences in functional connectivity between brain regions. This complements the use of entirely exploratory techniques such as PCA or cluster analysis and the use of more confirmatory, model-driven techniques such as path analysis, allowing some probabilistic assessment of betweengroup differences in connectivity that is not conditional on prior specification of a structural model for the system. Among previously published methods, this technique is closest to the conjunction of partial least squares (PLS) and permutation testing proposed by McIntosh et al. (1996), although an important point of difference is that PLS can be explicitly informed by the experimental design whereas MDS is not. This means that if we wish to use MDS to explore connectivity between regions activated by an experimental design, we must use some prior, probably univariate analysis to define the regional components constituting the activated system, as we have done here. The question of which multivariate technique to apply in the connectivity analysis of functional MRI data therefore depends largely on how much the investigator already knows or is prepared to assume about the system under investigation. A related criterion is whether the investigator is aiming to explore in an open-minded way the set of regional relationships that define the system or whether there is a more focused intent to test a specific hypothesis about it. If one is prepared to assume only that the components of the system must be activated experimentally, then PCA or MDS applied to a set of regions identified by prior
univariate analysis might be appropriate; alternatively, one might apply PLS directly to the data without prior activation mapping. If one wishes to test hypotheses about behavior of the system, without assuming a great deal of prior knowledge about the system’s internal architecture, then it might be appropriate to use data resampling or permutation to sample the null distributions of “exploratory” multivariate statistics which do not generally have well-established asymptotic approximations. Finally, if one wishes to make a set of quite specific assumptions about the directional interactions between regions in the form of a path model, then path analysis or structural equation modeling can be used to test hypotheses probabilistically. The methods we have proposed here are most appropriate to the intermediate position of hypothesis testing in the absence of secure prior knowledge about the interregional relationships in the system. The three dimensions of functional space defined by MDS were interpreted in relation to the anatomical (left/right) and functional properties of the constituent regions. The relative proximity of regions in the space defined by these dimensions implies that they share important components of response to the experimental task. To put it another way, we can regard regions that cosegregate in the space of the first few dimensions as constituents of important subsystems. The occurrence of a left–right dimension in all solutions thus implies that the right and left hemispheres may define subsystems of functional activation, which may not be surprising given the verbal nature of the task and the considerable evidence for differential specialization of the left and right brain regions for language processing. If the dimensionality of the solution is constrained to two, then the next subsystems to be defined would be frontal and posterior. However, if the number of dimensions is increased to three, the unitary frontal– posterior dimension is replaced by two interesting, frontally orientated subsystems. We can think of these as frontally efferent and afferent subsystems, thereby emphasizing the pivotal role of the frontal cortex in conscious mediation of this task. The frontal efferent subsystem comprising SMA, left inferior parietal lobule, left inferior frontal gyrus, and left dorsal prefrontal cortex we have suggested may be functionally specialised for subvocal output, i.e., silently rehearsing the living/nonliving decision demanded by each trial of the task. The identification of this subsytem by MDS is compatible with prior results of PCA and canonical variates analysis applied to data acquired under the same experimental conditions from a different sample (Bullmore et al., 1996) and also with prior results of path analysis applied to the same group of control data (Bullmore et al., 2000). Moreover, our interpretation of this subsystem in relation to the subvocal articulatory demands of the task is congruent with previous psychological and imaging studies (Val-
MULTIDIMENSIONAL SCALING OF INTEGRATED NEUROCOGNITIVE FUNCTION
lar and Baddeley, 1982; Paulesu et al., 1993; Awh et al., 1995; Bullmore et al., 2000), suggesting that left dorsal and ventral prefrontal cortices, inferior parietal lobule, and SMA may be components of an anatomical circuit for articulatory rehearsal. The frontal afferent subsystem comprising SMA, bilateral dorsal prefrontal cortex, left superior temporal gyrus, and ventral extrastriate cortex we have suggested may be specialized for input processing, i.e., reading each word presented and making a semantic decision about the living or nonliving status of the object represented by it. This identification is also compatible with prior multivariate analysis of these and other data acquired under identical conditions (Bullmore et al., 1996, 2000) and with other imaging studies of reading and semantic analysis (Kapur et al., 1994; Rumsey et al., 1997). Although we regard this characterization of two frontally orientated subsystems as quite straightforward given prior knowledge (especially of this task), it is important to be clear that our labeling of these dimensions in terms of afferent and efferent, inputand output-specialized subsystems is an act of interpretation. Different investigators approaching these results from different theoretical or empirical backgrounds might choose different labels for these dimensions, and it will ultimately require MDS or other connectivity analysis of several experiments sharing some component process, e.g., articulatory rehearsal, to consolidate (or not) the associations between psychological process and integrated brain function that we have suggested. In any case, the precise interpretation of the dimensions is not critical to the use of these methods to investigate possible between-group differences in functional connectivity. It is interesting that we found no evidence of significant functional dysconnectivity “on average” in the schizophrenic patient group. There have been several prior analyses suggesting abnormal fronto-temporal functional connectivity in schizophrenia (Fletcher et al., 1999; Meyer-Lindenberg et al., 2001). Path analysis has been used to identify significant differences between schizophrenic patients and comparison subjects in effective connections between brain regions (Jennings et al., 1998). There is also some inferential analysis in support of abnormal anatomical connectivity in schizophrenia (Wright et al., 1999; Bullmore et al., 1997). The conceptual background and other data in support of the notion that schizophrenia can be understood as a disconnexion syndrome are reviewed elsewhere (Friston 1998; Bullmore et al., 1998). In this context, our results clearly refute the very general hypothesis that functional connections between all brain regions are abnormal under all experimental conditions in schizophrenia; indeed, this general hypothesis has previously been refuted by other negative functional imaging studies (Spence et al., 2000).
1237
The following question therefore arises: What accounts for variability in the detection of functional dysconnectivity in schizophrenia? Several possible explanations have already been proposed. First, it must be considered likely that dysconnectivity is anatomically restricted, rather than ubiquitous, with certain cortico-cortical and cortico-subcortical connections being particularly vulnerable to disruption in schizophrenia. Probably the strongest evidence to date has highlighted dysconnectivity between the frontal and lateral temporal cortices (Frith et al., 1995), between the frontal cortex and the hippocampus (Weinberger et al., 1992; Meyer-Lindenberg et al., 2001), in fronto-striatothalamic circuits (Robbins, 1990), and in frontothalamo-cerebellar circuits (Andreasen et al., 1998). The particular task we have used here activates predominantly frontal, occipital, and parietal regions, and therefore it may be that the functional configuration of the regional components of the system appears normal because fronto-parietal and fronto-occipital connections in particular are spared by whatever pathological process is responsible for dysconnectivity in other brain systems in schizophrenia. In short, we might argue that functional dysconnectivity is task dependent, and this conclusion would be compatible with previous results showing the task dependency of hypofrontality and other functional abnormalities in schizophrenia (Curtis et al., 1999). The main alternative position is that dysconnectivity is dependent on the characteristics of the sample of patients studied; i.e., not all patients with a diagnosis of schizophrenia will be equally likely to express functional dysconnectivity under the same experimental conditions. The strongest evidence in support of this view to date is that patients scanned during a task (overt verbal fluency) which normally elicits strong fronto-temporal connectivity may or may not demonstrate functional dysconnectivity in the fronto-temporal axis depending on their symptom state—more positively symptomatic patients being more functionally dysconnected (Spence et al., 2000). We could demonstrate no comparable association between the salience of positive or negative symptoms of psychosis and the variability of interregional configurations within the patient group. However, we did find evidence for significantly greater variability of integrated brain function in patients relative to normal comparison subjects, suggesting that some degree of inconsistency in this literature may be attributable to abnormal heterogeneity of interregional connections in patients with schizophrenia. ACKNOWLEDGEMENTS D.E.W. was supported by a Medical Research Council (UK) Postgraduate Studentship. G.D.H. was supported by a University of Cambridge Pinsent-Darwin Postdoctoral Research Fellowship in
1238
WELCHEW ET AL.
Mental Pathology. We thank colleagues in the MRI Unit at the Maudsley Hospital, London UK, for their help in acquiring these data. This study was presented at the 7th Annual Meeting of the Organisation for Human Brain Mapping, Brighton UK, June 10 –14, 2001.
REFERENCES American Psychiatric Association. 1994. Diagnostic and Statistical Manual of Mental Disorders, 4th ed. (DSM IV). APA, Washington, DC. Andreasen, N. C., Paradiso, S., and O’Leary, D. S. 1998. “Cognitive dysmetria” as an integrative theory of schizophrenia: A dysfunction in cortical subcortical– cerebellar circuitry? Schizophre. 24: 203–218. Awh, E., Smith, E. E., and Jonides, J. 1995. Human rehearsal processes and the frontal lobes: PET evidence. Ann. N. Y. Acad. Sci. 769: 97–117. Baumgartner, R., Somorjai, R., Summers, R., and Richter, W. 2001. Ranking fMRI time courses by minimum spanning trees: Assessing coactivation in fMRI. NeuroImage 13: 734 –742. Bookstein, F. L. 1998. Linear methods for nonlinear maps: Procrustes fits, thin-plate splines and the biometric analysis of shape variability. In Brain Warping (A. W. Toga, Ed.), pp 157–181. Academic Press, San Diego. Brammer, M. J., Bullmore, E. T., Simmons, A., Williams, S. C., Grasby, P. M., Howard, R. J., Woodruff, P. W., and Rabe-Hesketh, S. 1997. Generic brain activation mapping in functional magnetic resonance imaging: A nonparametric approach. Magn. Reson. Imaging 15: 763–770. Bullmore, E. T., Rabe-Hesketh, S., Morris, R. G., Williams, S. C., Gregory, L., Gray, J. A., and Brammer, M. J. 1996. Functional magnetic resonance image analysis of a large-scale neurocognitive network. NeuroImage 4: 16 –33. Bullmore, E. T., Frangou, S., and Murray, R. M. 1997. The dysplastic net hypothesis: An integration of developmental and dysconnectivity theories of schizophrenia. Schizophr. Res. 28: 143–156. Bullmore, E. T., Woodruff, P. W. R., Wright, I. C., Rabe-Hesketh, S., Howard, R. J., Shuriquie, N., and Murray, R. M. 1998. Does dysplasia cause anatomical dysconnectivity in schizophrenia? Schizophr. Res. 30: 127–135. Bullmore, E. T., Brammer, M. J., Rabe-Hesketh, S., Curtis, V. A., Morris, R. G., Williams, S. C., Sharma, T., and McGuire, P. K. 1999. Methods for diagnosis and treatment of stimulus-correlated motion in generic brain activation studies using fMRI. Hum. Brain Mapping 7: 38 – 48. Bullmore, E., Horwitz, B., Honey, G., Brammer, M., Williams, S., and Sharma, T. 2000. How good is good enough in path analysis of fMRI data? NeuroImage 11: 289 –301. Bullmore, E., Long, C., Suckling, J., Fadili, J., Calvert, G., Zelaya, F., Carpenter, T. A., and Brammer, M. 2001a. Colored noise and computational inference in neurophysiological (fMRI) time series analysis: Resampling methods in time and wavelet domains. Hum. Brain Mapping 12: 61–78. Bullmore, E. T., Suckling, J., and Brammer, M. J. 2001b. In praise of tedious permutation. In Spatial Statistics: Methodological Aspects and Applications (M. Moore, Ed.), pp 183–200. Springer-Verlag, New York. Curtis, V. A., Bullmore, E. T., Morris, R. G., Brammer, M. J., Williams, S. C., Simmons, A., Sharma, T., Murray, R. M., and McGuire, P. K. 1999. Attenuated frontal activation in schizophrenia may be task dependent. Schizophr. Res. 37: 35– 44. Edgington, E. S. 1995. Randomisation Tests. Dekker, New York. Everitt, B. S., and Rabe-Hesketh, S. 1997. The Analysis of Proximity Data. Arnold, London.
Fletcher, P., McKenna, P. J., Friston, K. J., Frith, C. D., and Dolan, R. J. 1999. Abnormal cingulate modulation of fronto-temporal connectivity in schizophrenia. NeuroImage 9: 337–342. Friston, K. J. 1994. Functional and effective connectivity in neuroimaging: A synthesis. Hum. Brain Mapping 2: 56 –78. Friston, K. J. 1998. The disconnection hypothesis. Schizophr. Res. 30: 115–125. Friston, K. J., Frith, C. D., Fletcher, P., Liddle, P. F., and Frackowiak, R. S. J. 1996. Functional topography: Multidimensional scaling and functional connectivity in the brain. Cereb. Cortex 6: 156 – 164. Frith, C. D., Friston, K. J., Herold, S., Silbersweig, D., Fletcher, P., Cahill, C., Dolan, R. J., Frackowiak, R. S. J., and Liddle, P. F. 1995. Regional brain activity in chronic-schizophrenic patients during the performance of a verbal fluency task. Br. J. Psychiatry 167: 343–349. Good, P. I. 1994. Permutation Tests: A Practical Guide to Resampling Methods for Testing Hypotheses. Springer-Verlag, New York. Holt, J. L., Van Horn, J., Callicott, J., Esposito, G., MeyerLindenberg, A., Egan, M., Weinberger, D. R., and Berman, K. F. 1999. Variability of frontal lobe functional neuroanatomy in schizophrenia: Implications for group analyses. Schizophr. Res. 36: 222–223. Jennings, J. M., McIntosh, A. R., Kapur, S., Zipursky, R. B., and Houle, S. 1998. Functional network differences in schizophrenia: A rCBF study of semantic processing. NeuroReport 9: 1697–1700. Kapur, S., Rose, R., Liddle, P. F., Zipursky, R., Brown, G. M., Stuss, D., Houle, S., and Tulving, E. 1994. The role of the left prefrontal cortex in vebral processing: Semantic processing or willed action? NeuroReport 5: 2193–2196. Kay, S. R., Fiszbein, A., and Opler, L. A. 1987. The positive and negative syndrome scale (PANSS) for schizophrenia. Schizophren. Bull. 13: 261–276. Krzanowski, W. J. 1988. Principles of Multivariate Analysis. Oxford Univ. Press, Oxford. McIntosh, A. R., Grady, C. L., Ungerleider, L. G., Haxby, J. V., Rapoport, S. I., and Horwitz, B. 1994. Network analysis of cortical visual pathways mapped with PET. J. Neurosci. 14: 655– 666. McIntosh, A. R., Bookstein, F. L., Haxby, J. V., and Grady, C. L. 1996. Spatial pattern analysis of functional brain images using partial least squares. NeuroImage 3: 143–157. Meyer-Lindenberg, A., Poline, J.-B., Kohn, P. D., Holt, J. L., Egan, M. F., Weinberger, D. R., and Berman K. F. 2001. Evidence for abnormal cortical functional connectivity during working memory in schizophrenia. Am. J. Psychiatry 158: 1809 –1817. Nicholls, T. E., and Holmes, A. P. 2002. Nonparametric permutation tests for functional neuroimaging: A primer with examples. Hum. Brain Mapping 15: 1–25. Paulesu, E., Frith, C. D., and Frackowiak, R. S. J. 1993. The neural correlates of the verbal component of working memory. Nature 362: 342–345. Robbins, T. W. 1990. The case for frontostriatal dysfunction in schizophrenia. Schizophr. Bull. 16: 391– 402. Rumsey, J. M., Horwitz, B., Donohue, B. C., Nace, K., Maisog, J. M., and Andreason, P. 1997. Phonological and orthographic components of word recognition. Brain 120: 739 –759. Spence, S. A., Liddle, P. F., Stefan, M. D., Hellewell, J. S. E., Sharma, T., Friston, K. J., Hirsch, S. R., Frith, C. D., Murray, R. M., Deakin, J. F. W., and Grasby, P. M. 2000. Functional anatomy of verbal fluency in people with schizophrenia and those at genetic risk— Focal dysfunction and distributed disconnectivity reappraised. Br. J. Psychiatry 176: 52– 60. Talairach, J., and Tournoux, P. 1988. A Co-Planar Stereotaxic Atlas of a Human Brain. Thieme, Stuttgart.
MULTIDIMENSIONAL SCALING OF INTEGRATED NEUROCOGNITIVE FUNCTION Takane, Y., Young, F. W., and de Leeuw, J. 1977. Nonmetric individual differences multidimensional scaling: An alternating least squares method with optimal scaling features. Psychometrika 42: 7– 67. Torgerson, W. S. 1952. Multidimensional scaling 1: Theory and method. Psychometrika 17: 401– 419. Vallar, G., and Baddeley, A. D. 1982. Short-term forgetting and the articulatory loop. Q. J. Exp. Psychol. A 34: 53– 60. Weinberger, D. R., Berman, K. F., Suddath, R., and Torrey, E. F. 1992. Evidence of dysfunction of a prefrontal–limbic network in schizophrenia—a magnetic-resonance-imaging and regional cere-
1239
bral blood-flow study of discordant monozygotic twins. Am. J. Psychiatry 149: 890 – 897. Worsley, K. J., Poline, J. B., Friston, K. J., and Evans, A. C. 1997. Characterizing the response of PET and fMRI data using multivariate linear models. NeuroImage 6: 305–319. Wright, I. C., Sharma, T., Ellison, Z. R., McGuire, P. K., Friston, K. J., Brammer, M. J., Murray, R. M., and Bullmore, E. T. 1999. Supra-regional brain systems and the neuropathology of schizophrenia. Cereb. Cortex 9: 366 –378. Young, F. W. 1982. Enhancements in ALSCAL-82. SUGI Proc. 7: 633– 642.