Asia Pacific Equity Research 08 August 2014
Initiation
Overweight
Pacific Radiance Ltd.
PACI.SI, PACRA SP Price: S$1.34
Time to jump on to the OSV bandwagon as we see 11-12% upside to consensus; initiate with Overweight
Price Target: S$1.75
Initiate at Overweight, Dec-15 PT of S$1.75: Pacific Radiance (PACRA) is one of the leading regional offshore support vessel (OSV) owners with a fleet size of over 130+ vessels (60+ fully owned; 70+ owned under Joint Ventures). The company’s key competitive advantages include: a) its experienced management team (ex-founders of Jaya Holdings which was one of the largest OSV owners in ’06-07) b) young fleet (one of the youngest globally with average age of ~4 years) and c) competitive business model of fleet expansion (building competitively at 3rd party yards) and recycling by selling down older assets either to the market (at a premium, thus booking gains due to lower cost to build) or to Logindo, its 35% owned Joint Venture based in Indonesia (which benefits from cabotage policy). Well positioned to benefit from rising OSV demand with strong presence in cabotage protected markets: With US$98 billion expected to be spent (source: Infield) between ’13-19E (an average of ~ US$14 bn over 7 years v/s US$9.5 bn of capex in 2012) in SE-Asia relating to Offshore O&G capex, we see solid demand for OSVs in the region with PACRA well positioned in the cabotage protected markets (~20-22% of earnings in 2014-16E) of Indonesia (via Logindo, PT Jawa) and Malaysia (via Alam Maritim). Besides SE-Asia demand, PACRA is likely to benefit from growth in high-demand Brazil (OSV market [demand for 686 vessels by 2020 v/s 470 today (source: Upstream)] and is looking to expand in Mexico (beneficiary of upcoming energy reforms) and Australia as well. Finally, its high margin subsea division (it owns 2 x diving support vessels) should also benefit from a strong subsea IRM outlook. 26% 2013-15E 2-year EPS CAGR driven by (a) fleet additions, (b) rising margins driven by higher utilization: With the company adding 19 vessels (of which 13 are fully owned) over the next 2 years backed by improved utilization of fleet (we estimate 4%p/p increase) alongside a shift towards higher-spec vessels (we estimate higher-spec vessels revenue share to increase from ~32% in FY13A to 47% in FY15E), we expect earnings to grow by 26% annually over 2013-15E. Moreover our FY15E/16E earnings are 12%/11% ahead of consensus and we think upcoming quarterly results will likely drive consensus upgrades. Reasonable valuations: PACRA currently trades at reasonable multiples with 2015E P/E multiple of 8.6x versus regional OSV owners ‘15E P/E of 11.1x (Malaysian OSV owners at 11.8x) and OSV builders at 9.5x ‘FY15E P/E. Pacific Radiance Ltd. (Reuters: PACI.SI, Bloomberg: PACRA SP) $ in mn, year-end Dec FY12A FY13A FY14E Revenue ($ mn) 131 169 206 Gross Profit ($ mn) 37 59 83 EBITDA ($ mn) 61 77 102 EBIT ($ mn) 37 52 68 Net Profit (rec) ($ mn) 32 57 70 EPS (recurring) ($) 0.06 0.08 0.10 P/E (x) 18.4 13.7 11.1 P/BV (x) 2.9 2.1 1.8 ROE 16.9% 19.6% 17.4% Net debt to equity 123.8% 60.4% 82.7% Gross Margin 28.3% 35.0% 40.2% Div Yield 0.0% 1.5% 1.8%
FY15E 260 112 128 91 91 0.12 8.6 1.5 19.2% 61.4% 43.3% 2.3%
FY16E 281 123 140 99 98 0.13 8.0 1.3 17.8% 43.3% 43.7% 2.5%
Singapore Oil Services & Equipment Ajay Mirchandani
AC
(65) 6882-2419
[email protected] Bloomberg JPMA MIRCHANDANI
J.P. Morgan Securities Singapore Private Limited Price Performance 1.4 S$
1.2 1.0 0.8 Aug-13
Nov-13
Feb-14
May-14
Aug-14
PACI.SI share price (S$) FTSTI (rebased)
Abs Rel
YTD 53.1% 48.5%
1m -3.6% -4.3%
Company Data Shares O/S (mn) Market Cap ($ mn) Market Cap ($ mn) Price (S$) Date Of Price Free Float(%) 3M - Avg daily vol (mn) 3M - Avg daily val (S$ mn) FTSTI Exchange Rate Price Target End Date
3m 24.1% 21.7%
12m 48.9% 46.3%
726 779 779 1.34 07 Aug 14 0.87 1.11 3320.23 1.25 31-Dec-15
Source: Company data, Bloomberg, J.P. Morgan estimates.
See page 43 for analyst certification and important disclosures, including non-US analyst disclosures. J.P. Morgan does and seeks to do business with companies covered in its research reports. As a result, investors should be aware that the firm may have a conflict of interest that could affect the objectivity of this report. Investors should consider this report as only a single factor in making their investment decision. www.jpmorganmarkets.com
Asia Pacific Equity Research 08 August 2014
Ajay Mirchandani (65) 6882-2419 [email protected]
Key catalyst for the stock price: • Near term contract wins • Upcoming delivery of vessels • Upcoming quarterly results
Upside risks to our view: • Higher than expected contract wins • Better than expected gross profit margins • Larger than expected fleet addition
Key financial metrics Revenues (US$ mn) Revenue growth (%) EBIT (US$ mn) EBIT margin (%) Tax rate (%) Net profit (US$ mn) EPS (US$) EPS growth (%) DPS (S$) BVPS (US$ ) Operating cash flow (US$ mn) Free cash flow (US$ mn)
FY12A 131
0.00 0.37 1 6
FY13A 169 29% 37 21.8% -7% 57 0.08 34% 2.00 0.52 22 (90)
FY14E 206 22% 52 25.2% 0% 70 0.10 24% 2.43 0.60 55 (121)
FY15E 260 26% 75 29.0% 0% 91 0.12 29% 3.12 0.71 89 60
Interest cover (X) Net margin (%) Sales/assets (X) Debt/equity (%) Net debt/equity (%) ROE (%) Key model assumptions OSV GP margin Subsea GP margin Complementary GP margin
1.8 25% 0.2 135% 125% 17% FY12A
2.8 34% 0.2 78% 61% 19% FY13A
4.1 34% 0.2 99% 83% 17% FY14E 38% 47% 15%
4.1 35% 0.3 82% 62% 19% FY15E 42% 48% 15%
20 15.5% -11% 32 0.06
Valuation and price target basis Our SOTP based valuation equates to a Dec15 price target of S$1.75. A breakdown of the Price Target is shown below.
Table to support valuation and price target P/E Ratio (S$ mn) Offshore Support & 12.0 710 Services 12.5 197 Subsea 13.5 178 Logindo (35%) 6.0 120 OSV gain on sale earnings 11.0 58 Others 11.1 1263 Total
Source: Bloomberg, Company and J.P. Morgan estimates.
Sensitivity analysis Sensitivity to 5% chg in sales 1% change in GP margin
Downside risks to our view: • Higher than expected Gearing • Lower than expected utilization & day rates
0.27 0.25 0.17 0.08 1.74
No. of shares outstanding
726
Price Target
1.75
Source: J.P. Morgan estimates.
EBITDA FY14E FY15E 11.9% 11.6% 2.4% 2.3%
EPS FY14E FY15E 14.6% 14.3% 2.9% 2.9%
JPMe vs. consensus, change in estimates Net Income FY14E FY15E JPMe old na na JPMe new 70 91 % chg Consensus 69 81
Source: J.P. Morgan estimates.
FY16E na 98 88
Source: Bloomberg, J.P. Morgan estimates.
Figure 1: Valuation comparables Mkt Cap $Mn
FY14E
FY15E
667 428 444
18.8x 14.2x 13.3x
13.5x 12.1x 11.5x
2.0x 2.1x 1.8x
1.8x 1.8x 1.5x
1.1% 0.1% 0.2%
777 1,411 267 440
11.0x 16.5x 11.9x 13.7x
8.6x 8.2x 9.2x 12.2x
1.8x 1.1x 2.0x 2.0x
1.5x 1.0x 1.7x 1.7x
Coastal Contracts
874
14.1x
12.3x
1.9x
Nam Cheong
796
9.9x
8.2x
2.2x
Vard
952
10.1x
8.1x
1.6x
Malaysia OSV players Icon Perdana Alam Maritim Regional OSV players PACRA POSH LEAD WINS
Per share 0.98
P/E
P/B FY14E
FY14E
FY15E
Net gearing FY14E FY15E
1.5% 0.5% 1.0%
15.5% 15.6% 14.5%
13.8% 15.2% 14.2%
61.0% 67.0% 47.9%
52.7% 43.1% 34.5%
1.8% 0.6% 1.4% 0.9%
2.3% 1.2% 1.7% 0.9%
17.4% 8.1% 19.4% 15.3%
19.2% 12.9% 20.2% 16.3%
82.7% 40.0% 117.2% 60.6%
61.4% 24.5% 123.2% 53.1%
1.8x
1.4%
1.5%
16.3%
16.0%
27.8%
35.2%
1.9x
2.4%
2.7%
25.1%
24.6%
61.0%
50.3%
1.4x
4.0%
5.0%
15.2%
16.9%
47.6%
50.8%
FY15E
Dividend yield FY14E FY15E
ROE
Regional OSV builders
Source: Bloomberg and J.P. Morgan estimates. Prices are as of 7th Aug 2014.
2
Asia Pacific Equity Research 08 August 2014
Ajay Mirchandani (65) 6882-2419 [email protected]
Investment Summary
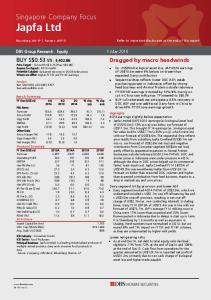
Figure 2: Revenues by segment (US$ mn)
300 200 100 0
95 5 11 79
131 4 17 110
169 206 14 18 49 45 109 139
OSV leader with young fleet, solid team, unique model
260 19 54
Pacific Radiance is one of the leading regional OSV players with a fleet size of over 130+ vessels (60+ fully owned while 70+ owned under various Joint Ventures). The company’s three main business segments are (i) offshore support services business [including its Joint Ventures / associates in Indonesia (Logindo, PT Jawa) & Malaysia (Alam Radiance)] , (ii) subsea business and (iii) complementary business, which comprises shipyard related work, marine equipment and project logistics. The company has a competitive edge in terms of: a) strong management team b) young fleet (one of the youngest globally) and c) competitive business model of fleet expansion (building competitively at 3rd party yards sourcing various equipment etc. directly) and recycling by selling down older assets either to (i) market (at premium due to lower cost to build) or to (ii) Logindo, its 35% owned Joint Venture based in Indonesia (which benefits from cabotage policy in country)
186
2011 2012 2013 14E 15E Offshore Support Services Business Subsea Business Complementary business Source: Prospectus, J.P. Morgan estimates.
Table 1: Margins Table (US$ mn,%) G.P. Margin (%) OSS (%) Subsea (%) EBITDA OSS Subsea EBITDA (%) OSS (%) Subsea (%) EBIT OSS Subsea EBIT (%) OSS (%) Subsea (%) vessel gains Associates PBT
2012 37 28% 34% (13%) 44 45 -1 34% 41% -6% 20 27 -6 15% 24% -37% 17 3 29
2013 59 35% 62 38 23 37% 35% 52% 37 18 18 22% 17% 40% 16 14 53
‘14E 83 40% 38% 47% 86 62 18 42% 45% 37% 52 35 13 25% 25% 26% 16 15 70
15E 112 43% 42% 48% 112 85 21 43% 46% 38% 75 56 15 29% 30% 28% 16 18 91
Strong management team The company is backed by a strong management team with experience in offshore sector. The company is led by Mr. Pang Yoke Min (holds 65.37% shares), an oil & gas veteran who is well-recognized as the co-founder of Jaya Holdings. He has served as the Managing Director of Jaya for more than 25 years from 1981 to 2006 and was instrumental in its rise to become an established player in offshore support and engineering services. Mr Mok Weng Vai, (holds 6.4% stake) the Executive Director of the company has over 20 years of experience in offshore industry and has worked in Jaya Holdings while Mr. Lau Boon Hwee, Managing Director of Shipyard and Equipment division has over 20 years of experience in the industry and has worked in Jaya Shipbuilding and Engineering as commercial manager. Figure 3: Geographical Presence
Source: Company, J.P. Morgan estimates.
Source: Prospectus.
Figure 4: 2013 Revenues by segments
Figure 5: 2013 Revenues by geography
Compleme ntary business 8% Subsea Business 27%
Australia 7%
Offshore Support Services Business 65%
South America 8%
Compleme ntary business -1% Subsea Business 29%
Others 0% Asia 69%
Africa 16%
% Source: Company Reports
Figure 6: 2013 Profit before tax by segment
Source: Company Reports
%
Offshore Support Services Business 70%
Source: Company Reports
3
Asia Pacific Equity Research 08 August 2014
Ajay Mirchandani (65) 6882-2419 [email protected]
Figure 7: Revenues by region 190 140 90 40
95 9 0 5
60 0 0 2 58
81
Young, modern and growing fleet of vessels Pacific Radiance's OSVs are relatively young, with an average age of 4 years vs. industry average of ~7 years. Having a young fleet provides better efficiencies, lower fuel consumption, and lower maintenance costs along with a higher chance of securing charter contracts.
169 131 12 14 3 8 27 24 116
95
-10 2010 2011 Asia Australia
PACRA is also looking to aggressively expand its fleet as the company will invest $800 million in five years to expand and plans to own and operate 100 vessels by 2019 compared with 62 (YE 2013), according to Bloomberg. .
2012 2013 Africa South America
Source: Prospectus.
Figure 8: Average fleet age of global OSV players
Figure 9: Fleet (year end) - Fully owned fleet only
14 11.5 12 12 12 10 10 9.5 8.5 10 7.5 7.5 8 8 7 6.5 6.5 8 6 4 4 4 4.5 4.5 4.8 5 5.1 4 2 0
120
100
100 80
62
70
74
74
2014E
2015E
2016E
60 40 20 0 2013
Source: Icon Offshore Prospectus
Source: Company Reports, J.P. Morgan estimates, Bloomberg 2019E represent company target
Competitive business model gives edge over competitors PACRA has in place a dedicated project management team to oversee the construction of most of its newbuilds at third-party shipyards. This enables it to exert certain degree of control over the shipbuilding process and customize its vessels, reducing delays in the process. Moreover, according to management, Pacific Radiance gets ~15-20% lower vessel cost using this model.
Fleet age younger than industry average
Coupled with the favourable cost, Pacific Radiance recycles vessels by selling older assets to market or its subsidiaries. The company has consistently sold vessels gaining a net of US$76mn from 2010-13. We believe these gains will be recurring in nature given the business model of recycling and replacing older vessels. Do note these vessels gains are not taxable as PACRA is vessel owner (& not vessel trader)
PACRA manages construction of its newbuilds at shipyards
Figure 10: Proceeds and gains from sale of vessels 140
127
100
79
80 40
Figure 11: Number of vessels sold
109%
120
60
79
120%
12
100%
10
80%
8
60% 27
28%
32 27%
20
17
25%
40%
16
20%
17
0
0% 2010
2019E
2011
Proceeds from vessel sales Profit % on Book Value
2012
2013 Gain on sale of vessels
11
7 5
6 4
2
2 0 2010
2011
2012
1H13
Source: Company Reports, J.P. Morgan estimates, Bloomberg
Source: Company Reports
Besides competitive vessel pricing, management is consistently looking to strengthen supply chain channels and processes for increased cost effectiveness and faster response time. Key initiatives include (a) marine equipment fabrication facility operational by early'14 and (b) ship repair yard operational by early '16 (PACRA has a 60% stake). 4
Asia Pacific Equity Research 08 August 2014
Ajay Mirchandani (65) 6882-2419 [email protected]
Strong presence in high growth and cabotage protected markets; build up of subsea presence. Pacific Radiance has key tie ups with Alam Maritim (49% owned JV) in Malaysia and PT Logindo (35% owned by Pacific Radiance) and PT Jawa in Indonesia. Being cabotage protected areas, these associates and JVs give Pacific Radiance access to these markets. Along with its own fleet of over 60+ vessels, tie-ups in Malaysia and Indonesia provide Pacific Radiance access to over 70+ more vessels. Apart from Singapore, Indonesia and Malaysia the company also has subsidiaries in the Netherlands (Radiance Offshore B.V), in Australia (Radiance Offshore Australia), joint venture CA Offshore incorporated in the BVI and Pacific Radiance (East Africa) in Mozambique. Already present in high-demand Brazil market; Expanding into Mexico soon Recently, Pacific Radiance has also set up a JV with Mexico’s Consultoria y Servicios Petroleros (CSP) , a Mexican shipping company for expansion in Mexico. With the upcoming energy reforms in Mexico, we believe PACRA will look to strengthen and expand its presence in Mexico to take advantage of emerging opportunities in the country. The company is also looking to expand its Australia presence which we see as key driver. Table 2: Key countries of focus for Pacific Radiance Country Malaysia
Cabotage protected Yes
Associates (Ownership)
Comments
Indonesia
Yes
Alam Radiance (L) (49%), Alam Radiance (M) (50%) Logindo (35%), PT Jawa Tirtamarin (49%)
Partnership with Alam Maritim provides access to Malaysian markets
Mexico
Yes
CR Offshore (49%)
Brasil Australia
Yes No
Crest Offshore & CA Offshore
Logindo is a listed entity on Jakarta Exchange having a fleet size of over 60 vessels. Planning expansion into Mexico after recent tie up with Consultoria y Servicios Petroleros (CSP) 2 Brazilian flagged Ocean Towing Tug 1 DSV contract secured in past; Revenue in 1H13 increased 170% y/y. We see 6 OSVs with CA Offshore kicking in over 4Q14 till 2Q15
Source: Company reports.
Building subsea presence; relatively young DSV fleet Pacific Radiance’s subsea business includes revenue from chartering of 2 Diving Support Vessels (DSVs). Revenue and utilization for this segment has seen a consistent growth.
Table 3: Global DSV Fleet Global DSV Fleet Vessels younger than 5 years Vessels older than 15 years
91 19 60
Global DSV fleet size of DSVs is 91 and management sees DSV as a niche market. According to the company, dayrates have improved by 50% for DSVs in the last 1218 months. Additionally, PACRA's DSV fleet is one of the youngest globally with an average age of 4 years vs. average age of 27 years for other major DSV players.
Source: Clarksons
Relatively younger DSV fleet gives edge over competitors
Figure 12: Major DSV players (number) 8 7 6 5 4 3 2 1 0
7
7
Source: Clarksons
7
6
Figure 13: Average age of DSV players (years)
5 3
3
3
3
3
2
2
2
2
2
45 40 35 30 25 20 15 10 5 0
42
4
5
5
7
10 11 12
15
18
22
31 34 27 29
Source: Clarksons
5
Asia Pacific Equity Research 08 August 2014
Ajay Mirchandani (65) 6882-2419 [email protected]
26% ‘13A-15E 2-year EPS CAGR driven by (i) growing share of “high value” fleet and (ii) improving margins. We see a 26% 2-year ’13-15E EPS CAGR (20% over 3 years) driven by: (1) growing fleet (13 “owned” vessels added including 8 x PSVs & 2 x MWVs) (2) 4%p/p increase in overall fleet utilization (3) rising gross margins on back of “higher margin vessels” kicking in Table 4: PACRA’s segmental revenues (US$ mn) ‘13A 169 109
Segment Revenue Offshore Support MPSVs AHTs AHTS PSVs MWVs AWBs Tugs & Barges SCVs Subsea Business Complementary business
Table 5: Utilization (%)
‘14E 206 139 9 14 27 29 22 14 19 6 49 18
19 45 14
‘15E 260 186 9 14 33 54 34 17 19 6 54 19
‘16E 281 207 9 15 35 72 34 17 19 6 54 20
Utilization OSVs MWVs AWBs Tugs & Barges SCVs Subsea
2013A 84% 84% 50% 55% 28% 83%
2014E 88% 87% 60% 55% 28% 88%
2015E 88% 87% 60% 55% 28% 88%
2016E 88% 87% 60% 55% 28% 88%
Table 6: Vessels under construction to be delivered (%) AHTS 1+2 0+2
2014E 2015E
PSV 4+2 4
MWV 2 0
AWB 1 0
ROV 1 0
Total 9+4 4+2
Source: Company, J.P. Morgan estimates *4 AHTS’ and 2 PSVs under construction will be owned under Joint Venture company, CA Offshore
Source: Company, J.P. Morgan estimates
As we can see below, share of revenues from "higher specification" vessels (AHTS / PSV / MWVs) is rising over the next few years which we believe will play key role in improving margins for OSV division. Moreover the US$100 million (translates to day rate of ~US$39,000) 7-year contract for Maintenance work vessel (MWV) announced in March 2014, will likely enjoy higher margins (as compared to fleet), in our view, which will also help improve margins over next few years. Figure 14: Share of revenues from higherspec vessels (AHTS + PSV + MWV) - % 150 100
50%
50 0
60% 50%
47%
38%
32%
80%
68%
65%
56%
Figure 15: Gross Margin estimates
40% 20%
55
78
122
141
0%
2013A 2014E 2015E 2016E Higher-Spec OSV revenues (AHTS + PSV + MWVonly) Higher Spec OSV revenues as % of OSV revenues Higher Spec OSV revenues as % of total revenues
50.0% 48.0% 46.0% 44.0% 42.0% 40.0% 38.0% 36.0% 34.0% 32.0% 30.0%
48.2% 46% 46.7% 42.0% 38.1%
53
6
10
16 37
-8
0
MWV
66% 60%
58% 57% 51%
49%
42%
40%
30%
Subsea
2015E
2012
2013
AHTS Others
PSV Total
May'14 AHT
4
56
4
13
Figure 18: “Fully owned” Fleet size, margins and utilization 98 6
100
62 74
2013 2014E 2015E Offshore Support Services Business Subsea Business Complementary business
43%
40%
35%
13
22%
71
25%
75
29%
75
44% 30%
50%
79 0
0% 2013
-8
Source: J.P. Morgan estimates
62% 61%
72%
Source: Company, J.P. Morgan estimates
45
2012
OSV (ex MWVs)
Source: Company, J.P. Morgan Estimates
70
-20
60%
75%
71%
70%
38%
2014E
91
30
41%
40%
Figure 17: PACRA’s estimated PBT breakup (US$ mn)
29
80%
50%
OSV overall
Source: J.P. Morgan Estimates
80
41%
Figure 16: Logindo AHTS / PSV v/s overall margins
2016E
2014E 2015E 2016E no. of AHTs / AHTS / PSVs / MPSVs (year end) no. of AWBs / MWVs (year end) no. of Subsea (year end) no. of Other vessels (year end) EBIT Margin (excl vessel sales gain) Gross Margins (%)
Source: Company, J.P. Morgan estimates
Asia Pacific Equity Research 08 August 2014
Ajay Mirchandani (65) 6882-2419 [email protected]
Table 7: PBT Breakup US$ mn PBT Breakup OSV Division Core OSV (ex – Logindo, gain on vessel sales) Logindo (share fell from 49% to 35% -end’13) Gain on sale of vessels Subsea Division Complementary Business
FY12 29 45 23 4 17 (8) (8)
FY13 53 37 13 9 16 16 (0)
FY14E 70 56 31 9 16 10 4
FY15E 91 74 47 11 16 13 4
FY16E 98 79 51 12 16 13 6
3 year CAGR 23% 28% 60% 10% 0% -7% na
Source: Company data, J.P. Morgan estimates.
Near term catalysts: (i) strong 2Q14 as margins to surprise, (ii) improved Indo outlook, (iii) new vessels & markets Figure 19: GP Margins
1Q14
4Q13
3Q13
2Q13
1Q13
4Q12
41% 45% 40% 40% 35% 34% 35% 30% 28% 30% 25% 20% 15% 10% 5% 0%
Source: Company Reports.
We see plenty of near term positive catalysts for the company including a) strong quarterly earnings b) improved Indonesian outlook c) positive surprise on fleet and geographical expansion. Strong quarterly 2Q results expected as MWV likely to drive margin surprise We expect gross margins to continue to beat on the upside driven by US$100mn contract for its maintenance work vessel (MWV) contract where we expect margins to be higher. We potentially estimate that gross margins could be 5-6%p/p higher for its 2087 men MWV’s versus its usual AHTS vessels given (a) similar cost of operations for two vessels but nearly 50-80% higher day rates on such vessels Improved Indonesian outlook The attractiveness of Indonesia’s upstream industry as an investment destination has taken a battering in recent years, because of the lack of certainty regarding contract extensions, the regulator and cost recovery issues along with issues of corruption. With election results announced, industry is keenly looking at how upstream industry of Indonesia moves forward. Jokowi’s planned energy policies for Indonesia i.e. stronger legal certainty on upstream industry activity may attract higher investment. Moreover our discussions with Logindo and Wintermar confirm the expectation that political certainty is likely to bring about return on OSV contract awards. Positive surprise on fleet and geographies? Pacific Radiance is eyeing expansion into new geographies. The company recently set up a JV with Mexico’s Consultoria y Servicios Petroleros (CSP) for expansion in Mexico. Besides, its potential foray into Mexico, we could see upside surprise from participation in Brazil as well as Australia. Besides, new geographies we also see upside risk to the 19 new vessels (13 fully owned and rest being associate assets) being added to the fleet
Reasonable valuation vs. peers Pacific Radiance is trading at reasonable valuation vs. its peers in Singapore and is cheaper than its Malaysian peers. Table 8: OSV Valuations
Malaysia OSV players Icon Perdana Alam Maritim Regional OSV players Pacific Radiance PACC Offshore Logindo (LEAD IJ) Wintermar (WINS IJ)
Mkt Cap $Mn
FY14E
P/E FY15E
P/B FY14E
643 431 445
18.1x 14.3x 13.3x
12.9x 12.1x 11.5x
1.9x 2.1x 1.8x
1.7x 1.8x 1.5x
1.1% 0.1% 0.2%
780 1,511 274 471
11.1x 17.7x 12.2x 14.6x
8.6x 8.8x 9.5x 13.0x
1.8x 1.2x 2.0x 2.1x
1.5x 1.1x 1.7x 1.8x
1.8% 0.0% 1.4% 0.9%
FY15E
Dividend yield FY14E FY15E
ROE
Net gearing FY14E FY15E
FY14E
FY15E
1.5% 0.5% 1.0%
15.5% 15.6% 14.5%
13.8% 15.2% 14.2%
61% 67% 48%
53% 43% 34%
2.3% 0.0% 1.6% 0.9%
17.4% 8.1% 19.4% 15.9%
19.2% 12.9% 20.2% 16.6%
83% 40% 117% 56%
61% 24% 123% 49%
Source: Bloomberg, J.P. Morgan estimates
7
Ajay Mirchandani (65) 6882-2419 [email protected]
Asia Pacific Equity Research 08 August 2014
Key Investment Risks High Utilization remains critical to strong earnings momentum. Earnings for Pacific Radiance are sensitive to utilization. We assume an 88% overall utilization for the next 3 years. As we can see below, every 5% change in utilization impact net earnings by ~14-15%. The key reason for the high sensitivity is the fixed cost nature of the cost base given that most costs are incurred irrespective of utilization of fleet (while some crew costs depend on utilization, the bulk of high cost crew is kept on company payrolls). Management does not disclose expiry and length of charters, but has indicated that most of the charters are short to medium term in nature. Figure 20: Net Income sensitivity to utilization (US$mn) 160 140 120 100 80 60 40 20 0
56, 28.8%
84, 14.4% 78, 14.3%
91
78%
83% FY14E
98
81, 14.6%
70
52, 28.6% 60, 14.6% 39, 29.3%
140, 28.6% 112, 14.4% 130, 28.6% 104, 14.3% 101, 29.3%
88% (base case) FY15E FY16E
93%
98%
Source: J.P. Morgan estimates
Sizeable capital commitments over next 12-18 months Pacific Radiance is planning rapid expansion of its fleet and has capex commitments of over US$300mn over the next 2 years with company highlighting a capex of US$320.8 million relating to its vessels under construction. Figure 21: Capital expenditure for Pacific Radiance (US$ mn) 236
250 192
200 150 100
84
74
89
85
2015E
2016E
50 0 2011
2012
2013
2014E
Source: Company, J.P. Morgan estimates
However given that net gearing remains reasonable (and declining moving forward) with improving cashflow generation, we see limited risk for now. Figure 22: Net gearing v/s Operating Cashflow v/s Free Cashflow for Pacific Radiance (US$ mn) 150
83%
100 50
22
61%
89
101
60
55
62%
76 43%
0 -50 -100
-88
-150 2013A
-121 2014E
Operating Cashflow (US$ mn)
Source: Company, J.P. Morgan estimates
8
2015E Free Cashflow (US$ mn)
2016E Net Gearing (%)
110% 90% 70% 50% 30% 10% -10% -30% -50% -70% -90%
Asia Pacific Equity Research 08 August 2014
Rising supply of newbuild PSVs may impact dayrates Supply of PSVs over the last 5 years has seen a considerable rise in newbuild PSV fleet with Orderbook / Fleet increasing over last few years. With 35% of the PSV fleet (by tonnage) yet to be delivered, we do see some near term pressures on PSV day rates however we see this being offset by strong demand from deepwater projects. Figure 23: PSV: Orderbook to Fleet by no of vessels & tonnage (%) 50.0% 45.0% 40.0% 35.0% 30.0% 25.0% 20.0% 15.0% 10.0% 5.0% 0.0%
35.4%
orderbook/fleet as % of GT
2014-07
2013-07
2012-07
2011-07
2010-07
2009-07
2008-07
2007-07
2006-07
2005-07
2004-07
2003-07
2002-07
2001-07
2000-07
1999-07
20.1%
1998-07
Ajay Mirchandani (65) 6882-2419 [email protected]
orderbook/fleet as % of no.
Source: Clarkson
Our analysis suggests that assuming, no slippage in PSV and rig future deliveries and also assuming every rig coming to the market getting a contract, PSV 2500+ GT to Rig Ratio is expected to remain high in the coming years. However, markets such as Brazil and Australia are likely to see strong demand for PSVs given the distance from shore of its various off shore assets making PSVs a preferred option. Moreover in SE-Asia while PSVs deployed are minimal. Figure 24: PSV to rig ratio 1.4 1.2 1.0 0.8 0.6 0.4
0.4 0.2
0.5 0.3
0.6 0.3
0.8
0.7
0.6
0.4
0.3
1.1
1.1
1.0
0.5
0.7
0.7
0.7
0.6
1.1
0.2 0.0 2008-12 2009-12 2010-12 2011-12 2012-12 2013-12 2014-07 PSV 2500+ GT/ active JU+SS+DS ratio
2014-12 2015-12 2016-12
PSV 2500+ GT/ total JU+SS+DS ratio
Source: Clarkson, J.P. Morgan Research
Steep fall in oil prices would impact demand, stock prices There is a high historical correlation between oil prices and the Oil Service sector index (OSX). Weakness in oil prices affects the level of offshore capex and would lead to lower charter rates and fleet utilization. Figure 25: Brent and WTI to OSX correlation 120% 90% 88%
100%
96% 95%
93% 94%
60%
87% 85%
86% 86%
80%
64% 49% 47%
42%
41%
40% 20%
1%
0% 2006
2007
2008
2009
Brent to OSX
2010
2011
2012
2013
WTI to OSX
Source: Bloomberg
9
Ajay Mirchandani (65) 6882-2419 [email protected]
Asia Pacific Equity Research 08 August 2014
Valuation analysis and comparables SOTP based Dec-2015 PT of S$1.75 Our Dec-15 PT of S$1.75 equates to 15x/11.7x FY14E/FY15E P/E and 2.3x/2.0x FY14E/FY15E P/B. Key assumptions for our valuation include: Offshore Support & Services valued at12.0x Dec-2015E earnings We value the Offshore Support vessels division at 12x 2015E P/E ratio which while at a premium to Singapore listed peers, we do see as reasonable compared to Malaysian and Indonesian peers which trade at 11-13x P/E multiples currently. Subsea division valued at 12.5x Dec-2015 earnings We view the subsea division as similar to PACRA’s OSV division i.e. vessel chartering business but with much more niche focus and given its higher G.P margins (as compared to OSV division), smaller fleet and higher barriers to entry we value it at a slightly higher multiple (vis-a-vis OSV division). 35% owned associate, Logindo valued at 13.5x Dec-2015 earnings While Logindo currently trades at only 9.2x FY15E earnings, we value it at 13.5x P/E as we see a likely re-rating as visibility improves on OSV demand in Indonesia (post the recent elections) and Logindo’s growth trajectory accelerates. Gain on sale of vessels valued at 6.0x Dec-2015 earnings While many investors would argue why we should ascribe a multiple to gain on sale of OSVs, we believe this is a key aspect of the business model. Given (a) competitive building of asset and (b) ability to sell to its associate, Logindo (beneficiary of cabotage market) we see PACRA being able to have recurring stream of earnings from this division for next several years and hence value it at 6x P/E. Complementary business valued at 11.0x Dec-2015 earnings. We ascribe a multiple of 11x for the complementary division which we view as fair and reasonable.
Table 9: Pacific Radiance - Sum of the Parts
Offshore Support & Services Subsea Logindo (35%) OSV gain on sale earnings Others Total Price target Source: J.P. Morgan estimates.
10
Net Income (US$ mn)
P/E
US$ mns
S$ mns
S$ / share
47.3 12.6 10.5 16.0 4.2 90.7
12.0 12.5 13.5 6.0 11.0 11.1
567.9 157.4 142.4 96.0 46.6 1010.3
709.9 196.7 177.9 120.0 58.3 1262.8
0.98 0.27 0.25 0.17 0.08 1.74 1.75
Asia Pacific Equity Research 08 August 2014
Ajay Mirchandani (65) 6882-2419 [email protected]
Valuation Comparables
Table 10: Valuation table for Malaysia oil & gas services players Company
Mkt Cap
P/E
P/B
Div. yield
ROE
Net Gearing
EV/EBITDA
(US$ mm)
14E
15E
14E
15E
14E
15E
14E
15E
14E
15E
14E
15E
Bumi Armada
3,119
20.9x
18.1x
2.1x
1.9x
1.0%
1.1%
10.5%
11.1%
98.9%
115.1%
11.4
10.6
SapuraKencana*
8,022
16.5x
14.2x
2.6x
2.2x
0.0%
0.0%
14.4%
14.4%
91.9%
70.1%
11.6
5.6
MMHE
1,752
25.6x
23.4x
2.0x
1.8x
0.8%
0.9%
7.9%
8.1%
Net Cash
Net Cash
14.8
12.9
Dialog
2,967
21.6x
17.9x
3.0x
2.7x
1.9%
2.2%
15.8%
17.3%
24.9%
28.3%
0.0
0.0
Perisai
567
22.7x
12.5x
1.8x
1.7x
0.0%
0.0%
7.7%
12.6%
77.9%
112.8%
23.4
14.6
UMW Oil and Gas
2,725
28.1x
22.6x
3.0x
2.8x
0.4%
0.4%
10.3%
11.6%
8.1%
16.6%
17.5
14.2
Petra
303
24.3x
17.4x
1.9x
1.8x
1.1%
1.5%
7.0%
9.4%
n/a
n/a
n/a
n/a
Dayang
980
15.0x
13.1x
3.4x
2.9x
n/a
n/a
7.0%
9.4%
2.3%
Net Cash
10.6
9.0
Nam Cheong
758
9.6x
7.9x
2.1x
1.8x
n/a
n/a
24.9%
24.5%
60.4%
53.8%
10.5
8.8
Coastal
856
14.2x
12.4x
2.0x
1.8x
1.3%
1.5%
16.3%
16.0%
28.0%
38.4%
13.9
10.6
Uzma
307
19.3x
14.8x
3.1x
2.5x
0.3%
0.3%
25.4%
24.7%
18.3%
6.8%
14.3
10.2
IEV
43
n/a
n/a
n/a
n/a
n/a
n/a
n/a
n/a
n/a
n/a
n/a
n/a
19.8x
15.8x
2.5x
2.2x
0.7%
0.9%
13.4%
14.5%
45.6%
55.2%
12.8
9.6
Average
Source: Bloomberg, JPM est. for Bumi, SAKP, MMHE, Dialog, Perisai, UMWOG. Bloomberg cons for others. Priced as of 4 Aug 14. *SAKP's 14E, 15E represents Jan 15 & 16. Dialog is June Y/E.
Table 11: Valuation table for FPSO players Company
Mkt Cap
P/E
P/B
Div. yield
ROE
Net Gearing
EV/EBITDA
(US$ mm)
14E
15E
14E
15E
14E
15E
14E
15E
14E
15E
14E
BW Offshore
932
7.6x
8.2x
0.8x
0.8x
8.6%
8.5%
10.6%
9.3%
131.2%
144.0%
5.5
6.0
Bumi Armada
3,119
20.9x
18.1x
2.1x
1.9x
1.0%
1.1%
10.5%
11.1%
98.9%
115.1%
11.1
10.5
Modec
1,410
15.7x
13.3x
1.3x
1.2x
1.3%
1.5%
10.2%
10.7%
Net Cash
18.1%
10.9
11.4
SBM Offshore
2,761
6.5x
6.2x
1.1x
0.9x
1.3%
1.9%
18.2%
15.2%
157.3%
96.8%
7.0
7.1
Sevan Marine
198
17.1x
13.9x
1.6x
1.5x
5.3%
2.7%
9.2%
9.5%
Net Cash
Net Cash
13.7
11.4
13.6x
12.0x
1.4x
1.3x
3.5%
3.1%
11.7%
11.2%
129.1%
93.5%
9.6
9.3
15E
14E
Average
15E
Source: Bloomberg, JPM est. for Bumi. Priced as of 4 Aug 2014.
Table 12: Valuation table for OSV players Company
Mkt Cap
P/E
P/B
Div. yield
ROE
15E
14E
15E
14E
15E
Bourbon
2,163
22.0x
14.6x
1.1x
1.1x
4.6%
4.8%
6.4%
8.3%
59.7%
97.4%
6.3
5.6
Bumi Armada
3,119
20.9x
18.1x
2.1x
1.9x
1.0%
1.1%
10.5%
11.1%
98.9%
115.1%
11.1
10.5
Deep Sea Supply
396
11.0x
6.7x
0.8x
0.8x
5.0%
11.1%
9.4%
12.5%
69.6%
199.5%
9.2
6.5
DOF
487
5.3x
3.9x
0.6x
0.5x
0.0%
4.9%
16.9%
16.3%
156.6%
Net Cash
6.3
6.1
Eidesvik
154
6.1x
3.7x
0.4x
0.4x
3.1%
3.1%
10.1%
12.0%
306.2%
82.5%
7.6
5.3
Farstad
715
9.1x
6.7x
0.6x
0.6x
3.0%
4.2%
7.0%
8.8%
205.8%
90.3%
7.2
6.8
1,027
11.8x
9.1x
0.9x
0.8x
2.6%
2.6%
8.0%
9.2%
43.5%
31.2%
7.7
6.0
191
4.3x
4.2x
0.6x
0.6x
2.5%
2.5%
15.3%
14.0%
n/a
n/a
8.8
8.3
1,571
36.0x
24.5x
1.0x
1.0x
n/a
n/a
n/a
n/a
n/a
n/a
7.5
6.7
Siem Offshore
497
7.4x
4.6x
0.6x
0.5x
3.1%
5.2%
8.7%
11.7%
101.0%
176.4%
7.5
6.2
Solstad
636
5.4x
4.6x
0.7x
0.6x
5.0%
5.8%
14.1%
14.5%
187.4%
121.0%
8.3
7.1
Tidewater
2,410
13.4x
10.3x
0.9x
0.8x
2.1%
2.1%
6.3%
8.0%
47.0%
50.6%
8.6
7.6
Hornbeck Offshore
1,553
16.0x
10.1x
1.1x
1.0x
0.0%
0.0%
8.0%
10.9%
55.0%
53.0%
7.9
5.4
13.0x
9.3x
0.9x
0.8x
2.7%
4.0%
10.1%
11.4%
121.0%
101.7%
8.0
6.8
Rem Offshore Seacor
Average
15E
EV/EBITDA
14E
Gulfmark Offshore
14E
Net Gearing
(US$ mm)
14E
15E
Source: Bloomberg, JPM est. for Bumi. Priced as of 4 Aug 2014.
11
Asia Pacific Equity Research 08 August 2014
Ajay Mirchandani (65) 6882-2419 [email protected]
Table 13: Valuation table for subsea players Company
Mkt Cap
P/E
P/B
Div. yield
ROE
Net Gearing
EV/EBITDA
(US$ mm)
14E
15E
14E
15E
14E
15E
14E
15E
14E
15E
14E
15E
Saipem
10,341
23.9x
12.3x
1.6x
1.4x
1.4%
2.6%
6.7%
11.4%
92.0%
62.3%
8.5
6.3
Subsea 7
5,937
8.6x
9.0x
0.8x
0.8x
3.5%
3.7%
10.5%
9.2%
4.9%
4.7%
4.6
4.5
Technip
10,372
14.9x
11.0x
1.7x
1.6x
2.8%
3.3%
12.7%
15.7%
Net Cash
Net Cash
6.4
4.7
Aker Solution
4,128
18.8x
12.0x
1.7x
1.6x
4.3%
4.4%
15.0%
12.9%
71.4%
14.0%
7.7
6.2
911
18.9x
12.7x
0.8x
0.8x
0.0%
0.0%
11.9%
2.8%
18.2%
65.9%
0.7
1.0
17.0x
11.4x
1.3x
1.2x
2.4%
2.8%
11.4%
10.4%
46.6%
36.7%
5.6
4.5
Ezra Average
Source: Bloomberg, JPM est. for Ezra. Priced as of 4 Aug 2014
Table 14: Margin comparison table for Malaysia oil & gas services players Company
EBITDA Margin
EBIT Margin
Net Margin
Return on Capital Employed
2013
2014
2015
2013
2014
2015
2013
2014
2015
2013
2014
Bumi Armada
46.3%
53.1%
56.1%
26.2%
26.2%
24.6%
20.8%
22.0%
22.3%
6.8%
5.4%
2015 5.2%
SapuraKencana
26.3%
28.2%
29.1%
16.3%
16.5%
16.5%
13.2%
13.3%
13.3%
6.5%
9.6%
10.1%
MMHE
9.2%
10.1%
10.1%
7.9%
8.8%
8.9%
7.4%
8.1%
8.2%
4.4%
4.7%
5.0%
Dialog Perisai UMW Oil and Gas
12.7% 84.6% 42.7%
13.1% 70.9% 46.3%
14.2% 60.7% 48.6%
10.9% 46.6% 31.2%
10.9% 37.5% 34.4%
11.9% 39.9% 37.0%
10.0% 66.2% 25.7%
9.6% 45.4% 28.1%
11.3% 36.5% 28.5%
2.4% 5.2% 9.8%
2.7% 6.6% 8.7%
3.1% 8.7% 9.2%
Petra
8.6%
12.4%
13.3%
5.8%
7.1%
9.2%
2.4%
6.1%
7.6%
n/a
n/a
n/a
Dayang
29.5%
27.8%
28.5%
27.1%
24.6%
25.2%
22.4%
20.2%
20.9%
5.7%
8.4%
9.8%
Nam Cheong
16.5%
16.4%
16.5%
15.5%
15.4%
15.2%
14.2%
13.9%
13.7%
7.6%
8.9%
10.5%
Coastal
19.3%
21.2%
24.1%
18.2%
18.9%
19.8%
17.2%
17.9%
17.4%
5.9%
6.4%
7.8%
Uzma
14.7%
14.0%
14.7%
13.9%
12.8%
13.2%
9.5%
9.5%
10.0%
5.3%
6.4%
8.8%
Average
28.2%
28.5%
28.7%
20.0%
19.4%
20.1%
19.0%
17.7%
17.3%
6.0%
6.8%
7.8%
Source: Bloomberg, JPM est. for Bumi, SAKP, MMHE, Dialog, Perisai and UMWOG. *Bloomberg cons for others. *SAKP's 2014E and 2015E represents Jan 15 & 16. Dialog is June Y/E.
Table 15: Margin comparison table for FPSO players Company
EBITDA Margin
EBIT Margin
Net Margin
Return on Capital Employed
2013
2014
2015
2013
2014
2015
2013
2014
2015
2013
2014
2015
BW Offshore
48.5%
49.3%
48.8%
20.4%
23.6%
23.2%
10.1%
13.2%
12.4%
7.7%
8.8%
7.9%
Bumi Armada
46.3%
53.1%
56.1%
26.2%
26.2%
24.6%
20.8%
22.0%
22.3%
6.8%
5.4%
5.2%
Modec
3.9%
3.7%
4.4%
3.0%
2.5%
2.8%
3.0%
2.8%
3.4%
6.3%
6.2%
5.5%
SBM Offshore
18.9%
18.9%
21.1%
13.2%
12.6%
14.1%
9.4%
9.4%
10.5%
11.9%
9.5%
9.4%
Sevan Marine
10.8%
13.7%
15.8%
10.4%
13.4%
15.5%
13.2%
14.4%
16.5%
6.1%
7.2%
8.6%
Average
25.7%
27.7%
29.3%
14.7%
15.7%
16.0%
11.3%
12.4%
13.0%
7.7%
7.4%
7.3%
Source: Bloomberg, JPM est. for Bumi.
12
Asia Pacific Equity Research 08 August 2014
Ajay Mirchandani (65) 6882-2419 [email protected]
Table 16: Margin comparison table for OSV players Company
EBITDA Margin
EBIT Margin
Net Margin
Return on Capital Employed
2013
2014
2015
2013
2014
2015
2013
2014
2015
2013
2014
2015
Bourbon
37.2%
29.5%
26.2%
18.9%
13.4%
11.4%
4.3%
5.6%
6.4%
7.8%
7.2%
7.8%
Bumi Armada
46.3%
53.1%
56.1%
26.2%
26.2%
24.6%
20.8%
22.0%
22.3%
6.8%
5.4%
5.2%
Deep Sea Supply
71.9%
53.2%
55.5%
50.7%
33.4%
37.8%
10.1%
17.3%
24.5%
11.8%
6.8%
10.5%
DOF
32.5%
36.1%
35.2%
19.9%
26.0%
24.8%
2.9%
5.2%
7.1%
7.6%
11.5%
11.5%
Eidesvik
56.0%
52.3%
58.7%
27.9%
26.0%
33.5%
14.8%
15.1%
21.8%
7.9%
6.5%
10.9%
Farstad
38.2%
40.7%
41.7%
22.0%
24.5%
25.6%
8.6%
10.5%
13.1%
7.1%
8.4%
9.1%
Gulfmark Offshore
35.5%
37.8%
40.9%
21.3%
22.4%
26.0%
14.4%
16.2%
19.2%
6.5%
7.7%
10.5%
Rem Offshore
n/a
50.7%
48.7%
n/a
39.2%
37.3%
n/a
21.8%
20.0%
n/a
8.8%
9.2%
Seacor
15.9%
20.0%
20.6%
5.2%
9.6%
10.4%
2.9%
4.1%
5.9%
3.5%
6.5%
7.5%
Siem Offshore
37.0%
38.0%
41.7%
18.9%
22.4%
25.5%
6.5%
11.8%
16.0%
5.1%
7.9%
9.9%
Solstad
44.0%
44.0%
46.3%
32.1%
33.2%
35.3%
18.3%
20.2%
22.8%
9.4%
9.1%
10.7%
Tidewater
28.1%
30.6%
31.8%
15.3%
19.8%
20.8%
11.0%
12.5%
14.2%
5.6%
7.6%
8.7%
Hornbeck Offshore
46.3%
45.4%
48.7%
31.2%
28.9%
34.3%
15.2%
14.4%
18.2%
8.0%
8.0%
13.1%
Average
40.7%
40.9%
42.5%
24.1%
25.0%
26.7%
10.8%
13.6%
16.3%
7.3%
7.8%
9.6%
Source: Bloomberg, JPM est. for Bumi. Bloomberg cons. for others.
Table 17: Margin comparison table for subsea players Company
EBITDA Margin
EBIT Margin
Net Margin
Return on Capital Employed **
2013
2014
2015
2013
2014
2015
2013
2014
2015
2013
2014
Saipem
5.8%
11.2%
14.3%
-0.1%
5.3%
8.4%
-2.8%
2.6%
4.8%
-0.1%
5.6%
2015 9.4%
Subsea 7
16.8%
19.4%
20.6%
10.5%
13.6%
14.4%
5.9%
10.1%
9.8%
10.6%
15.2%
15.5%
Technip
11.5%
10.5%
12.1%
9.1%
8.1%
9.7%
6.1%
5.3%
6.6%
11.1%
12.1%
17.0%
Aker Solution
8.9%
8.2%
9.7%
5.2%
6.1%
6.8%
3.3%
3.4%
4.3%
6.9%
9.6%
11.2%
Ezra
12.6%
11.2%
12.2%
8.6%
6.7%
7.9%
-3.1%
3.4%
4.3%
-1.4%
1.5%
2.0%
Average
11.1%
12.1%
13.7%
6.7%
7.9%
9.4%
1.9%
4.9%
6.0%
5.4%
8.8%
11.0%
Source: Bloomberg, JPM est. for Ezra
13
Asia Pacific Equity Research 08 August 2014
Ajay Mirchandani (65) 6882-2419 [email protected]
Table 18: Valuation Shipyards Company
Mkt Cap
P/E
P/B
Div. Yield
ROE
Net Gearing
(US$ mn)
2014
2015
2014
2015
2014
2015
2014
2015
2014
2015
Keppel Corp
15,748
13.0x
11.4x
1.9x
1.8x
4.6%
4.6%
15.0%
16.0%
Net Cash
Net Cash
SMM
6,874
14.2x
13.0x
2.9x
2.7x
4.2%
4.6%
21.6%
21.5%
Net Cash
Net Cash
Ezion
2,269
10.1x
9.1x
2.1x
1.7x
0.1%
0.2%
23.5%
19.8%
85.3%
69.4%
303
12.2x
8.1x
1.9x
1.8x
5.7%
8.6%
16.1%
22.9%
Net Cash
Net Cash
VARD
1,013
10.7x
8.6x
1.7x
1.5x
3.7%
4.6%
16.7%
18.6%
47.6%
50.8%
Ezra
915
18.9x
12.7x
0.8x
0.8x
0.0%
0.0%
4.4%
6.3%
123.8%
132.4%
13.2x
10.5x
1.9x
1.7x
3.1%
3.8%
16.2%
17.5%
85.6%
84.3%
Singapore
Dyna-Mac
Average (Singapore) Korea Daewoo
4,715
13.2x
9.6x
0.9x
0.8x
1.3%
1.4%
6.8%
8.9%
110.6%
93.1%
Hyundai H.I.
11,073
n/a
18.9x
0.6x
0.6x
1.4%
1.4%
-3.9%
3.2%
62.0%
58.7%
Samsung H
6,359
31.3x
10.9x
1.0x
1.0x
1.5%
1.8%
3.4%
9.2%
24.3%
16.3%
Hyundai Mipo
2,488
n/a
31.3x
0.8x
0.8x
0.8%
0.9%
-7.3%
2.9%
26.3%
23.6%
22.2x
17.7x
0.8x
0.8x
1.3%
1.4%
-0.3%
6.1%
55.8%
47.9% 47.3%
Average (Korea) China COSCO
1,267
27.2x
27.8x
1.2x
1.2x
2.8%
2.8%
4.3%
4.2%
51.0%
CSSC
5,248
106.0x
49.8x
1.9x
1.8x
0.2%
0.4%
1.4%
3.4%
n/a
n/a
COOEC**
5,438
10.0x
8.8x
1.7x
1.5x
2.8%
2.6%
18.0%
17.5%
Net Cash
Net Cash
47.7x
28.8x
1.6x
1.5x
1.9%
1.9%
7.9%
8.4%
51.0%
47.3%
Average (China) Malaysia SAKP
8,022
16.5x
14.2x
2.2x
1.9x
0.0%
0.0%
14.4%
14.4%
91.9%
70.1%
BAB
3,119
20.9x
18.1x
2.1x
1.9x
1.0%
1.1%
10.5%
11.1%
98.9%
115.1%
MMHE
1,752
25.6x
10.0x
2.0x
1.9x
0.8%
0.9%
7.9%
8.1%
Net Cash
Net Cash
Dialog
2,967
21.6x
11.0x
5.9x
5.4x
1.9%
2.2%
15.8%
17.3%
24.9%
28.3%
UMWOG
2,725
28.1x
12.0x
2.8x
2.5x
0.4%
0.4%
10.3%
11.6%
8.1%
16.6%
567
22.7x
13.0x
1.6x
1.4x
0.0%
0.0%
7.7%
12.6%
77.9%
112.8%
22.6x
13.0x
2.8x
2.5x
0.7%
0.8%
11.1%
12.5%
60.3%
68.6%
Perisai Average (Malaysia)
Source: J.P. Morgan Estimates, Bloomberg, Priced as of 4 Aug 2014. *SAKP's 2014E and 15E represents Jan 15 & Jan 16 respectively. Dialog is June Y/E.
14
Asia Pacific Equity Research 08 August 2014
Ajay Mirchandani (65) 6882-2419 [email protected]
Table 19: Valuation International Drillers Company
Mkt Cap
P/E
P/B
Div. yield
ROE
Net Gearing
(US$ mn)
2014
2015
2014
2015
2014
2015
2014
2015
2014
2015
3,106
10.1x
6.7x
1.2x
1.0x
0.0%
0.0%
13.3%
16.8%
65.3%
49.1%
Offshore
6,460
14.8x
11.6x
1.4x
1.4x
7.4%
7.3%
9.8%
12.5%
52.3%
46.7%
Ensco
11,840
8.8x
8.5x
0.9x
0.9x
5.7%
6.0%
10.1%
10.3%
36.8%
43.0%
539
14.3x
8.1x
0.6x
0.6x
0.0%
0.0%
3.2%
8.6%
44.0%
Net Cash
US Drillers Atwood Diamond
Hercules Noble
6,864
8.2x
8.3x
0.8x
0.7x
5.2%
5.9%
9.6%
9.2%
69.2%
52.1%
Pacific Drilling
1,970
12.1x
7.7x
0.8x
0.8x
0.0%
6.8%
6.3%
9.6%
Net Cash
24.0%
Rowan
3,813
14.1x
7.3x
0.7x
0.7x
0.9%
1.3%
5.5%
9.6%
39.5%
56.5%
Seadrill
17,726
11.9x
10.2x
1.9x
1.9x
11.0%
11.1%
29.7%
18.2%
243.7%
132.1%
Transocean
14,303
9.5x
11.0x
0.8x
0.8x
7.3%
7.6%
8.5%
7.2%
17.7%
Net Cash
576
6.3x
6.0x
1.0x
0.8x
n/a
n/a
17.7%
14.2%
263.4%
687.3%
11.0x
8.5x
1.0x
1.0x
4.2%
5.1%
11.4%
11.6%
92.4%
136.3%
9.7x
9.0x
1.6x
1.4x
2.9%
3.1%
17.6%
16.4%
36.4%
27.6%
Vantage Average (US) Int Drillers COSL
13,427
Prospector
270
n/a
7.5x
1.5x
1.2x
n/a
n/a
-2.5%
15.9%
20.6%
Net Cash
Sevan Drill.
285
12.0x
4.0x
0.4x
0.4x
0.0%
0.0%
3.0%
10.3%
339.6%
147.6%
10.8x
6.8x
1.1x
1.0x
1.5%
1.6%
13.3%
17.4%
132.2%
87.6%
Average (Intl)
Source: Bloomberg, Priced as of 4 Aug 2014
Table 20: Margins International Drillers Company
EBITDA Margin
EBIT Margin
Net Margin
EPS
ROCE
2013
2014
2015
2013
2014
2015
2013
2014
2015
2013
2014
2015
2013
2014
2015
Atwood
51.0%
46.7%
51.9%
40.1%
34.2%
40.2%
32.7%
26.5%
31.0%
5.28
4.78
7.20
10.0%
8.6%
13.2%
Diamond
41.3%
37.2%
39.9%
27.6%
21.8%
24.3%
20.6%
15.2%
16.2%
4.40
3.18
4.08
10.7%
7.5%
9.7%
Ensco
48.4%
47.4%
46.4%
36.1%
34.5%
33.4%
28.8%
27.1%
25.5%
6.12
5.75
5.92
10.8%
10.0%
10.3%
Hercules
33.6%
33.4%
35.2%
15.2%
15.9%
20.2%
4.0%
4.7%
7.2%
0.18
0.24
0.42
8.7%
10.5%
15.6%
Noble
46.6%
47.4%
46.4%
25.9%
27.6%
27.0%
17.9%
17.8%
17.1%
2.92
3.29
3.25
8.7%
10.4%
10.9%
Pacific Drill.
48.0%
51.1%
53.9%
28.1%
30.7%
34.0%
11.7%
15.4%
18.3%
0.40
0.78
1.22
5.0%
6.7%
9.9%
Rowan
38.0%
38.6%
43.8%
21.3%
21.5%
28.6%
15.6%
15.2%
21.2%
1.95
2.18
4.17
6.4%
6.2%
11.0%
Seadrill
53.1%
54.6%
52.9%
39.5%
41.9%
39.4%
28.1%
26.9%
26.9%
2.85
3.03
3.51
6.7%
7.2%
7.2%
Transocean
36.6%
39.1%
37.9%
24.8%
26.0%
24.4%
15.6%
16.8%
14.5%
4.14
4.15
3.58
10.6%
9.9%
8.9%
Vantage
49.7%
52.6%
51.5%
34.6%
36.9%
35.8%
1.6%
10.8%
11.0%
0.04
0.30
0.31
7.3%
10.3%
9.4%
Average (US)
44.6%
44.8%
46.0%
29.3%
29.1%
30.7%
17.7%
17.6%
18.9%
283%
277%
337%
8.5%
8.7%
10.6%
COSL
40.8%
40.3%
40.0%
27.9%
28.1%
28.0%
24.0%
23.6%
1.39
1.58
1.70
7.2%
8.7%
9.8%
Prospector
-583%
10.9%
47.7%
-596%
-4.8%
34.5%
23.1% 534.7%
-35.8%
17.5%
(0.38)
(0.26)
0.38
-8.1%
-0.4%
6.6%
Sevan Drill
29.2%
43.5%
49.4%
3.8%
22.9%
31.4%
-50.7%
5.2%
14.1%
(0.16)
0.04
0.12
0.6%
4.6%
9.6%
US Drillers
Int Drillers
Source: Bloomberg, Priced as of 4 Aug 2014
15
Ajay Mirchandani (65) 6882-2419 [email protected]
Asia Pacific Equity Research 08 August 2014
Financial Summary We project strong revenue growth of 20% in FY14E and 26% in FY15E driven by a) higher utilization of 88% in FY14 and FY15 vs. utilization of 84% in FY13 b) higher dayrates for maintenance work vessel (MWV) c) increased fleet size to 63 by end of FY14 and 69 by end of FY15 (vs. 60 in FY13). We estimate overall gross margins to improve to 40% in FY14 and 42% in FY15 vs. 35% in FY13. Table 21: Income Statement US$mn Income Statement
2011
2012
2013
2014E
2015E
2016E
Revenue Cost of Sales Gross Profit Other Operating Income General and administrative expenses Other operating expenses Finance costs Share of results of joint venture companies Share of results of associated companies Profit before tax Taxation Net profit Minorities PATMI
95 -65 30 18
131 -94 37 22
169 -110 59 26
206 -123 83 22
260 -147 112 22
281 -158 123 23
-14 -4 -10
-18 -3 -11
-27 -6 -13
-31 -6 -13
-37 -6 -18
-41 -6 -21
2
8
13
12
15
16
-4 19 0 18 0 18
-5 29 3 32 0 32
1 53 4 57 0 57
3 70 0 70 0 70
3 91 0 91 0 91
3 98 0 98 0 98
EBITDA (excl vessel sale gains) EBIT (excl vessel sale gains) EPS (US$ per share)
31 14 0.03
44 20 0.06
62 37 0.08
86 52 0.10
112 75 0.12
124 83 0.13
2011 95
2012 131
2013 169
2014E 206
2015E 260
2016E 281
79 11 5 31
110 17 4 44
109 45 14 62
139 49 18 86
186 54 19 112
207 54 20 124
26 4 1 19
45 (1) 0 29
38 23 0 53
62 18 6 70
85 21 6 91
95 21 8 98
22 1 (4)
45 (8) (8)
37 16 (0)
56 10 4
74 13 4
79 13 6
Source: Company data, J.P. Morgan estimates.
Table 22: Segmental Breakdown US$mn Segmental Breakdown Revenue Offshore Support Services Business Subsea Business Complementary business EBITDA (excluding vessel gains) Offshore Support Services Business Subsea Business Complementary business Profit Before Tax Offshore Support Services Business Subsea Business Complementary business
Source: Company data, J.P. Morgan estimates.
16
Ajay Mirchandani (65) 6882-2419 [email protected]
Asia Pacific Equity Research 08 August 2014
Table 23: Segmental Revenues and earnings US$ millions Segmental Information Segment Revenue Offshore Support Services Business Subsea Business Complementary business Segmental COGS Offshore Support Services Business Subsea Business Complementary business Gross Profit Segmental Offshore Support Services Business Subsea Business Complementary business EBITDA (including vessel gains) Offshore Support Services Business Subsea Business Complementary business EBITDA (excluding vessel gains) Offshore Support Services Business Subsea Business Complementary business EBIT (excluding vessel gains) Offshore Support Services Business Subsea Business Complementary business PBT (excluding vessel gains & excluding JV & Assoc earnings) Offshore Support Services Business Subsea Business Complementary business Profit Before Tax Offshore Support Services Business Subsea Business Complementary business
2010 60 57 0 3 (49) (47) (0) (2) 10 10 (0) 0 40 42 (2) (0) 13 15 (2) (0) (1) 1 (2) (0)
2011 95 79 11.43 5 (65) (54) (9) (2) 30 25 3 2 47 43 4 1 31 26 4 1 14 12 1 1
2012 131 110 17 4 (94) (72) (20) (2) 37 38 (2) 2 61 62 (1) 0 44 45 (1) 0 20 27 (6) 0
2013 169 109 45 14 (110)
77 53 23 0 62 38 23 0 37 18 18 0
2014E 206 139 49 18 (123) (86) (26) (11) 83 53 23 7 102 78 18 6 86 62 18 6 52 35 13 4
2015E 260 186 54 19 (147) (108) (28) (11) 112 78 26 8 128 101 21 6 112 85 21 6 75 56 15 4
2016E 281 207 54 20 (158) (120) (28) (10) 123 87 26 10 140 111 21 8 124 95 21 8 83 62 15 6
(7) (5) (2) (0) 18 21 (2) (1)
4 2 1 1 19 22 1 (4)
9 17 (8) 0 29 45 (8) (8)
24 7 16 0 53.0 37.5 15.9 (0.4)
39 25 10 4 70.4 55.8 10.4 4.2
57 40 13 4 90.7 73.9 12.6 4.2
62 44 13 6 97.8 79.4 12.6 5.8
2010 17% 18% ! 17%
2011 32% 31% 25% 53%
2012 28% 34% -13% 49%
2013 35%
2014E 40% 38% 47% 40%
2015E 43% 42% 48% 43%
2016E 44% 42% 48% 51%
22% 27%
33% 33% 33% 15%
34% 41% -6% 7%
37% 35% 52% 4%
42% 45% 37% 33%
43% 46% 38% 33%
44% 46% 39% 40%
14% 16% 7% 13%
15% 24% -37% 5%
22% 17% 40% 3%
25% 25% 26% 23%
29% 30% 28% 22%
30% 30% 28% 29%
4% 3% 5% 13%
7% 15% -47% 5%
14% 7% 35% 3%
19% 18% 21% 23%
22% 22% 23% 22%
22% 21% 23% 29%
59
Source: Company, J.P. Morgan estimates
Table 24: Segmental Margins US$ millions GP Margins Segmental Offshore Support Services Business Subsea Business Complementary business EBITDA margins (excluding vessel gains) Segmental Offshore Support Services Business Subsea Business Complementary business EBIT margins (excluding vessel gains) Segmental Offshore Support Services Business Subsea Business Complementary business PBT margins (excluding vessel gains & JV earnings) - Segmental Offshore Support Services Business Subsea Business Complementary business
-16% -1% 2% -17% -13% -10% -17%
Source: Company, J.P. Morgan estimates
17
Ajay Mirchandani (65) 6882-2419 [email protected]
Asia Pacific Equity Research 08 August 2014
Table 25: Balance Sheet US$mn Balance Sheet Inventories Work in progress Trade receivables Other receivables Amount due from related companies Cash and cash equivalents Total current assets Vessels, plant and equipment Investment in subsidiaries Investment in associated companies Investment in JV companies Club membership Total non current assets Total assets Trade payables Other payables Amount due to related companies Loans and borrowings Provision for taxation Finance lease obligations Current Liabilities Loans and borrowings Other payables Deferred Tax Non Current Liabilities Total Liabilities Share capital Retained earnings Other reserve Capital reserve Shareholders equity Minority Interest Total equity
2011 0 2 16 4
2012 0 1 22 2
2013 0 2 31 6
2014E 0 3 48 8
2015E 0 3 71 11
2016E 0 3 89 14
24 12 59 362 0
6 14 45 443 0
32 24 95 446 0
28 65 152 549 0
28 71 185 707 0
28 108 243 714 0
0 5 0 368 426 6 23 0 51 17 0 97 171 4 0 175 273 32 122 (1) 0 153 0 154
1 26 0 470 515 7 35 0 53 18 0 114 221 4 0 225 339 32 141 (0) 3 176 0 176
2 27 0 475 570 7 51 2 54 16 0 130 225 9 0 234 364 32 173 (1) 0 205 2 206
3 42 0 593 746 11 43 1 53 10 0 120 240 9 0 249 368 155 223 (3) 0 376 2 377
6 54 0 766 951 11 51 1 53 10 0 127 378 9 0 388 515 155 282 (3) 0 434 2 436
9 68 0 792 1035 14 64 1 53 10 0 143 370 9 0 379 522 155 358 (3) 0 511 2 513
Source: Company, J.P. Morgan estimates.
Figure 26: Net Gearing 140%
125%
120% 100%
83%
80%
62%
61%
60%
43%
40% 20% 0% 2012 Source: Company, J.P. Morgan estimates
18
2013
2014E
2015E
2016E
Ajay Mirchandani (65) 6882-2419 [email protected]
Asia Pacific Equity Research 08 August 2014
Table 26: Cash Flow Statement US$mn Cash Flow Statement Profit before tax Depreciation Other Adjustments CFO before change in working capital Changes in WC Net interest expense Taxes Net cash flow from operating activities Purchase of PPE Sale of vessels / PPE Others Cash flow from investing Issue of new shares Loans raised (repaid) Dividends paid Others Cash flow from financing Net change in cash
2011 19 17 0 36 17 -9 0 43 -84 32 -28 -80 0 39 0 0 39 2
2012 29 24 -9 44 -31 -11 -1 1 -74 79 -1 4 0 4 0 -1 4 9
2013 53 25 -17 61 -27 -11 0 22 -192 79 2 -110 123 13 -7 0 129 41
2014E 70 34 -20 85 -19 -11 0 55 -236 60 0 -176 0 139 -12 0 127 6
2015E 91 37 -17 110 -5 -16 0 89 -89 60 0 -29 0 -9 -14 0 -23 37
2016E 98 41 -17 121 -2 -18 0 101 -85 60 0 -25 0 -12 -18 0 -30 46
Source: Company, J.P. Morgan estimates.
Table 27: Ratio Analysis US$mn Ratio Analysis Gross Margin EBITDA margins (excl vessel sales) EBIT margins (excl vessel sales) PBT margins Reported PATMI margins Growth Revenue Gross Profit EBITDA (excl vessel sales) EBIT (excl vessel sales) Profit Before Tax PATMI Leverage Ratios Net debt/equity (%) Net Debt/EBITDA Net Debt/EBIT EBITDA / Interest expense (x) EBIT / Interest expense (x) Total debt/equity (%) ROAE ROCE (NOPAT/Avg CE) ROA
2011 32%
2012 28%
2013 35%
2014E 40%
2015E 43%
2016E 44%
33% 14% 20% 19%
34% 15% 22% 24%
37% 22% 31% 34%
42% 25% 34% 34%
43% 29% 35% 35%
44% 30% 35% 35%
38% 23% 43% 47% 54% 74%
29% 59% 40% 82% 85% 76%
22% 41% 40% 41% 33% 24%
26% 36% 30% 45% 29% 29%
8% 9% 11% 11% 8% 8%
125% 5.8 12.7 3.9 1.8 135% 17% 5% 6%
61% 3.7 6.2 4.7 2.8 78% 19% 7% 8%
83% 4.2 7.0 6.8 4.1 99% 17% 7% 7%
62% 2.8 4.2 6.2 4.1 82% 19% 9% 9%
43% 2.1 3.1 6.0 4.0 69% 18% 9% 9%
148% 8.4 19.0 3.0 1.3 156% 11% 4% 4%
Source: Company, J.P. Morgan estimates.
19
Ajay Mirchandani (65) 6882-2419 [email protected]
Asia Pacific Equity Research 08 August 2014
Company Description Radiant star in the OSV space Pacific Radiance is an owner and operator of offshore vessels and also provides subsea services, marine equipment as well as project logistics to oil and gas companies. The company has seen phenomenal growth since its incorporation in 2006 - from a humble fleet of 9 offshore vessels at the end of 2006, it now operates a diverse fleet of 133 vessels such as Anchor Handling Tug Supply vessels, Platform Supply Vessels, Ocean Tugs and barges as well as Dive Support Vessels. Besides having over 60 directly owned vessels in its fleet, the company also controls over 60 Malaysian and Indonesian flagged vessels through JVs and associates – Alam Radiance (L), PT Jawa and PT Logindo – dedicated for operations in Malaysia and Indonesia. Building new capabilities through a new marine equipment fabrication facility and ship repair yard Slated to be completed by 2015, the Group's ship repair yard will allow the Group to perform a greater array of repair activities, undertake repair jobs for third party vessels as well as reduce the repair downtime for PACRA's fleet. Through the new marine equipment fabrication facility completed by 2014, the Group will enjoy added commercial flexibility as its vessels can be modified at short notice to take on highmargin, ad-hoc assignments when vessels with the required specifications are not available in the market.
Business segments Pacific Radiance classifies its business in 3 segments a) Offshore Support Services Business b) Subsea Business c) Complementary Businesses: Figure 27: Pacific Radiance Segments
Source: Company reports.
20
Asia Pacific Equity Research 08 August 2014
Ajay Mirchandani (65) 6882-2419 [email protected]
Offshore Support Services Business: This segment commenced operations in 2002 through the provision of ship chartering services for offshore vessels in the oil and gas industry. As of 18 October 2013, the division has evolved to become an owner and operator of a 133-strong fleet of 62 wholly owned vessels and 71 jointly owned vessels inclusive of Offshore Support Vessels (OSV), Diving Support Vessels (DSV), Special Carrier Vessels (SCV), Accommodation Work Barges (AWB) and tugs and barges operating globally. Subsea Business: 2011 marked the Group’s foray into the Subsea Business upon the receipt of 2 DSVs. It operates primarily in Asia and Australia proffering Inspection, Repair and Maintenance (IRM) services in addition to light construction work. Complementary Businesses: The Group entered into the Project Logistics Business (2007) and Marine Equipment Business (2009) through acquisitions. The former takes on niche pipeline logistics and other transport solutions projects while the latter focuses on the design, fabrication, servicing and leasing of a host of marine and coiled tubing equipment. Figure 28: Revenues by segments
Figure 29: Revenues by geography
Figure 30: Profit before tax by segments
%
%
%
Compleme ntary business 8% Subsea Business 27%
Source: Company Reports
Offshore Support Services Business 65%
Australia 7%
South America 8%
Compleme ntary business -1% Subsea Business 29%
Others 0% Asia 69%
Africa 16%
Offshore Support Services Business 70% Source: Company Reports
Source: Company Reports
Offshore Support Services Business The Offshore Support Services Business has roots dating back to 2002 when the company first started offering ship chartering services through Strato Maritime Services. It has since grown to become a sizeable fleet of 133 vessels and rakes in revenue primarily from chartering these offshore vessels. In addition to the charter revenue, the company also derives revenue from the provision of ship management services and ship agency services. Remains the major source of revenue and profits for Pacific Radiance Offshore support services business contributes the highest share of revenue and profits to Pacific Radiance (65% and 70% respectively in 2013). Figure 31: Offshore Support Services Revenue and PBT Margins 120
79
80 60
110
37%
100
109 41%
34%
27%
57
40 20 0 2010
2011 Revenue
2012
45% 40% 35% 30% 25% 20% 15% 10% 5% 0%
2013
PBT Margin
Source: Company reports. 21
Ajay Mirchandani (65) 6882-2419 [email protected]
Asia Pacific Equity Research 08 August 2014
One of the youngest fleets globally Pacific Radiance has one of the youngest fleets globally with an average age of ~4 years juxtaposed to a global average of 7 years. The youth of its fleet confers greater reliability, higher utilization rates with less downtime for repair and maintenance as well as lower maintenance costs, thus making it a preferred choice for customers. Pacific Radiance has one of the youngest fleets globally with an average age of ~4 years vs. global average of 7 years.
Figure 32: Average fleet age of global OSV players. 14 12 10 8 6 4 2 0
4
4
5 5.1 4 4.5 4.5 4.8
7.5 7.5 8 6.5 6.5 7
8 8.5
9.5 10 10
11.5 12 12
Source: Icon Offshore Prospectus.
Diversified fleet consisting of variety of OSVs As of 18 October 2013, the well-diversified fleet comprises 22 Offshore Support Vessels (OSV) consisting of 6 Anchor Handling Tug Supply (AHTS) vessels, 6 Anchor Handling Tugs (AHT), 4 Platform Supply Vessels (PSV), 4 Multi-Purpose Support Vessels (MPSV), 2 Maintenance Work Vessels (MWV) as well as 3 AWBs, 3 SCVs, 2 DSVs, and 32 Tugs and Barges. The range of capabilities afforded by these vessels extends throughout the oil and gas project life cycle and allows PACRA to meet the multi-faceted needs of its clients. The vessels currently operate in Asia, South America, Africa and Australia through various operating subsidiaries and associated companies. Figure 33: Fleet mix No. of vessels 35
32
30 25 20 15 10 5
4
6
6
4
2
3
MWVs
AWBs
3
2
SCVs
DSVs
0 MPSVs Source: Company reports.
22
AHTs
AHTS
PSVs
Tugs & Barges
Ajay Mirchandani (65) 6882-2419 [email protected]
Asia Pacific Equity Research 08 August 2014
Figure 34: Oil and Gas Project Life Cycle and PACRA scope of operations
Source: Company reports.
23
Asia Pacific Equity Research 08 August 2014
Ajay Mirchandani (65) 6882-2419 [email protected]
Table 28: Offshore Support Vessels No. 1 2 3 4 5 6 7 8 9 10 11 12 13 14 15 16 17 18 19
Vessel type MPSV MPSV MPSV MPSV AHT AHT AHT AHT AHT AHT AHTS AHTS AHTS AHTS AHTS AHTS PSV PSV PSV
Name/Description of vessel Crest Radiant 1 Crest Radiant 3 Crest Radiant 5 Crest Radiant 7 Crest Spartan 1 Crest Spartan 2 Crest Spartan 3 Crest Spartan 8 Crest Titan 2 Crest Apache Crest Amethyst Crest Tourmaline Rawabi 9 Rawabi 10 Crest Imperial Crest Olympus Crest Mariner 1 Crest Mariner 2 Crest Alpha 1
20
PSV
Crest Aries 1
21 22
MWV MWV
Crest Nautilus 1 Crest Nautilus 2
Specifications 3,200 BHP 3,200 BHP 3,200 BHP 3,200 BHP 4,400 BHP 4,400 BHP 4,400 BHP 4,400 BHP 5,150 BHP 5,150 BHP 5,150 BHP 5,150 BHP 6,000 BHP 6,000 BHP 8,200 BHP 12,000 BHP 3000 DWT 3000 DWT 3000 DWT 3,500 DWT/ diesel electric drive 120 men, 40 ton crane 120 men, 40 ton crane
Class BV BV BV BV BV BV BV BV ABS ABS ABS ABS ABS ABS ABS ABS ABS ABS ABS
Year delivered 2008 2008 2009 2010 2009 2009 2010 2010 2010 2013 2012 2012 2013 2013 2013 2011 2011 2011 2013
Flag Singapore Singapore Singapore Singapore Singapore Singapore Singapore Singapore Singapore Singapore Singapore Singapore
ABS
2013
Singapore
ABS ABS
2010 2010
Singapore Singapore
Specifications 12 men saturation dive system, 100 ton AHC subsea crane 12 men saturation dive system, 100 ton AHC subsea crane
Class
Year delivered
Flag
ABS
2011
Singapore
ABS
2011
Singapore
Singapore Singapore Singapore Singapore Singapore
Source: Company reports. As of 18 October 2013.
Table 29: Diver Support Vessels No.
Vessel type
Name/Description of vessel
1
DSV
Crest Odyssey 1
2
DSV
Crest Odyssey 2
Source: Company reports .As of 18 October 2013.
Table 30: AWBs No. 1 2
Vessel type AWB AWB
3
AWB
Name/Description of vessel Crest Support 1 Crest Provider/Warehouse AWB Crest Support 5
Specifications 120 men 200 men, 40 ton crane, 70 ton crane 200 men, 50 ton crane
Class BV ABS
Year delivered 2008 2011
Flag Panama Panama
BV
2009
Panama
Specifications 6,866 DWT 6,866 DWT 105,351 DWT
Class ABS ABS LR
Year delivered 2012 2012 1995
Flag Singapore Singapore St. Kitts & Nevis
Specifications 2,000 BHP 2,000 BHP 1,074 DWT 2,032 BHP 3,200 BHP 3,200 BHP 3,200 BHP 3,200 BHP 3,200 BHP 3,500 BHP 5,000 BHP
Class BV BV ABS NKK BV BV BV ABS ABS BV ABS
Year delivered 2006 2009 2010 2004 2008 2008 2009 2011 2012 2006 2009
Flag Singapore Singapore Singapore Singapore Singapore Singapore Singapore Singapore Brazil Singapore Singapore
Source: Company reports. As of 18 October 2013.
Table 31: SCVs No. 1 2 3
Vessel type SCV SCV SCV
Name/Description of vessel Crest Angelica Crest Zapata Duta Pacific -FSO
Source: Company reports. As of 18 October 2013.
Table 32: Tugs and Barges No. 1 2 3 4 5 6 7 8 9 10 11
24
Vessel type Utility Supply Vessel Utility Supply Vessel Utility Supply Vessel Ocean Towing Tug Ocean Towing Tug Ocean Towing Tug Ocean Towing Tug Ocean Towing Tug Ocean Towing Tug Ocean Towing Tug Ocean Towing Tug
Name/Description of vessel Crest Voyager Crest Adventurer Crest Transporter/Landing Craft Crest Atlas Crest Gold 1 Crest Gold 2 Crest Jade 1 Crest Opal Crest Crystal Crest Ocean Crest Star 2/Azimuth Stern Drive Tug
Asia Pacific Equity Research 08 August 2014
Ajay Mirchandani (65) 6882-2419 [email protected]
12
Ocean Towing Tug
13 14 15 16 17 18 19 20 21 22 23 24 25 26 27 28 29 30
Offshore Barge Offshore Barge Offshore Barge Offshore Barge Offshore Barge Offshore Barge Offshore Barge Offshore Barge Offshore Barge Offshore Barge Offshore Barge Offshore Barge Offshore Barge Offshore Barge Offshore Barge Offshore Barge Offshore Barge Offshore Barge
31
Offshore Barge
32
Offshore Barge
Crest Star 3/Azimuth Stern Drive Tug Crest 148 Crest 250 Crest 2501 Crest 251 Crest 255 Crest 257C Crest 259 Crest 259A Crest 282 Crest 289 Crest 287 Crest 2801 Crest 2802 Crest 2821 Crest 2822 Crest 2823 Crest 2825 Crest 300/Deck Cargo/Tank Barge Crest 301/Deck Cargo/Tank Barge Westsea 95/Deck Cargo/Tank barge
5,000 BHP
ABS
2009
Singapore
960 DWT 5,300 DWT 5,300 DWT 5,300 DWT 5,300 DWT 5,300 DWT 5,300 DWT 5,300 DWT 6,000 DWT 6,000 DWT 6,000 DWT 6,000 DWT 6,000 DWT 8,490 DWT 8,490 DWT 8,490 DWT 8,490 DWT 9,000 DWT
ABS BV ABS BV BV BV BV ABS BV BV BV BV BV ABS ABS ABS ABS ABS
2010 2008 2012 2008 2006 2010 2007 2008 2006 2008 2010 2011 2011 2010 2010 2013 2013 2010
Singapore Singapore Brazil Singapore Singapore Singapore Singapore Singapore Singapore Singapore Singapore Singapore Singapore Singapore Singapore Singapore Singapore Singapore
9,000 DWT
ABS
2010
Singapore
13,000 DWT
ABS
2011
Singapore
Source: Company Reports. As of 18 October 2013.
Figure 35: Fleet specification (all except DSVs, AWBs and MWVs)
Figure 36: Fleet specifications (DSVs, AWBs and MWVs)
Cumulative BHP
Cumulative no. of men
SCVs, 119083, 31%
MPSVs, 12800, 4%
AHTs, 27900, 7%
DSVs, 24, 3%
AHTS, 42500, 11%
MWVs, 240, 31%
PSVs, 12500, 3% Tugs & Barges, 169626, 44%
AWBs, 520, 66% Source: Company reports.
Source: Company reports.
Figure 37: Fleet utilization rates 100% 80%
87% 63% 52%
60%
54% 54%
48%
33%
40%
84% 83%
79%
77%
63% 50%
32%
55% 28%
20% 0%
0%
0%
0%
2010
0%
2011 OSVs
DSVs
2012 AWBs
Tugs & Barges
2013
SCVs
Source: Company reports.
25
Ajay Mirchandani (65) 6882-2419 [email protected]
Asia Pacific Equity Research 08 August 2014
Competitive edge in fleet expansion To maintain competitive edge, Pacific Radiance acquires offshore vessels by way of a collaborative ship-building process pursuant to which it supervises third party shipyards in the design and construction of market relevant support vessels. Through this, the company has been able to acquire vessels at lower construction costs vis-àvis acquiring similar vessels in the open market from third party shipbuilders or traders. Such a business model also accords greater flexibility in building new vessels since PACRA is able to respond swiftly to the changing market trends and customer requirements by having a team on-site to customize accordingly and supervise the construction of newbuilds. Figure 38: Fleet expansion strategy Pacific Radiance manages construction of OSVs at shipyards thereby better managing the cost of vessels.
Source: Company reports.
As seen in the table below, Pacific Radiance has 19 vessels under construction with deliveries scheduled in 2014 and 2015. Table 33: Under Construction No. 1 2 3 4 5 6 7 8 9 10 11 12 13 14 15 16 17 18 19
Vessel Type MWV MWV PSV PSV PSV(2) PSV(2) PSV PSV AHTS(2) AHTS(2) AHTS(3) AWB ROV support vessel PSV PSV AHTS(2) AHTS(2) PSV PSV
Specifications 208 men/64 ton crane 204 men/64 ton crane 4,000 DWT 4,000 DWT 4,000 DWT 4,000 DWT 4,900 DWT/Diesel electric drive 4,900 DWT/Diesel electric drive 6,000 BHP 6,000 BHP 16,000 BHP 450 pax/300 ton crane Diesel electric drive, 30 ton AHC subsea crane 4,000 DWT/Diesel electric drive 4,000 DWT/Diesel electric drive 6,000 BHP 6,000 BHP 4000 tonnes 4000 tonnes
Class ABS ABS BV BV BV BV ABS ABS BV BV ABS ABS BV DNV DNV BV BV
Year of delivery 2013 2014 2014 2014 2014 2014 2014 2014 2014 2014 2014 2014 2014 2015 2015 2015 2015 4Q15 4Q15
Source: Company reports.
JVs and associates grant access to cabotage protected markets.
Geographical Expansion into Malaysia and Indonesia via JVs In 2010, Pacific Radiance entered into a joint venture with Alam Maritim (Malaysia listed OSV player), and acquired a 49.0% stake in Alam Radiance (L) providing the company greater access to the Malaysian market by allowing it to own Malaysian flagged offshore vessels through Alam Radiance (L) and charter these vessels to IOCs and NOCs in Malaysia. Alam Radiance (L) owns and operates 2 AWBs. Malaysia remains a cabotage protected market, and the joint venture in Malaysia allows Pacific Radiance to better adhere to the criteria set out by these cabotage laws.
26
Ajay Mirchandani (65) 6882-2419 [email protected]
Asia Pacific Equity Research 08 August 2014
Table 34: Vessels owned by Alam Radiance (L) No. 1 2
Name/Description of vessel Setia Station 1/AWB Setia Station 2/AWB
Specifications 300 men, 300 ton crane 402 men, 300 ton crane
Classification society ABS ABS
Year delivered 2009 2009
Source: Company reports. As of 18 October 2013.
In 2011, Pacific Radiance acquired 49% stakes in PT Jawa and PT Logindo, granting it access to the cabotage protected Indonesian market with over 65 Indonesian flag offshore vessels. PT Logindo was listed in December 2013 on the Jakarta Stock Exchange with Pacific Radiance’s stake reduced to 35%. Figure 39: Share of results of JVs 9 8 7 6 5 4 3 2 1 0
8 6 4
4 2 0
0
0 2010
2011
2012
Alam Radiance (L) - under OSV division
2013
PT Logindo - under OSV division
Source: Company reports, 2013 number is JPM estimate.
Table 35: PT Jawa Fleet No. 1 2 3 4 5 6 7 8 9 10 11
Name/Description of vessel Crest Omega 1/Tug Crest Omega 2/Tug Crest Omega 3/Tug Crest Onyx/AHTS Crest Ruby/AHTS Crest 180/Flat Top Barge Crest 253/Flat Top Barge Crest 252/Flat Top Barge Crest 256/Flat Top Barge Crest 258C/Flat Top Barge Ismaya/AWB (converted)
Specifications 3,200 BHP 3,200 BHP 3,200 BHP 5,150 BHP 5,150 BHP 2,159 DWT 5,300 DWT 5,300 DWT 5,300 DWT 5,300 DWT 12,381 DWT
Classification society BV and BKI BV and BKI BV and BKI ABS and BKI ABS and BKI BKI GL and BKI BV and BKI BV and BKI BV and BKI ABS and BKI
Year delivered 2007 2007 2008 2012 2008 2006 2005 2005 2006 2010 2010
Source: Company reports. As of 18 October 2013.
Figure 40: PT Jawa fleet mix No. of vessels 6 5 5 4 3 3 2 2 1 1 0 AHTS
Tug
Flat top barge
AWB
Source: Company reports.
27
Ajay Mirchandani (65) 6882-2419 [email protected]
Asia Pacific Equity Research 08 August 2014
Figure 41: PT Jawa fleet breakdown by age
Figure 42: PT Jawa fleet breakdown by size
No. of vessels
Cumulative BHP
<5 years, 3, 27%
Tug, 9600, 48%
AHTS, 10300, 52%
5 to 10 years, 8, 73% Source: Company reports.
Source: Company reports.
Table 36: PT Logindo Fleet No. 1 2 3 4 5 6 7 8 9 10 11 12 13 14 15 16 17 18 19 20 21 22 23 24 25 26 27 28 29 30 31 32 33 34 35 36 37 38 39 40 41 42 43 44 28
Name/Description of vessel Logindo Overcomer/AHTS Logindo Braveheart/AHTS Logindo Stature/AHTS Logindo Destiny/AHTS Logindo Stout/AHTS Logindo Energy/AHTS Logindo Vigilant/AHT Logindo Synergy/AHT Logindo Progress/AHT Servewell Sincere/PSV Logindo Radiance/AWB Logindo Reliance/AWB Logindo Pelican/Landing Craft Logindo Liberty/Landing Craft LSM Elang Laut/Landing Craft Logindo Joyful/Landing Craft Logindo Valiant/Landing Craft Logindo Blessing/Landing Craft Logindo Steadfast/Landing Craft Logindo Prosper/Landing Craft Logindo Hopeful/Landing Craft LSM Spearhead/Crew Boat LSM Servewell/Crew Boat Logindo Splendid/Crew Boat LSM Sparrow/Crew Boat Logindo Gladness/Crew Boat Servewell Steward/Crew Boat LSM Dunamos/Utility Vessel LSM Nusantara/Utility Vessel LSM Provider/DSV Logindo Navigator/Tug Logindo Glory/Tug Logindo Mighty/Tug Logindo Worthy/Tug Logindo Warrior/Tug Logindo Alpha/Tug Logindo Victory/Tug Logindo Power/Tug Servewell Eager/Tug Logindo Wisdom/Tug Logindo Courage/Tug Logindo Favor/Tug Logindo Graceful/Tug Servewell Stable/Tug
Specifications 5,150 BHP 5,150 BHP 5,150 BHP 5,150 BHP 8,000 BHP 12,240 BHP 3,200 BHP 3,800 BHP 4,000 BHP 4,750 BHP 150 men/70 ton crane 150 men/70 ton crane 540 BHP 640 BHP 700 BHP 730 BHP 730 BHP 730 BHP 740 BHP 810 BHP 1,000 BHP 2,040 BHP 2013 BHP 2,400 BHP 2,900 BHP 3,000 BHP 3,900 BHP 1,696 BHP 2,000 BHP 2,060 BHP 480 BHP 900 BHP 1,000 BHP 1,000 BHP 1,000 BHP 1,000 BHP 1,020 BHP 1,080 BHP 1,080 BHP 1,100 BHP 1,200 BHP 1,200 BHP 1,280 BHP 2,560 BHP
Classification society BKI BKI BKI BKI BKI BKI BKI BKI BKI BKI BKI BKI BKI BKI BKI BKI BKI BKI BKI BKI BKI BKI BKI BKI BKI BKI BKI BV BV BKI BKI BKI BKI BKI BKI BKI BKI BKI BKI BKI BKI BKI BKI BKI
Year delivered 2008 2008 2011 2010 2008 2012 2007 2006 2005 2003 2008 2008 2003 2002 2005 2005 2005 2006 2004 2003 2006 2006 2007 1988 1993 1990 2009 2009 2008 2005 2006 1992 2001 2003 2003 2006 1993 2000 2008 2002 2005 2005 2005 1998
Asia Pacific Equity Research 08 August 2014
Ajay Mirchandani (65) 6882-2419 [email protected]
45 46 47 48 49 50 51 52 53 54 55 56 57 58
Servewell Steady/Tug Logindo Faithful/Tug LSM – 01/Barge LSM – 02/Barge LSM – 03/Barge LSM – 04/Barge LSM – 05/Barge LSM – 06/Barge LSM – 07/Hopper Barge LSM – 08/Hopper Barge LSM – 09/Hopper Barge LSM – 10/Hopper Barge LSM – 11/Hopper Barge LSM – 12/Hopper Barge
2,560 BHP 3,150 BHP 639 DWT 639 DWT 639 DWT 639 DWT 650 DWT 651 DWT 676 DWT 676 DWT 676 DWT 676 DWT 676 DWT 676 DWT
BKI BKI BKI BKI BKI BKI BKI BKI BKI BKI BKI BKI BKI BKI
1995 2002 1996 2002 1993 1997 1995 2002 2010 2010 2010 2010 2011 2011
Source: Company reports. As of 18 October 2013.
Figure 43: PT Logindo fleet mix No. of vessels 18 16 14 12 10 8 6 4 2 0
16
9 6
6 3 1
AHTS
AHT
PSV
2
2
AWB
Landing craft
Crew boat
6
6
Barge
Hopper barge
1
Utility vessel
DSV
Tug
Source: Company reports.
Figure 44: PT Logindo fleet breakdown by age
Figure 45: PT Logindo fleet breakdown by size (non-barge)
Figure 46: PT Logindo fleet breakdown by size (barges)
No. of vessels
Cumulative BHP
Cumulative DWT
>10 years, 23, 40%
Tug, 21610, 20%
<5 years, 9, 15%
AHTS, 40840, 38%
Hopper barge, 4056, 51%
Barge, 3857, 49%
DSV, 2060, 2% Utility vessel, 3696, 4%
Crew boat, 16253, 15%
5 to 10 years, 26, 45%
Source: Company reports.
Landing craft, 6620, 6%
AHT, 11000, 10% PSV, 4750, 5%
Source: Company reports.
Source: Company reports.
Figure 47: Offshore Support Services business margins (excl. vessel gains & JV/associate results) 50%
41%
30% 20%
27%
35%
34%
31% 33%
40%
24%
18%
16%
10%
15%
17% 7%
3%
2%
0% -10%
-10%
-20% 2010
2011 GP margin
EBITDA margin
2012 EBIT margin
2013 PBT margin
Source: Company reports
29
Ajay Mirchandani (65) 6882-2419 [email protected]
Asia Pacific Equity Research 08 August 2014
Subsea Business A fledgling division ready to make waves PACRA’s subsidiary, Crest Subsea International is responsible for the provision of its subsea services. It owns CSI Offshore which owns and operates the 2 DSVs received in 2011 - the year which marks the birth of PACRA's subsea business. In the following year, Crest Subsea International acquired an 80% stake in Offshore Subsea Services - which in turn owns 2 Indonesian subsidiaries, PT Subsea and PT Marine Engineering – to expand PACRA’s subsea IRM and engineering services. The Subsea division mainly provides services comprising: a)
Subsea and topside inspection
b) Platform inspection and survey c)
Construction support survey
d) Pipeline/cable route survey e)
Drill site survey
f)
Installation engineering activities
Revenue from Subsea Business comes from the chartering of Diver Support Vessels (DSV) and the provision of IRM and engineering services. Table 37: Diver Support Vessels Name/Description of vessel
Specifications 12 men saturation dive system, 100 ton AHC subsea crane 12 men saturation dive system, 100 ton AHC subsea crane
Crest Odyssey 1 Crest Odyssey 2
Class
Year delivered
ABS
2011
ABS
2011
Source: Company reports.
Figure 48: Subsea Business Revenue and PBT Margins 50 45 40 35 30 25 20 15 10 5 0
45 35% 0%
5% 17 11 -47%
0 2010
2011 Revenue
2012
40% 30% 20% 10% 0% -10% -20% -30% -40% -50% -60%
2013
PBT Margin
Source: Company reports.
Going deeper to expand As part of PACRA's plans to grow its Subsea Business, it has ordered a Remotely Operated Vehicle (ROV) capable of supporting deepwater IRM activities and is scheduled for delivery in 2H2014. Acquiring such capability would allow the Group to undertake more technically complex projects, build up its subsea expertise and gain a foothold in the market which would translate into it winning a larger volume of subsea projects in the long run. The Group also expects to acquire more vessels in the foreseeable future with the expansion of its subsea operations. Table 11: ROV Name/Description of vessel ROV Source: Company reports.
30
Specifications Diesel Electric Drive, 30 ton AHC Subsea Crane
Class BV
Estimated year of delivery 2014
Ajay Mirchandani (65) 6882-2419 [email protected]
Asia Pacific Equity Research 08 August 2014
Figure 49: Subsea business margins (excl. vessel gains & JV/associate results) 52%
60% 40%
25%
33%
20%
7%
40% 35%
5%
0% -20%
-13%
-6%
-40%
-37%
-60% 2011 GP margin
-47%
2012 EBITDA margin
EBIT margin
2013 PBT margin
Source: Company reports.
Complementary Businesses Milking the value chain Revenue for PACRA’s complementary businesses stem from 2 sources: the Marine Equipment business and the Project Logistics business established in 2009 and 2007 respectively through a series of acquisitions. The Marine Equipment business deals with a) the design and supply of deck equipment such as winches and cranes through PACRA’s 80% owned subsidiary, Titan Offshore, and b) the rental and maintenance of deck equipment by 60% owned subsidiary, Fleetwinch Control. This segment fabricates the parts for deck equipment at third party manufacturers outside of Singapore and the deck equipment can either be assembled by third parties in the PRC or in-house at PACRA’s own premises in Singapore thus granting greater control over its supply chain. The Project Logistics Business is carried out through its subsidiary Consolidated Pipe Carriers which was acquired in 2007 (30% stake) and fully owned by 2013. Over the past 5 years, Consolidated Pipe Carriers has executed projects in Australia, Brazil, Indonesia, Japan, Malaysia, Myanmar, Philippines, Papua New Guinea and Qatar. These projects included the transportation of pipe joints for onshore, shallow water and deepwater pipe-laying campaigns, the project shipment of sophisticated subsea structures into the oil or gas field for installation by offshore construction vessels as well as the delivery of port cranes and other project-type cargo for non-oil and gas clients. Pacific Radiance also invested in 2 SCVs to improve project logistics delivery capability to offshore construction vessels. Ship repair yard in the works On 20 January 2014, Pacific Radiance acquired an additional 20% equity interest in its 40% owned joint venture company, CrestSA Marine & Offshore Pte Ltd for a cash consideration of US$16,000. Consequent to the acquisition, CrestSA became a subsidiary of the Group and is responsible for developing the Group’s investment in a ship repair yard to be readied by 2015. The ship repair yard has a 180-metre waterfront and is leased from Jurong Town Corporation until 2037. Once operational, the ship repair yard will ensure reduced downtime for the repair and maintenance of PACRA's vessels hence maximizing their possible utilization rates. On top of that, vessels can be quickly modified at short notice to capitalize on ad-hoc, high margin assignments if customer demands cannot be met by the existing pool of vessels in the market. 31
Ajay Mirchandani (65) 6882-2419 [email protected]
Asia Pacific Equity Research 08 August 2014
Figure 50: Complementary Business Revenue and PBT Margins 16 14 12 10 8 6 4 2 0
100%
14
52%
50% -3% -81%
5
-150% -200%
-222% 2010
2011
-250%
2012
Revenue
-50% -100%
4
3
0%
2013
PBT Margin
Source: Company reports.
Figure 51: Complementary businesses margins (excl. vessel gains & JV/associate results) 60% 50% 40% 30% 20% 10% 0% -10% -20% -30%
53%
17%
49%
15% 13% 13%
7% 5% 5%
4% 3% 3%
-16%-17%-17% 2010
2011 GP margin
EBITDA margin
2012 EBIT margin
2013 PBT margin
Source: Company reports.
Business Strategies and Future Plans Scale Up Operations – Expansion of fleet Pacific Radiance currently has ~15 vessels under construction including PSVs, AWBs and AHTS vessels. The company also intends to acquire new vessels that are specialised for the Subsea Business. Scale Up Synergies – Expansion of our Complementary Businesses The company's ship repair yard is expected to be operational by the middle of 2015 and marine equipment fabrication facility is set to be ready by 2014. The company intends to focus on streamlining the operations of Project Logistics Business and focus on projects which are profitable for this business segment. Growth through Joint Ventures, Mergers or Acquisitions The company intends to seek suitable opportunities to grow, consolidate and build up the scale of its businesses through mergers and acquisitions in line with its plans to establish presence overseas in high growth markets. Pacific Radiance also intends to expand its existing operations and/or establish a presence in various countries to capture opportunities in growth markets through strategic partnerships with joint venture partners and key customers with strong local knowledge in growth markets.
32
Asia Pacific Equity Research 08 August 2014
Ajay Mirchandani (65) 6882-2419 [email protected]
Associates of Pacific Radiance Pacific Radiance operates in Indonesia through Jakarta listed PT Logindo Samudrakumar and in Malaysia through a JV with Alam Maritim. Table 38: List of associates Name
Place of Business
Alam Radiance (L)
Malaysia
Effective ownership 49%
Alam Radiance (M)
Malaysia
50%
CA Offshore Investments
BVI
50%
CrestSA Marine & Offshore
Singapore
60%
PT Jawa Tirtamarin
Indonesia
49%
PT Logindo Samudramakumar Supreme Radiance
Indonesia
35%
Singapore
40%
Comments The other shareholder of this Associated Company is Alam Maritim (L) Inc. (51%). Alam Maritim (L) Inc is 100% owned by Alam Maritim Resources Berhad, which is listed on Bursa Malaysia. The other shareholder of this Associated Company is Alam Maritim (M) Sdn Bhd (50%). Alam Maritim (M) Sdn Bhd is 100% owned by Alam Maritim Resources Berhad, which is listed on Bursa Malaysia. The other shareholder of this Associated Company is Premium Prize Limited (50%). Premium Prize Limited is 100% owned by AVIC International Holdings Limited, which is listed on the Hong Kong Stock Exchange. The other shareholder of this Associated Company is Soon Aik Marine Engineering (Pte.) Ltd. The shareholders of Soon Aik Marine Engineering (Pte.) Ltd. are Lee Guat Wah (49.2%) and Ang Thiam Hock (50.8%). The other shareholder of this Associated Company is PT Karya Investindo Tunggal. The shareholders of PT Karya Investindo Tunggal are Eka Tjandranegara (96.5%) and 2 other minority shareholders (3.5%). The other shareholders of this Associated Company are Eddy Kurniawan Logam, Rudy Kurniawan Logam and Merna Logam. The other shareholder of this Associated Company is Supreme Oilfield Services Pte Ltd. The shareholders of Supreme Oilfield Services Pte Ltd are Kwek Kiang Woo John (78.3%) and Bohn Teresina Philomena (21.7%).
Source: Company reports.
33
Ajay Mirchandani (65) 6882-2419 [email protected]
Asia Pacific Equity Research 08 August 2014
Financial performance Group performance (a) 2012 results a.
Revenue increased in 2012 driven by the Offshore Support Services and Subsea businesses. Group revenue went up 38% y/y from US$95mn to US$131mn. The expanded fleet of the Offshore Support Services and 2 DSVs for the Subsea business brought in an additional US$31mn and US$6mn respectively.
b. Net profit improved in 2012 with better sales and JV results. Net profit for 2012 saw a 72% growth y/y from US$18mn to US$32mn. Gross profit increased correspondingly with sales and added almost US$7mn. The Group’s JVs also posted strong gains, rising by about US$6mn from US$2mn to US$8mn as Alam Radiance (L) securing a new contract and PT Logindo earning more with an enlarged fleet (from 47 to 54 vessels). (b) 2013 results a.
Revenue spiked in 2013 as the Subsea and Complementary businesses reeled in larger contributions. Total revenue rose 29% y/y from US$131mn to US$169mn. While revenue from the Offshore Support Services business came in flat, sales from the Subsea and Complementary businesses added US$28mn and US$11mn to PACRA's topline respectively.
b. Net profit jumped significantly in 2013 as business largely improved across the board. Net profit enjoyed a 79% growth y/y from US$32mn to US$57mn. Along with starkly improved results from the Subsea and Complementary businesses, the Group’s JVs' results grew substantially by 59% or US$4.6mn as the JVs - PT Logindo in particular - expanded their scale of operations with larger fleets. The Group's associates also reversed their losses of US$5mn from a year ago to rake in US$1mn profits. (c) 1Q2014 results a.
In 1Q2014, the new OSVs received in late 2013 ushered in strong revenue growth. Group revenue saw a healthy 33% y/y from US$32mn to US$42mn. Utilization rates for existing vessels and new vessels bumped up the Group’s topline for the quarter. The Subsea business also enjoyed a 13% or US$1mn increase due to better charter rates but the segment’s performance was partially weighed down but poor performance from the Complementary businesses with the Marine Equipment business securing lesser contracts.
b. 1Q2014 net profit rose sharply with better gross profit margins. Net profit for the most recently reported quarter improved significantly by 110% from US$8mn to US$17mn. Better utilization rates for the Group's Offshore Support Services fleet boosted the bottom line vs.1Q2013. The bottom line was further augmented by the newly delivered vessels which were more sophisticated and could thus 34
Asia Pacific Equity Research 08 August 2014
Ajay Mirchandani (65) 6882-2419 [email protected]
command higher premiums hence increasing the Group's profitability. This is evidenced by the Group’s gross profit which rose 91% or US$8mn. Figure 52: Group revenue, net profit and EBIT margins US$mn, %
180 160 140 120 100 80 60 40 20 0
25%
22%
20%
15%
14%
15% 169
10%
131 95 18 2011
0%
2012 Revenue
5%
57
32 2013
Net profit
EBIT margin
Source: Company reports. EBIT margin excludes vessel gains and JV/associate results.
Figure 53: 2011 segmental revenue breakdown
Figure 54: 2012 segmental revenue breakdown
Figure 55: 2013 segmental revenue breakdown
US$mn, %
US$mn, %
US$mn, %
Complementary business, 5 , 5%
Subsea Business, 17 , 13%
Subsea Business, 11 , 12%
Complementary business, 4 , 3%
Offshore Support Services Business, 79 , 83%
Source: Company reports.
Complementary business, 14 , 8% Subsea Business, 45 , 27%
Offshore Support Services Business, 109 , 65%
Offshore Support Services Business, 110 , 84%
Source: Company reports.
Source: Company reports.
Offshore Support Services segment performance 2012 revenue New vessels from the Offshore Support Services segment experienced higher utilization rates and some of the vessels boasted larger sizes and better specifications that allowed them to charge higher charter rates. On the whole, the broad improvement in the oil and gas sector led to an increase in demand for offshore vessels and translated into better utilization and charter rates for PACRA's Offshore Support Services business – on top of the new contracts won in the year – bringing revenue up US$31mn to US$109.9mn. 2013 revenue The Offshore Support Services business underwent a transitory phase in 2013 with sales of vessels taking place in the 1st half of the year and the majority of new vessels being delivered in the latter half; the reduction in the number revenuegenerating assets translated to a slight decrease in revenue y/y from US$109.9mn to US$109.3mn.
35
Ajay Mirchandani (65) 6882-2419 [email protected]
Asia Pacific Equity Research 08 August 2014
Figure 56: Offshore Support Services results US$mn 110
120 100 80 60
109
79 57
40
10 15
20
25 26
21 1
38 12
45
45 27
22
38
37 18
17
2
7
0 (5)
(20) 2010
2011 Revenue
GP
2012
EBITDA
EBIT
2013
PBT (pre JV)
PBT
Source: Company reports.
Subsea business segment performance 2012 revenue The delivery of 2 DSVs in 3Q2011 recorded full year contributions in 2012 leading to a rise in revenue by 53% for the Subsea business from US$11mn to US$17mn. 2013 revenue The Subsea division’s fleet of 2 DSVs posted a marked improvement in utilization rates from 54% to 83% (based on 2012 and HY2013 rates). This is a testament of the division’s success in building a track record in the IRM space. Figure 57: Subsea business results US$mn 45
50 40 30 20
23
17
11
10
3
4
1
1
18
16
16
1
0 (2)
(10)
(1)
(20) 2011
(6)
(8)
(8)
2012
Revenue
GP
EBITDA
2013
EBIT
PBT (pre JV)
PBT
Source: Company reports.
Complementary businesses segment performance 2012 revenue Revenue for the Complementary businesses division fell 23% from US$4.6mn to US$3.5mn due to fewer contracts won by the Marine Equipment business. 2013 revenue The consolidation of Consolidated Pipe Carriers’ (CPC) results upon a full takeover in 2013 led to segment revenue for the Group's Complementary business quadrupling to US$14mn with the acquisition alone adding US$8.2mn to the topline. Figure 58: Complementary businesses results US$mn 20 14
15 10 5
3
5 0
2
1
4 1
1
2
0
0
0
0
0
0
0 (5)
(0)
(0) (0) (0) (1)
(4)
(10) 2010
2011 Revenue
Source: Company reports. 36
GP
EBITDA
2012 EBIT
PBT (pre JV)
(8)
2013 PBT
Ajay Mirchandani (65) 6882-2419 [email protected]
Asia Pacific Equity Research 08 August 2014
Company history and structure Industry veteran bringing company to greater heights Pacific Radiance was incorporated on 6 July 2006 and saw a major ownership change on 15 November 2006 when Mr. Pang Yoke Min acquired a majority stake of 90% in the company. Mr. Pang Yoke Min co-founded the Singapore-listed Jaya Holdings Limited in 1981. During his stint as Managing Director at the company, he developed Jaya Holdings to become an established ship owner, builder, repairer and operator. Figure 59: Key milestones
Source: Company reports.
Key events 6 July 2006 – Incorporation of Pacific Radiance Pte. Ltd. 8 July 2006 – Consolidation of Strato Maritime Services, Pacific Crest and Alstonia Offshore under sole ownership of Pacific Radiance. 15 November 2006 – Executive Chairman, Mr. Pang Yoke Min invested in Pacific Radiance by acquiring a 90% stake through YM InvestCo Pte. Ltd. Entered Project Logistics Business
2007 – Foray into Project Logistics Business with a 30% minority stake in the Consolidated Pipe Carriers group. 2009 – Incorporation of wholly-owned subsidiary, Crest Subsea International to lay foundations for Subsea Business in 2011.
Entered Marine Equipment Business
2009 – Vertical expansion into the Marine Equipment Business by acquiring 80% stake in Titan Offshore 2010 – Acquired 60% stake in Fleetwinch Control to add to Marine Equipment Business. 37
Ajay Mirchandani (65) 6882-2419 [email protected]
Asia Pacific Equity Research 08 August 2014
2010 – Acquired 40% stake in CrestSA Marine & Offshore to gain access to a ship repair yard in Singapore. 4 August 2010 – Alam Maritim and Pacific Crest (subsidiary of Pacific Radiance) enter into JV, Alam Radiance (49% stake) to own and operate work barges. Entered Subsea business
2011 – Received delivery of DSVs to mark entry into Subsea business. 2011 – Acquired 49% stake in 2 Indonesian ship-owning and chartering companies, PT Jawa and PT Logindo. 2012 – Expanded Subsea Business by acquiring 80% stake in Offshore Subsea Services which owns 2 operating Indonesian companies, PT Subsea and PT Marine Engineering. 2012 – Established JV, Radiance Catico Offshore (63%) to expand Offshore Support Services Business. Won long term charters with IOCs and NOCs in South America and East Aafrica. Incorporated wholly-owned Brazilian subsidiary, Radiance Offshore Navegacao (Alagoas). 2013 – Acquired remaining share capital to assume full ownership of Consolidated Pipe Carriers. 11 September 2013 – Ordered 2+2 PSVs at a Chinese yard. Delivery of firm units scheduled in 2Q, 3Q 15 22 October 2013 – Pacific Radiance starts IPO process to raise ~US$100mn. 12 November 2013 – Shares start trading on exchange. 17 December 2013 – Company plans to invest US$800mn in next 5 years to expand its fleet. 10 February 2014 – Secures charter contracts worth US$59mn from repeat clients for AHT, AHTS, DSV and FSO. 26 February 2014 – Reports FY13 net income of US$50mn mainly driven by subsea services segment. 1 April 2014 – Secures contract worth US$100mn for its newbuild maintenance work vessel (MWV), the first of 14 newbuilds scheduled for delivery in FY14. The vessel will be chartered for up to 7 years with international oil major. 15 May 2014 – 1Q net income $17.8m vs $8.5m y/y. 19 June 2014 – Wholly-owned subsidiary, Crest Offshore Marine enters JV with Westsea Marine (S) Pte. Ltd. with 50% stake. 25 June 2014 – Enters JV, CR Offshore S.A.P.I. de C.V. (CRO) with Consultoria y Servicios Petroleros engaged in the management and operation of OSVs in Mexico.
38
Asia Pacific Equity Research 08 August 2014
Ajay Mirchandani (65) 6882-2419 [email protected]
Figure 60: PACRA share price performance and key events
6/3/2014
6/10/2014
5/27/2014
5/20/2014
5/6/2014
5/13/2014
4/29/2014
4/8/2014
4/15/2014
4/1/2014
3/25/2014
3/18/2014
3/11/2014
3/4/2014
2/25/2014
2/18/2014
1/28/2014
1/21/2014
1/7/2014
1/14/2014
12/31/2013
12/24/2013
12/17/2013
12/3/2013
12/10/2013
11/26/2013
11/19/2013
11/12/2013
0.6
2/4/2014
26 Feb 2014: FY2013 resultsPATMI rises 76% to US$56.8mn
18 Nov 2013: 3Q2013 resultsPATMI down 48% to US$10.8mn
2/11/2014
0.8
7/8/2014
14 May 2014: 1Q2014 resultsPATMI rises 110% to US$17.8mn
24 Jun 2014: PACRA, CSP set up JV to serve Mexico's OSV sector
1
7/15/2014
10 Feb 2014: Wins US$59mn worth of contracts
7/1/2014
1.2
19 Jun 2014: PACRA, Westsea Marine set up JV to access Australian market
31 March 2014: Secures contract worth up to US$100mn for MWV
6/24/2014
1.4
17 Dec 2013: Company announces plans to invest US$800mn to expand OSV fleet
6/17/2014
11 Dec 2013: JV, PT Logindo listed on the Indonesian stock exchange
4/22/2014
1.6
Source: Bloomberg.
Shareholding and company structure Figure 61: Pacific Radiance ownership Others 22% JP Morgan Chase & Co 2% Yin Min Yong 4% Weng Vai Mok 7%
Yoke Min Pang 65%
Source: Bloomberg. As at 17 July 2014.
Figure 62: Corporate structure
Source: Company reports. 39
Asia Pacific Equity Research 08 August 2014
Ajay Mirchandani (65) 6882-2419 [email protected]
Figure 63: Management reporting structure
Source: Company reports.
Table 39: Board of Directors Name
Age
Position
Date of appointment as director
Mr Pang Yoke Min
63
Executive Chairman
Jan-13
Mr Mok Weng Vai
48
Executive Director and Managing Director (Offshore Support Services Division)
Jul-06
Mr Pang Wei Meng
33
Executive Director and Managing Director (Subsea and Project Logistics Division)
Nov-06
Mr Lau Boon Hwee
50
Executive Director and Managing Director (Shipyard and Marine Equipment Division)
28-Oct-13
Mr Yong Yin Min
61
Non-Executive Director
Nov-06
Mr Ng Tiong Gee
51
Lead Independent Director
28-Oct-13
Ms Ooi Chee Kar
58
Independent Director
28-Oct-13
Mr Goh Chong Theng
57
Independent Director
28-Oct-13
Mr Wong Meng Hoe
65
Independent Director
28-Oct-13
Mr Choo Boon Tiong
59
Independent Director
28-Oct-13
Source: Company reports.
40
Remarks >30 years’ experience in the offshore oil and gas industry. Co-founded Singapore-listed Jaya Holdings Limited in 1981 and was its managing director until 2006. Served as the principal adviser for Pacific Radiance in 2012 and non-executive director between January 2007 and December 2011. >20years’ experience in the offshore marine industry. Co-founder of the Group with the incorporation of Strato Maritime Services in 2002. Previously a business development executive at Maritime Pte. Ltd. for 4 years before spending 9 years as a marketing executive at Jaya Holdings. Son of Executive Chairman, Mr Pang Yoke Min. Began career at Pacific Radiance and was responsible for marketing, business development and finance in the Group's formative years. Joined the Group as General Manager in 2008 and then as the Head of the Group's Shipyard and Marine Equipment Division in 2009. Industry veteran with >20 years’ experience. Started his career at Asian Shipbuilding Industries from 1986 to 1996 and then left for Jaya Shipbuilding & Engineering as a commercial manager from 1997-2007. 23 years’ experience in the financial industry with private, corporate and investment banking experience. Substantial experience in the strategic human resource management and IT sectors and currently the senior vice president for innovation and technology at Resorts World Sentosa. Previously an audit partner at PwC Singapore until her retirement in December 2012, ending a 30 year career in audit. Currently the corporate finance director of PT Central Cipta Murdaya after over 30 years in banking. Managing director at MH Wong Marine Pte. Ltd., a consultancy firm providing consulting and supervision services to the offshore oil and gas industry. A director at Kyra Capital Pte. Ltd., a management/financial consultancy, and CEO and chairman of Personnel Link JobHub Pte. Ltd.
Ajay Mirchandani (65) 6882-2419 [email protected]
Asia Pacific Equity Research 08 August 2014
Table 40: Executive Officers Name Mr Pang Wei Kuan
Age 30
Mr Loo Choo Leong
45
Position Managing Director (Commercial and Business Development) Group Finance Director
Remarks Son of Executive Chairman, Mr Pang Yoke Min. Joined the Group in July 2011 and is responsible for expanding the Group's global presence as well as investment activities. Previously the Group's Chief Investment Officer from July 2010 to 2011. Started career at Arthur Andersen & Co in 1990 and left for Sime Darby Group in 1992 where he rose to become head of its regional finance office and the group head of its global services centre.
Source: Company reports.
41
Asia Pacific Equity Research 08 August 2014
Ajay Mirchandani (65) 6882-2419 [email protected]
Pacific Radiance Ltd.: Summary of Financials Income Statement $ in millions, year end Dec Revenues % change Y/Y Gross Profit Gross Margin EBITDA % change Y/Y EBITDA Margin EBIT % change Y/Y EBIT Margin Net Interest Associates Earnings before tax % change Y/Y Tax as % of EBT Minority Interests Net income (reported) Net income (recurring) % change Y/Y Shares outstanding Fully Diluted EPS Balance sheet $ in millions, year end Dec Cash and cash equivalents Accounts receivable Inventories Others Current assets Net fixed assets Other non-current assets Total Assets
Cash flow statement FY13 FY14E FY15E FY16E $ in millions, year end Dec 169 206 260 281 Profit After tax 28.9% 22.3% 25.9% 8.3% Depreciation & amortization 59 83 112 123 Change in working capital 35.0% 40.2% 43.3% 43.7% Other non-cash items 77 102 128 140 Cash flow from operations 39.6% 39.8% 29.9% 10.6% Capex 36.6% 41.9% 43.2% 44.1% Net Acquisitions 52 68 91 99 Other investing Cash flow 40.5% 29.5% 34.5% 8.8% Cash flow from investments 21.8% 25.2% 29.0% 29.6% Free cash flow (13) (13) (18) (21) a 14 15 18 19 Equity raised/(repaid) 53 70 91 98 Debt raised/(repaid) 85.0% 32.9% 28.8% 7.9% Other 4 0 0 0 Dividends paid 7.3% 0.0% 0.0% 0.0% Cash flow from financing (0) 0 0 0 Net change in cash 57 70 91 98 Beginning cash 57 70 91 98 Ending cash 76.4% 24.1% 28.8% 7.9% DPS 726 726 726 726 a 0.08 0.10 0.12 0.13 a Ratio Analysis FY12 FY13 FY14E FY15E FY16E $ in millions, year end Dec 24 65 71 108 154 Gross margin 69 84 110 132 140 EBITDA margin 0 0 0 0 0 EBIT margin 2 3 3 3 3 Net margin 95 152 185 243 298 a 446 549 707 714 714 Sales growth 0 0 0 0 0 EBIT growth 570 746 951 1,035 1,109 Recurring profit growth a Recurring EPS growth Short-term loans 54 53 53 53 53 a Payables 58 55 62 78 85 Interest coverage (x) Total current liabilities 130 120 127 143 150 Net debt to equity Long-term debt 225 240 378 370 357 a Other liabilities 9 9 9 9 9 Sales/assets Total Liabilities 364 368 515 522 516 Assets/equity Shareholders' equity 205 376 434 511 591 ROE Total Liabilities and equity 570 746 951 1,035 1,109 ROCE BVPS 0.37 0.52 0.60 0.71 0.82 a Source: Company reports and J.P. Morgan estimates.
42
FY12 131 37.6% 37 28.3% 61 43.2% 33.8% 37 23.0% 15.5% (11) 3 29 53.8% 3 10.9% 0 32 32 74.0% 553 0.06
FY12 32 24 (31) (20) 1 5 4 17 0 4 (1) 0 4 9 14 24 0.00
FY13 FY14E FY15E FY16E 57 70 91 98 25 34 37 41 (27) (19) (5) (2) (29) (31) (34) (35) 22 55 89 101 (113) (176) (29) (25) (110) (176) (29) (25) (78) (109) 79 97 123 13 (0) (7) 129 41 24 65 0.02
0 139 0 (12) 127 6 65 71 0.02
0 (9) 0 (14) (23) 37 71 108 0.02
0 (12) 0 (18) (30) 46 108 154 0.03
FY12 28.3% 33.8% 15.5% 24.6%
FY13 FY14E FY15E FY16E 35.0% 40.2% 43.3% 43.7% 36.6% 41.9% 43.2% 44.1% 21.8% 25.2% 29.0% 29.6% 33.7% 34.1% 34.9% 34.8%
37.6% 23.0% 74.0% 74.0%
28.9% 40.5% 76.4% 34.3%
22.3% 29.5% 24.1% 24.1%
25.9% 34.5% 28.8% 28.8%
8.3% 8.8% 7.9% 7.9%
3.9 4.7 123.8% 60.4%
6.8 82.7%
6.2 61.4%
6.0 43.3%
0.2 0.3 2.9 2.3 16.9% 19.6% 3.8% 5.9%
0.2 2.1 17.4% 6.7%
0.3 2.1 19.2% 8.4%
0.3 1.9 17.8% 8.6%
Ajay Mirchandani (65) 6882-2419 [email protected]
Asia Pacific Equity Research 08 August 2014
Analyst Certification: The research analyst(s) denoted by an “AC” on the cover of this report certifies (or, where multiple research analysts are primarily responsible for this report, the research analyst denoted by an “AC” on the cover or within the document individually certifies, with respect to each security or issuer that the research analyst covers in this research) that: (1) all of the views expressed in this report accurately reflect his or her personal views about any and all of the subject securities or issuers; and (2) no part of any of the research analyst's compensation was, is, or will be directly or indirectly related to the specific recommendations or views expressed by the research analyst(s) in this report. For all Korea-based research analysts listed on the front cover, they also certify, as per KOFIA requirements, that their analysis was made in good faith and that the views reflect their own opinion, without undue influence or intervention.
Important Disclosures Company-Specific Disclosures: Important disclosures, including price charts, are available for compendium reports and all J.P. Morgan– covered companies by visiting https://jpmm.com/research/disclosures, calling 1-800-477-0406, or e-mailing [email protected] with your request. J.P. Morgan’s Strategy, Technical, and Quantitative Research teams may screen companies not covered by J.P. Morgan. For important disclosures for these companies, please call 1-800-477-0406 or e-mail [email protected]. Pacific Radiance Ltd. (PACI.SI, PACRA SP) Price Chart 2
1.5
Price(S$)
1
0.5
0 Nov 13
Dec 13
Feb 14
Apr 14
Jun 14
Aug 14
Source: Bloomberg and J.P. Morgan; price data adjusted for stock splits and dividends.
The chart(s) show J.P. Morgan's continuing coverage of the stocks; the current analysts may or may not have covered it over the entire period. J.P. Morgan ratings or designations: OW = Overweight, N= Neutral, UW = Underweight, NR = Not Rated Explanation of Equity Research Ratings, Designations and Analyst(s) Coverage Universe: J.P. Morgan uses the following rating system: Overweight [Over the next six to twelve months, we expect this stock will outperform the average total return of the stocks in the analyst’s (or the analyst’s team’s) coverage universe.] Neutral [Over the next six to twelve months, we expect this stock will perform in line with the average total return of the stocks in the analyst’s (or the analyst’s team’s) coverage universe.] Underweight [Over the next six to twelve months, we expect this stock will underperform the average total return of the stocks in the analyst’s (or the analyst’s team’s) coverage universe.] Not Rated (NR): J.P. Morgan has removed the rating and, if applicable, the price target, for this stock because of either a lack of a sufficient fundamental basis or for legal, regulatory or policy reasons. The previous rating and, if applicable, the price target, no longer should be relied upon. An NR designation is not a recommendation or a rating. In our Asia (ex-Australia) and U.K. small- and mid-cap equity research, each stock’s expected total return is compared to the expected total return of a benchmark country market index, not to those analysts’ coverage universe. If it does not appear in the Important Disclosures section of this report, the certifying analyst’s coverage universe can be found on J.P. Morgan’s research website, www.jpmorganmarkets.com. Coverage Universe: Mirchandani, Ajay: Aboitiz Power (AP.PS), Bumi Armada Berhad (BUAB.KL), COSCO Corporation (COSC.SI), DMCI Holdings (DMC.PS), Dialog Group Bhd (DIAL.KL), Dyna-Mac Holdings Ltd (DMHL.SI), Electricity Generating Company (EGCO.BK), Energy Development (EDC) Corporation (EDC.PS), Ezion Holdings Ltd (EZHL.SI), Ezra Holdings Ltd (EZRA.SI), Glencore International PLC (0805.HK), Glow Energy (GLOW.BK), Keppel Corporation (KPLM.SI), Linc Energy Ltd (LINC.SI), 43
Ajay Mirchandani (65) 6882-2419 [email protected]
Asia Pacific Equity Research 08 August 2014
Malaysia Marine and Heavy Engineering Holdings Bhd (MHEB.KL), Manila Electric Company (MER.PS), Manila Water Company Inc (MWC.PS), Metro Pacific Investments Corp. (MPI.PS), Perisai Petroleum Teknologi Bhd (PPTB.KL), Ratchaburi Electricity Generating Holding (RATC.BK), SapuraKencana Petroleum Bhd (SKPE.KL), Sembcorp Marine (SCMN.SI), Semirara Mining Corp (SCC.PS), Tenaga (TENA.KL), UMW Oil & Gas Corp Bhd (UMOG.KL), Vard Holdings Ltd (VARD.SI), YTL Power (YTLP.KL) J.P. Morgan Equity Research Ratings Distribution, as of June 30, 2014 J.P. Morgan Global Equity Research Coverage IB clients* JPMS Equity Research Coverage IB clients*
Overweight (buy) 45% 55% 46% 75%
Neutral (hold) 43% 49% 47% 66%
Underweight (sell) 11% 34% 7% 54%
*Percentage of investment banking clients in each rating category. For purposes only of FINRA/NYSE ratings distribution rules, our Overweight rating falls into a buy rating category; our Neutral rating falls into a hold rating category; and our Underweight rating falls into a sell rating category. Please note that stocks with an NR designation are not included in the table above.
Equity Valuation and Risks: For valuation methodology and risks associated with covered companies or price targets for covered companies, please see the most recent company-specific research report at http://www.jpmorganmarkets.com, contact the primary analyst or your J.P. Morgan representative, or email [email protected]. Equity Analysts' Compensation: The equity research analysts responsible for the preparation of this report receive compensation based upon various factors, including the quality and accuracy of research, client feedback, competitive factors, and overall firm revenues. Registration of non-US Analysts: Unless otherwise noted, the non-US analysts listed on the front of this report are employees of non-US affiliates of JPMS, are not registered/qualified as research analysts under NASD/NYSE rules, may not be associated persons of JPMS, and may not be subject to FINRA Rule 2711 and NYSE Rule 472 restrictions on communications with covered companies, public appearances, and trading securities held by a research analyst account.
Other Disclosures J.P. Morgan ("JPM") is the global brand name for J.P. Morgan Securities LLC ("JPMS") and its affiliates worldwide. J.P. Morgan Cazenove is a marketing name for the U.K. investment banking businesses and EMEA cash equities and equity research businesses of JPMorgan Chase & Co. and its subsidiaries. All research reports made available to clients are simultaneously available on our client website, J.P. Morgan Markets. Not all research content is redistributed, e-mailed or made available to third-party aggregators. For all research reports available on a particular stock, please contact your sales representative. Options related research: If the information contained herein regards options related research, such information is available only to persons who have received the proper option risk disclosure documents. For a copy of the Option Clearing Corporation's Characteristics and Risks of Standardized Options, please contact your J.P. Morgan Representative or visit the OCC's website at http://www.optionsclearing.com/publications/risks/riskstoc.pdf Legal Entities Disclosures U.S.: JPMS is a member of NYSE, FINRA, SIPC and the NFA. JPMorgan Chase Bank, N.A. is a member of FDIC. U.K.: JPMorgan Chase N.A., London Branch, is authorised by the Prudential Regulation Authority and is subject to regulation by the Financial Conduct Authority and to limited regulation by the Prudential Regulation Authority. Details about the extent of our regulation by the Prudential Regulation Authority are available from J.P. Morgan on request. J.P. Morgan Securities plc (JPMS plc) is a member of the London Stock Exchange and is authorised by the Prudential Regulation Authority and regulated by the Financial Conduct Authority and the Prudential Regulation Authority. Registered in England & Wales No. 2711006. Registered Office 25 Bank Street, London, E14 5JP. South Africa: J.P. Morgan Equities South Africa Proprietary Limited is a member of the Johannesburg Securities Exchange and is regulated by the Financial Services Board. Hong Kong: J.P. Morgan Securities (Asia Pacific) Limited (CE number AAJ321) is regulated by the Hong Kong Monetary Authority and the Securities and Futures Commission in Hong Kong and/or J.P. Morgan Broking (Hong Kong) Limited (CE number AAB027) is regulated by the Securities and Futures Commission in Hong Kong. Korea: J.P. Morgan Securities (Far East) Ltd, Seoul Branch, is regulated by the Korea Financial Supervisory Service. Australia: J.P. Morgan Australia Limited (JPMAL) (ABN 52 002 888 011/AFS Licence No: 238188) is regulated by ASIC and J.P. Morgan Securities Australia Limited (JPMSAL) (ABN 61 003 245 234/AFS Licence No: 238066) is regulated by ASIC and is a Market, Clearing and Settlement Participant of ASX Limited and CHI-X. Taiwan: J.P.Morgan Securities (Taiwan) Limited is a participant of the Taiwan Stock Exchange (company-type) and regulated by the Taiwan Securities and Futures Bureau. India: J.P. Morgan India Private Limited (Corporate Identity Number - U67120MH1992FTC068724), having its registered office at J.P. Morgan Tower, Off. C.S.T. Road, Kalina, Santacruz - East, Mumbai – 400098, is a member of the National Stock Exchange of India Limited (SEBI Registration Number - INB 230675231/INF 230675231/INE 230675231) and Bombay Stock Exchange Limited (SEBI Registration Number - INB 010675237/INF 010675237) and is regulated by Securities and Exchange Board of India. Telephone: 91-22-6157 3000, Facsimile: 91-22-6157 3990 and Website: www.jpmipl.com. For non local research reports, this material is not distributed in India by J.P. Morgan India Private Limited. Thailand: This material is issued and distributed in Thailand by JPMorgan Securities (Thailand) Ltd., which is a member of the Stock Exchange of Thailand and is regulated by the Ministry of Finance and the Securities and Exchange Commission and its registered address is 3rd Floor, 20 North Sathorn Road, Silom, Bangrak, Bangkok 10500. Indonesia: PT J.P. Morgan Securities Indonesia is a member of the Indonesia Stock Exchange and is regulated by the OJK a.k.a. BAPEPAM LK. Philippines: J.P. Morgan Securities Philippines Inc. is a Trading Participant of the Philippine Stock Exchange and a member of the Securities Clearing Corporation of the Philippines and the 44
Ajay Mirchandani (65) 6882-2419 [email protected]
Asia Pacific Equity Research 08 August 2014
Securities Investor Protection Fund. It is regulated by the Securities and Exchange Commission. Brazil: Banco J.P. Morgan S.A. is regulated by the Comissao de Valores Mobiliarios (CVM) and by the Central Bank of Brazil. Mexico: J.P. Morgan Casa de Bolsa, S.A. de C.V., J.P. Morgan Grupo Financiero is a member of the Mexican Stock Exchange and authorized to act as a broker dealer by the National Banking and Securities Exchange Commission. Singapore: This material is issued and distributed in Singapore by or through J.P. Morgan Securities Singapore Private Limited (JPMSS) [MCI (P) 199/03/2014 and Co. Reg. No.: 199405335R] which is a member of the Singapore Exchange Securities Trading Limited and is regulated by the Monetary Authority of Singapore (MAS) and/or JPMorgan Chase Bank, N.A., Singapore branch (JPMCB Singapore) which is regulated by the MAS. This material is provided in Singapore only to accredited investors, expert investors and institutional investors, as defined in Section 4A of the Securities and Futures Act, Cap. 289. Recipients of this document are to contact JPMSS or JPMCB Singapore in respect of any matters arising from, or in connection with, the document. Japan: JPMorgan Securities Japan Co., Ltd. is regulated by the Financial Services Agency in Japan. Malaysia: This material is issued and distributed in Malaysia by JPMorgan Securities (Malaysia) Sdn Bhd (18146-X) which is a Participating Organization of Bursa Malaysia Berhad and a holder of Capital Markets Services License issued by the Securities Commission in Malaysia. Pakistan: J. P. Morgan Pakistan Broking (Pvt.) Ltd is a member of the Karachi Stock Exchange and regulated by the Securities and Exchange Commission of Pakistan. Saudi Arabia: J.P. Morgan Saudi Arabia Ltd. is authorized by the Capital Market Authority of the Kingdom of Saudi Arabia (CMA) to carry out dealing as an agent, arranging, advising and custody, with respect to securities business under licence number 35-07079 and its registered address is at 8th Floor, Al-Faisaliyah Tower, King Fahad Road, P.O. Box 51907, Riyadh 11553, Kingdom of Saudi Arabia. Dubai: JPMorgan Chase Bank, N.A., Dubai Branch is regulated by the Dubai Financial Services Authority (DFSA) and its registered address is Dubai International Financial Centre - Building 3, Level 7, PO Box 506551, Dubai, UAE. Country and Region Specific Disclosures U.K. and European Economic Area (EEA): Unless specified to the contrary, issued and approved for distribution in the U.K. and the EEA by JPMS plc. Investment research issued by JPMS plc has been prepared in accordance with JPMS plc's policies for managing conflicts of interest arising as a result of publication and distribution of investment research. Many European regulators require a firm to establish, implement and maintain such a policy. This report has been issued in the U.K. only to persons of a kind described in Article 19 (5), 38, 47 and 49 of the Financial Services and Markets Act 2000 (Financial Promotion) Order 2005 (all such persons being referred to as "relevant persons"). This document must not be acted on or relied on by persons who are not relevant persons. Any investment or investment activity to which this document relates is only available to relevant persons and will be engaged in only with relevant persons. In other EEA countries, the report has been issued to persons regarded as professional investors (or equivalent) in their home jurisdiction. Australia: This material is issued and distributed by JPMSAL in Australia to "wholesale clients" only. This material does not take into account the specific investment objectives, financial situation or particular needs of the recipient. The recipient of this material must not distribute it to any third party or outside Australia without the prior written consent of JPMSAL. For the purposes of this paragraph the term "wholesale client" has the meaning given in section 761G of the Corporations Act 2001. Germany: This material is distributed in Germany by J.P. Morgan Securities plc, Frankfurt Branch and J.P.Morgan Chase Bank, N.A., Frankfurt Branch which are regulated by the Bundesanstalt für Finanzdienstleistungsaufsicht. Hong Kong: The 1% ownership disclosure as of the previous month end satisfies the requirements under Paragraph 16.5(a) of the Hong Kong Code of Conduct for Persons Licensed by or Registered with the Securities and Futures Commission. (For research published within the first ten days of the month, the disclosure may be based on the month end data from two months prior.) J.P. Morgan Broking (Hong Kong) Limited is the liquidity provider/market maker for derivative warrants, callable bull bear contracts and stock options listed on the Stock Exchange of Hong Kong Limited. An updated list can be found on HKEx website: http://www.hkex.com.hk. Japan: There is a risk that a loss may occur due to a change in the price of the shares in the case of share trading, and that a loss may occur due to the exchange rate in the case of foreign share trading. In the case of share trading, JPMorgan Securities Japan Co., Ltd., will be receiving a brokerage fee and consumption tax (shouhizei) calculated by multiplying the executed price by the commission rate which was individually agreed between JPMorgan Securities Japan Co., Ltd., and the customer in advance. Financial Instruments Firms: JPMorgan Securities Japan Co., Ltd., Kanto Local Finance Bureau (kinsho) No. 82 Participating Association / Japan Securities Dealers Association, The Financial Futures Association of Japan, Type II Financial Instruments Firms Association and Japan Investment Advisers Association. Korea: This report may have been edited or contributed to from time to time by affiliates of J.P. Morgan Securities (Far East) Ltd, Seoul Branch. Singapore: JPMSS and/or its affiliates may have a holding in any of the securities discussed in this report; for securities where the holding is 1% or greater, the specific holding is disclosed in the Important Disclosures section above. India: For private circulation only, not for sale. Pakistan: For private circulation only, not for sale. New Zealand: This material is issued and distributed by JPMSAL in New Zealand only to persons whose principal business is the investment of money or who, in the course of and for the purposes of their business, habitually invest money. JPMSAL does not issue or distribute this material to members of "the public" as determined in accordance with section 3 of the Securities Act 1978. The recipient of this material must not distribute it to any third party or outside New Zealand without the prior written consent of JPMSAL. Canada: The information contained herein is not, and under no circumstances is to be construed as, a prospectus, an advertisement, a public offering, an offer to sell securities described herein, or solicitation of an offer to buy securities described herein, in Canada or any province or territory thereof. Any offer or sale of the securities described herein in Canada will be made only under an exemption from the requirements to file a prospectus with the relevant Canadian securities regulators and only by a dealer properly registered under applicable securities laws or, alternatively, pursuant to an exemption from the dealer registration requirement in the relevant province or territory of Canada in which such offer or sale is made. The information contained herein is under no circumstances to be construed as investment advice in any province or territory of Canada and is not tailored to the needs of the recipient. To the extent that the information contained herein references securities of an issuer incorporated, formed or created under the laws of Canada or a province or territory of Canada, any trades in such securities must be conducted through a dealer registered in Canada. No securities commission or similar regulatory authority in Canada has reviewed or in any way passed judgment upon these materials, the information contained herein or the merits of the securities described herein, and any representation to the contrary is an offence. Dubai: This report has been issued to persons regarded as professional clients as defined under the DFSA rules. Brazil: Ombudsman J.P. Morgan: 0800-7700847 / [email protected]. General: Additional information is available upon request. Information has been obtained from sources believed to be reliable but JPMorgan Chase & Co. or its affiliates and/or subsidiaries (collectively J.P. Morgan) do not warrant its completeness or accuracy except with respect to any disclosures relative to JPMS and/or its affiliates and the analyst's involvement with the issuer that is the subject of the research. All pricing is as of the close of market for the securities discussed, unless otherwise stated. Opinions and estimates constitute our judgment as of the date of this material and are subject to change without notice. Past performance is not indicative of future results. This material is not intended as an offer or solicitation for the purchase or sale of any financial instrument. The opinions and recommendations herein do not take into account individual client circumstances, objectives, or needs and are not intended as recommendations of particular securities, financial instruments or strategies to particular clients. The recipient of this report must make its own independent decisions regarding any securities or financial instruments mentioned herein. JPMS distributes in the U.S. research published by non-U.S. affiliates and accepts responsibility for its contents. Periodic updates may be provided on companies/industries based on company specific developments or
45
Ajay Mirchandani (65) 6882-2419 [email protected]
Asia Pacific Equity Research 08 August 2014
announcements, market conditions or any other publicly available information. Clients should contact analysts and execute transactions through a J.P. Morgan subsidiary or affiliate in their home jurisdiction unless governing law permits otherwise. "Other Disclosures" last revised June 21, 2014.
Copyright 2014 JPMorgan Chase & Co. All rights reserved. This report or any portion hereof may not be reprinted, sold or redistributed without the written consent of J.P. Morgan. #$J&098$#*P
46