Position Paper
Annals of Internal Medicine
Achieving a High-Performance Health Care System with Universal Access: What the United States Can Learn from Other Countries American College of Physicians*
This position paper concerns improving health care in the United States. Unlike previous highly focused policy papers by the American College of Physicians, this article takes a comprehensive approach to improving access, quality, and efficiency of care. The first part describes health care in the United States. The second compares it with health care in other countries. The concluding section proposes lessons that the United States can learn from these countries and recommendations for achieving a high-performance health care system in the United States. The articles are based on a position paper developed by the American College of Physicians’ Health and Public Policy Committee. This policy paper (not included
in this article) also provides a detailed analysis of health care systems in 12 other industrialized countries. Although we can learn much from other health systems, the College recognizes that our political and social culture, demographics, and form of government will shape any solution for the United States. This caution notwithstanding, we have identified several approaches that have worked well for countries like ours and could probably be adapted to the unique circumstances in the United States.
HEALTH CARE
wide variations exist within the United States concerning cost, utilization, quality, and access to health care services (7, 8). For example, Medicare spending per capita in 1996 was $8414 per enrollee in the Miami, Florida, region compared with $3341 in the Minneapolis, Minnesota, region (8). Most of the variations among geographic areas are due to differences in the volume and intensity of practice (that is, differences in the quantity of services provided per capita) (7, 8). Yet, patients in high-intensity areas on average have outcomes that are no better, and perhaps worse, than those in geographic areas with lower rates of utilization (9, 10). Americans receive appropriate preventive, short-term, and long-term health care as recommended by professional guidelines only about 55% of the instances in which those recommendations would apply (11). The Institute of Medicine has documented high levels of medical errors and inappropriate and unnecessary care, indicating system-wide problems with delivering consistently high-quality care (12, 13). Approximately 45% of the U.S. population has a chronic medical condition, and about 60 million people, half of these, have multiple chronic conditions (14). For
IN THE
UNITED STATES
For most Americans, high-quality care generally is readily accessible without long waits but at high cost. However, the uninsured and, increasingly, the underinsured, the poor, and members of underserved minorities often have poor access to health care and poor health outcomes—in some cases worse than that of residents of developing countries. The health workforce is well trained, yet the United States faces a severe shortage of primary care physicians. Most Americans—250 million (84.2%)— have some form of health insurance coverage. But an estimated 47 million Americans (15.8%) were uninsured for a year, as reported for 2006 by the U.S. Bureau of the Census (1). A survey by the Centers for Disease Control and Prevention found that 43.6 million people (14.8%) of all ages were uninsured at the time of the National Health Expenditure Survey interview in 2006 (2). However, as many as 89.5 million people under the age of 65 years lacked health insurance for at least 1 month or more during 2006 –2007, according to a study by Lewin and associates published by Families USA (3). In addition, another 16 million people can be considered underinsured (4). People without health insurance are much less likely than those with insurance to receive recommended preventive services and medications, are less likely to have access to regular care by a personal physician, and are less able to obtain needed health care services. Consequently, the uninsured are more likely to succumb to preventable illnesses, more likely to suffer complications from those illnesses, and more likely to die prematurely (5, 6). Even among those with health insurance coverage,
Ann Intern Med. 2008;148:55-75.
www.annals.org
See also: Print Editorial comment. . . . . . . . . . . . . . . . . . . . . . . . . . . 78 Web-Only Conversion of graphics into slides Audio summary
*This paper, written by Jack A. Ginsburg, Robert B. Doherty, J. Fred Ralston Jr., MD, and Naomi Senkeeto, was developed for the Health and Public Policy Committee of the American College of Physicians (ACP): J. Fred Ralston Jr., MD (Chair); Molly Cooke, MD (Vice Chair); Charles Cutler, MD; David A. Fleming, MD; Brian P. Freeman, MD; Robert A. Gluckman, MD; Mark Liebow, MD; Robert M. McLean, MD; Kenneth A. Musana, MBChB; Patrick M. Nichols; Mark W. Purtle, MD; P. Preston Reynolds, MD; and Kathleen M. Weaver, MD; with contributions from David C. Dale, MD (ACP President, ex officio); Joel S. Levine, MD (Chair, ACP Board of Regents); and Joseph W. Stubbs, MD (Chair, ACP Medical Service Committee). It was approved by the ACP Board of Regents on 27 October 2007. © 2008 American College of Physicians 55
Position Paper
High-Performance Health Care System with Universal Access
Table 1. International Comparisons of Key Health Care Statistics* Variable
United States
Australia
Belgium
Canada
Denmark
France
Germany
Japan
Infant mortality per 1000 births (2004) Life expectancy at birth (2004) Population age ⬎65 y (2007), %‡ Obesity rate Adult smoking rate Practicing physicians per 1000 persons Generalists of practicing physicians (2000), %¶ Inpatient beds per 1000 persons MRI units per 1 million persons Per capita health spending, $ Prescription drug spending per capita, $ Drug spending as % of total health, $
6.8† 77.8† 12.5 32.2† 16.9 2.4 43.6 2.7 26.6† 6401 792 12.4
5 80.9 13.1 20.4† 17.7† 2.7† 51.9 3.6† 4.2 3128† 383 13.3
3.7 79.4† 17.4 12.7† 20 4 NA 4.4 6.8 3389 344 11.3
5.3† 80.2† 13.3 18 17.3 2.2† 47.5 2.9† 5.5 3326 559 17.8 (2006)
4.4 77.9 15.2 11.4 26† 3.6 19.1** 3.1† 10.2† 3108 270 8.9
3.6 80.3 16.4 9.5† 23† 3.4 48.8 3.7 3.2 3374 NA 16.4
3.9 79 19.4 13.6 24.3§ 3.4† 32.7 6.4 7.1 3287 438 15.2
2.8 82 20.0 3† 26.3 (2006) 2 NA 8.2 40.1 2358† 425 19†
* Data are for 2005 (unless otherwise noted) from: World Health Organization. World Health Statistics 2007. Accessed at www.who.int/whosis/whostat2007.pdf on 22 May 2007 and Organization for Economic Co-operation and Development (OECD). OECD Health Data 2007. Accessed at www.oecd.org/document/30/0,3343,en_2649 _37407_12968734_1_1_1_37407,00.html on 23 July 2007. MRI ⫽ magnetic resonance imaging; NA ⫽ not available. † Latest available data: 2004. ‡ CIA World Factbook. Age Structure 65 Years and Over (%) 2007. Accessed at www.photius.com/rankings/population/age_structure_65_years_and_over_2007_0.html on 10 May 2007. § Latest available data: 2003. 㛳 Latest available data: 2002. ¶ Colombo F, Tapay N. Private Health Insurance in OECD Countries: The Benefits and Costs for Individual and Health Systems. OECD, 2006. ** The low percentages of generalist physicians reported for Denmark and the Netherlands compared with other countries may be due to different methods for collecting and reporting workforce data. Further research is needed to better understand these apparent discrepancies.
the Medicare program, 83% of beneficiaries have 1 or more chronic medical conditions and 23% have 5 or more chronic medical conditions (15). By 2015, an estimated 150 million Americans will have at least 1 chronic medical condition (14). The U.S. health care system has much potential for improvement. Disparities related to race, ethnicity, and socioeconomic status pervade the U.S. health care system (16). In addition to the large numbers of Americans who lack adequate health insurance, the cost, quality, and utilization of health care services vary widely. Meanwhile, the need for long-term care services and care coordination is increasing. Preventive care, cross-discipline coordination, and proactive management of long-term care might reduce
the cost of care, but these services often are uncovered or poorly reimbursed. The Cost of Health Care in the United States
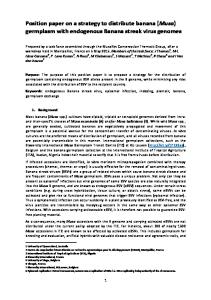
Spending on health care in the United States has been rising at a faster pace than spending in the rest of the economy since the 1960s (Figure 1 [17]). In 2005, national health care spending amounted to approximately $2.0 trillion, or $6697 per person and 16% of the gross domestic product (GDP). By 2015, health care spending is expected to reach $4.0 trillion and amount to 20% of the GDP (18). A minority of the population generate most health care costs. In every age group in the United States, approx-
Figure 1. U.S. national health expenditure (NHE) as a share of gross domestic product (GDP) and private and public shares of NHE, selected years 1965–2015.
Total NHE is the total amount spent in the United States to purchase health care goods and services during the year. Detailed definitions of the various components of NHEs can be found at www.cms.hhs.gov/NationalHealthExpendData/downloads/dsm-05.pdf. The left axis (public and private spending’s share of NHE) relates to the 2 line graphs. The right axis (NHE share of GDP) relates to the bars. Data for 2006, 2010, and 2015 are projections. Source: Centers for Medicare & Medicaid Services, Office of the Actuary, National Health Statistics Group. 56 1 January 2008 Annals of Internal Medicine Volume 148 • Number 1
www.annals.org
High-Performance Health Care System with Universal Access
Table 1—Continued Netherlands
New Zealand
Switzerland
United Kingdom
4.9 79.4 14.2 10.7 31 3.7† 14.3** 3.1 5.6 3094† 318 11.5†
5.1 79 11.8 20.9§ 22.5 2.2 69.2 6㛳 3.7§ 2343 NA 12.4
4.2 81.3 15.6 7.7㛳 26.8㛳 3.8 50.7 3.6 14.4 4177 NA 10.4
5.1 79 15.8 23 24 2.4† 31.8 3.1 5.4 2724 NA NA
imately 10% of the population incurs 60% to 70% of the costs. People with large medical care costs are often chronically ill, disabled, or poor. Our society’s inability to provide continuous, coherent patient-centered care for this group of individuals is one cause of the high aggregate cost of health care and contributes to the cost of public insurance programs. Patients who enter Medicare without previous insurance but with chronic illness will be sicker and more disabled and therefore more costly to that government program (5, 19). Paying for Health Care in the United States
While private funds accounted for approximately 50% ($1085.0 billion) of the aggregate U.S. national health care expenditures ($1987.7 billion) in 2005, private insurance paid for only 35% ($694.4 billion). Likewise, private insurance paid 35% ($596.7 billion) of personal health care expenses ($1661.4 billion), the costs of therapeutic goods or services rendered to treat or prevent specific diseases or conditions of individuals (20). Health insurance premiums increased 8.8% in 2005, declining from a peak yearly rate of increase of 13.7% in 2002. From 2000 to 2005, premiums for family coverage increased by 73%, compared with inflation growth of 14% and wage growth of 15%. The average annual premiums for employer-sponsored coverage rose to $4024 for single coverage and $10 880 for family coverage (21). The major components of U.S. health care spending (Figure 2) are hospitals (30%), physician and clinical services (21%), pharmaceuticals (10%), and other spending (25%) (22). Table 1 shows comparable data for some of these key components for other countries. Employer-based health insurance has been the basis for paying for health services since 1940, but it is fast eroding under the pressure of relentlessly rising costs of care. The proportion of people with employer-based health insurance coverage dropped from 63.6% in 2000 to 59.7% in 2006. Correspondingly, the percentage of people with government insurance, including Medicare, Medicaid, and military health care, increased from 24.7% in 2000 to 27.0% in 2006, and the percentage of people without any www.annals.org
Position Paper
health insurance protection rose to almost 16% (23). The average annual premium for employer-sponsored family health insurance increased from $6772 to $10 728 (58%) between 2000 and 2005. During the same period, the average annual premium cost for single-person coverage increased from $2655 to $3991 (50%). Premiums increased 60% for employees over the 5-year period, from $1614 to $2585 (24). As health insurance premiums have risen, employers have reduced their costs by decreasing or dropping coverage or benefits, shifting to managed care plans, adopting pharmacy benefit management plans, and increasing the extent of cost sharing between employer and employee. From 1999 to 2003, the percentage of workers enrolled in employer-sponsored health plans that required cost-sharing of hospital bills increased from 33.8% to 54.7%, an increase of more than 60%, and the proportion of workers subject to copayments greater than $10 for physician visits more than doubled (25). In 2005, 76.7% of nonfederal employees enrolled in employer-sponsored health insurance paid a copayment for doctor visits. The average copayment was $18.20 (26). Copayments deter some insured people from obtaining needed care (27). In addition, high health insurance costs deter employers who do not provide health insurance from buying coverage for their employees and make it nearly impossible for most uninsured people to buy more expensive individual policies on their own (28). Despite the growing need for coordination of health care services, government and private insurers pay for health care services primarily on an episodic, visit-related basis with few, if any, incentives for providing comprehensive, coordinated, and continuous care for the prevention and management of chronic illness. Primary care physicians now spend about 20% of their time in unreimbursed coordination of care tasks using the telephone or e-mail (29). Unless changes are made in payment policy to compensate for these services, disincentives for care coordination will continue while the need will increase. Government Programs
Government pays 46% of all U.S. health care costs through public programs. Medicare pays 17%, Medicaid and the State Children’s Health Insurance Program (SCHIP) account for 16%, and other public programs (such as Veterans Health Administration, Department of Defense, workers’ compensation, and public health) pay 13%. Despite repeated attempts to rein in federal expenditures for Medicare and Medicaid, federal expenditures have continued to increase much faster than inflation in the entire economy (30). Medicare
Currently, approximately 42.5 million Americans are covered by the Medicare program: 35.6 million because of eligibility based on age and 6.7 million because of disability, including those being treated for end-stage renal dis1 January 2008 Annals of Internal Medicine Volume 148 • Number 1 57
Position Paper
High-Performance Health Care System with Universal Access
Figure 2. The nation’s health dollar, calendar year 2005: where it went.
“Physician and Clinical Services” includes offices of physicians, outpatient care centers, and medical and diagnostic laboratories. “Other Spending” includes dentist services, other professional services, home health, durable medical products, over-the-counter medicines and sundries, public health, other personal health care, research, and structures and equipment. Source: Centers for Medicare & Medicaid Services, Office of the Actuary, National Health Statistics Group.
ease. Total Medicare expenditures in 2005 were $342 billion (31). Medicare Part A reimburses hospitals for covered services for inpatient care. It also reimburses skilled nursing facilities for covered services, but not for custodial or longterm care. It also covers hospice care and some home health care for qualified beneficiaries. The source of funding is primarily payroll contributions (Federal Insurance Contributions Act) from workers and employers to the Hospital Insurance Trust Fund. Medicare Part B covers medically necessary physician services; outpatient care; diagnostic and laboratory services; some supplies; and some services, such as care by physical and occupational therapists and some home health care not covered by Part A. Beneficiaries pay monthly premiums for Part B to the Supplemental Medical Insurance Trust Fund. The other source of funding is the federal government from general revenues. The Medicare Modernization Act of 2003, increased Part B premiums and established graduated payments on an income-based scale for individuals with incomes above $82 000 and for couples with incomes above $164 000. The scale is indexed to rise with inflation. Medicare Part C provides an option (Medicare Advantage) for beneficiaries to enroll in private insurance plans that are approved to provide Medicare benefits. Medicare Advantage plans provide all Part A and Part B coverage and generally offer extra benefits or lower costs. Many include 58 1 January 2008 Annals of Internal Medicine Volume 148 • Number 1
Part D drug coverage. These plans receive capitated payments from Medicare and often restrict covered services to provider networks, such as preferred-provider organizations, health maintenance organizations, and private feefor-service plans. Under the traditional Medicare program, doctors, other providers, and suppliers receive payments according to schedules that set the maximum fees that Medicare will reimburse. Beneficiaries in the original program—still by far the largest component of Medicare—must pay annual deductibles and co-insurance or copayments for covered services and supplies. In 2006, Medicare prescription drug coverage became available as Medicare Part D. All Medicare beneficiaries are eligible to enroll in Part D. Coverage is provided through private insurance companies, and enrollment is voluntary. Beneficiaries must pay monthly premiums. Previously, many Medicare beneficiaries purchased private supplemental insurance (Medigap) to obtain coverage for prescription drugs. However, following implementation of Medicare Part D, insurers are not offering new Medigap policies covering prescription drugs (32). Medicaid
The Medicaid program provides medical benefits to over 52 million people who meet categorical eligibility standards. It covers about 25% of U.S. children (21 million), and supplements Medicare coverage for 7 million elderly and disabled people. Children account for almost half of the enrollees, but 70% of the expenditures are for care of elderly (25%) and disabled (45%) adults (33). The federal government establishes general guidelines for the program, but each state sets its own rules on eligibility and services. States may also offer additional coverage for optional services. The federal government and the states share responsibility for funding Medicaid. In 2005, Medicaid spending, exclusive of SCHIP, amounted to $313 billion, with federal funds accounting for about $179 billion (57%) and state funds accounting for approximately $134 billion (43%). The federal share for each state ranged from 50% to 77%, depending on average personal income in each state (34). SCHIP was enacted in 1997 to expand health coverage for children in families with incomes that are low but above the level for Medicaid eligibility. By 2005, about 4.2 million children were covered by the program. SCHIP is jointly financed by the federal and state governments but is administered by the states. In 2005, total expenditures for SCHIP were $5.5 billion, with the federal government providing $3.8 billion (69%) and state governments funding $1.7 billion (31%) (31). Legislative authorization for SCHIP expired on 30 September 2007. Disagreement between President Bush and Congress on funding and eligibility has led the President to veto legislation to reauthorize the program, and to date there have been insufficient votes in the House of Representatives to override a veto. In the www.annals.org
High-Performance Health Care System with Universal Access
meantime, Congress has maintained funding for SCHIP under a time-limited temporary extension. Veterans Administration
The Veterans Administration (VA) provides a range of benefits and services to about 5.5 million eligible veterans and their dependents, primarily by salaried physicians working in government-owned facilities. The VA is a single-payer system that may provide some important lessons for the rest of the U.S. health care system. The VA operates 156 hospitals, 135 nursing homes, 43 residential rehabilitation treatment centers, and 711 community-based outpatient clinics. It is the nation’s largest integrated direct health care delivery system. The VA facilities are affiliated with 107 of the nation’s 126 medical schools and 1200 other health professions schools (35). Veterans who are disabled because of a service-related injury or illness have first priority for access to VA health care. Other veterans have access depending on annual discretionary appropriations by Congress. Funds are allocated to geographic regions that typically contain several hospitals. If funding runs out before the end of a fiscal year, services are curtailed. In the mid-1990s, the VA responded to criticism of deficiencies in VA health care by adopting a system-wide reorganization. Reforms included modernization of facilities, reorganization and decentralization, reduction of inpatient capacity, and reallocation of greater resources to ambulatory care. The VA developed patient data registries, an electronic medical record (EMR) system, and a commitment to improving quality and patient safety (36). Reforms included adoption of a performance-based incentive system and other measures to improve quality, and increased emphasis on primary care, preventive services, and case management for long-term care (36). As a result, the VA has become a leader in developing a coordinated system of care and health care quality improvement. Comparisons of VA patients with a national sample show that VA patients receive higher quality of care, with highest quality in areas where the VA actively monitors performance (37). The VA patients received higher-quality long-term and preventive care than Medicare patients, particularly for such diseases as diabetes (38). The VA’s reorganization and placement of greater emphasis on outpatient primary care has resulted in better access to care for veterans who have had trouble accessing care in the private sector (39). The VA is also a leader in providing comprehensive rehabilitation services for spinal cord injuries, for which it integrates vocational, psychological, and social services within a continuum of care that involves a team-based approach (40). The VA has managed prescription drug costs astutely. The VA relies on a formulary that encourages the use of generic and lower-cost drugs. Costs are also reduced by combining purchasing power with the Department of Defense to jointly purchase drugs and by using a highly automated mail order system that dispenses more than three www.annals.org
Position Paper
fourths of all VA prescriptions (41). One recent study found that the prices paid for drugs most often used by seniors under the Medicare Part D drug plan are 60% higher than prices paid for the same drugs by the VA (42). However, critics contend that comparing drug costs in the VA and Medicare is unfair because the VA is a closed system, with drugs restricted to a formulary and dispensed only through the mail or at government-owned pharmacies. They also note that the drugs approved for the formulary are typically older than those generally available. The VA formulary contains only 38% of drugs approved by the U.S. Food and Drug Administration in the 1990s and 19% of drugs approved since 2000. One study indicates that using older drugs is associated with a 2-month shorter life expectancy worth $25 000 in economic value (43). The success of the VA system in dramatically restructuring itself indicates that major gains can be achieved in the United States in improving health care access and quality while reducing costs. Although reforms may be more readily achievable in a closed single-payer system, such as the VA, the VA experience provides some key lessons for improving health care system performance. These lessons include shifting services to outpatient care, placing greater emphasis on primary and preventive care, facilitating case management for long-term care, adopting information technology and a system-wide EMR, use of performance measurement, and controlling prescription drug costs. Out-of-Pocket Spending
Individuals in the United States pay 13% of all health care costs out of pocket. Rising costs create an especially severe financial burden for individuals who must pay health care costs out of pocket. Rising health care costs also contribute to increased personal debt and bankruptcy rates (44, 45). In 2001–2002, nearly 1 in 6 families (27 million) spent 10% or more of their income (5% or more if lowincome) on out-of-pocket medical costs (45). One response to rising health care costs has been the adoption of consumer-directed health plans in which the individual takes greater responsibility for paying for care out of pocket, rather than the employer or government. Increased cost sharing is one means to encourage patients to be more cost conscious and to use health services more judiciously. Unfortunately, for those with modest incomes, cost sharing has reduced medically necessary care, such as taking medicines for hypertension (4, 46). Physician Workforce
The United States is in the midst of a primary health care workforce crisis that is expected to worsen precipitously in the next decade. The population is aging, and baby boomers, the largest subcohort of the population, will soon be over age 65 years and at greater risk for needing care for chronic conditions (47). Yet, the United States currently does not have national policies to guide the training, supply, and distribution of health care providers to 1 January 2008 Annals of Internal Medicine Volume 148 • Number 1 59
Position Paper
High-Performance Health Care System with Universal Access
meet future needs for particular specialties of medicine, such as primary care. Primary care physicians are leaving practice sooner than other physician specialists at the same time that the numbers of medical students and residents choosing to pursue careers in primary care are declining rapidly. The U.S. primary care workforce is undergoing a gradual but inexorable contraction that will seriously affect access to care (48). The long-term result will be higher costs, lower quality, diminished access, and decreased patient satisfaction (49). The health care system will become increasingly fragmented, overspecialized, and costly. Technology and Innovation
Technological innovation is a hallmark of U.S. medicine. Anyone in the United States with adequate insurance or the ability to pay has access to the latest clinically effective technology with little or no waiting time (49). The United States has no effective public policies to restrain the spread of technology, which often occurs before adequate evaluation of its effectiveness. Even when research shows that technology is ineffective for some groups of patients, translating these research findings into more selective decision making often proceeds slowly, requires educational efforts to promote best practices, and encounters resistance from practitioners. Diffusion of new technology into practice is associated with greater per capita utilization and higher spending (50). Technological progress accounts for a large share of the rise in U.S. health care expenditures (51). Many new biotechnology products (for example, monoclonal antibodies against tumor necrosis factor) are very effective but also extremely expensive when taken regularly for chronic diseases, such as arthritis. The United States also lacks centralized authority for coordinating assessments of the clinical effectiveness or cost-effectiveness of new technology. Instead, technology assessments are conducted by various public and private organizations, including the Agency for Healthcare Research and Quality (AHRQ), the Medicare Coverage Advisory Committee, Blue Cross/Blue Shield, and the VA. Evaluations of clinical effectiveness and determinations of best practices are also made by professional organizations, such as the American College of Physicians (ACP), the American College of Cardiology, the American Heart Association, and others. This pluralistic system leads to largescale duplication of efforts to provide evidence-based guidance to good medical practice. This duplication of effort is not necessary. At least 45 agencies in 22 countries, including AHRQ for the United States, share technology assessment information through the International Network of Agencies for Health Technology Assessment. The pluralistic health care system in the United States does not have effective ways of controlling the use of health technology. Health insurance plans and health maintenance organizations are free to base coverage decisions on 60 1 January 2008 Annals of Internal Medicine Volume 148 • Number 1
any available evaluations, to make their own assessments or purchase them from private companies, or to ignore research findings. Likewise, physicians, hospitals, and patients are free to order or utilize health care technology regardless of whether it is clinically effective or costeffective. The Performance of the U.S. Health Care System Criteria for a Well-Functioning System
The Commonwealth Fund has developed a set of criteria for comparing and evaluating health care systems. In July 2005, it established an 18-member Commission on a High Performance Health System to chart a course for advancing promising strategies for health system improvement (52). The Commission identified 37 indicators of “high performance” for measuring health systems (Table 2). It aggregated performance indicators into broad categories to measure and monitor health care outcomes. The Commission used these indicators to identify top-performing health systems to use as benchmarks against which to compare health care systems. The Commission then issued a national score card. The U.S. scores on 6 categories of system performance ranged from 51 to 71 on a scale in which systems with the best scores were used as benchmarks and were rated at 100. Overall, the U.S. health care system received a score of 66 (53). The U.S. composite scores for each of the 6 categories are listed after each category: long, healthy, and productive lives: 69; quality: 71; access: 67; efficiency: 51; equity: 71; capacity to innovate and improve: not scored. Commonwealth Fund Commission Key Indicators for Measuring Performance
Long, Healthy, and Productive Lives. The Commonwealth Fund Commission defined the overarching mission of a high-performance health care system as being “to help everyone, to the extent possible, lead long, healthy, and productive lives.” All performance indicators reflect on a system’s ability to achieve this goal. Specific measures of health outcomes for this indicator include high life expectancy, low preventable mortality, low infant mortality, and low proportions of adults with limitations on their activities. The United States ranked last overall on all 3 indicators of healthy lives. The U.S. infant mortality rate is 7.0 deaths per 1000 live births, compared with 2.7 in the top 3 countries. Quality. A well-functioning, high-performance health care system would provide care that is necessary, appropriate, and of high quality. Care would be provided in accord with evidence of clinical effectiveness and with a minimum of avoidable errors. Indicators of high quality include provision of preventive care services, management of chronic diseases, care coordination, provision of patient-centered care, low nursing home admission and readmission rates, low instances of medical errors, and low preventable death rates. The United States scored well on the provision of www.annals.org
High-Performance Health Care System with Universal Access
Position Paper
Table 2. National Scorecard on U.S. Health System Performance* Indicator
U.S. National Rate
Benchmark
Mortality amenable to health care, deaths per 100 000 population Infant mortality, deaths per 1000 live births Healthy life expectancy at age 60 y Adults ⬍65 y limited in any activities because of physical, mental, or emotional problems, % Children missed 11 or more school days due to illness or injury, % Adults received recommended screening and preventive care, % Children received recommended immunizations and preventive care† Needed mental health care and received treatment† Chronic disease under control† Hospitalized patients received recommended care for AMI, CHF, and pneumonia (composite), % Adults ⬍65 y with accessible primary care provider, % Children with a medical home, % Care coordination at hospital discharge† Nursing homes: hospital admissions and readmissions among residents† Home health: hospital admissions, % Patients reported medical, medication, or laboratory test error, % Unsafe drug use† Nursing home residents with pressure sores† Hospital-standardized mortality ratios, actual to expected deaths Ability to see doctor on same/next day when sick or needed medical attention, % Very/somewhat easy to get care after hours without going to the emergency department, % Doctor–patient communication: always listened, explained, showed respect, spent enough time, % Adults with chronic conditions given self-management plan, % Patient-centered hospital care† Adults ⬍65 y insured all year, not underinsured, % Adults with no access problem due to costs, % Families spending ⬍10% of income or ⬍5% of income, if low income, on out-of-pocket medical costs and premiums, % Population ⬍65 y living in states where premiums for employer-sponsored health coverage are ⬍15% of under-65 median household income, % Adults ⬍65 y with no medical bill problems or medical debt, % Potential overuse or waste† Went to emergency department for condition that could have been treated by regular doctor, % Hospital admissions for ambulatory care–sensitive conditions† Medicare hospital 30-day readmission rates, % Medicare annual costs of care and mortality for AMI, hip fracture, and colon cancer, annual Medicare outlays in $; deaths per 100 beneficiaries Medicare annual costs of care for chronic diseases: diabetes, CHF, COPD† Percentage of national health expenditures spent on health administration and insurance, % Physicians using electronic medical records, % Overall score
115
Top 3 of 19 countries
80
70
Top 3 of 23 countries Top 3 of 23 countries Top 10% states
2.7 19.1 11.5
39 87 77
3.8
73
7.0 16.6 14.9 5.2 49
Top 10% states Target
Benchmark Rate
80
Score: United States Compared with Benchmark
61
Various
Various
Various
85
Various Various 84
Various Various Top hospitals
Various Various 100
66 61 84
66 46 Various Various
65⫹ y, high income Top 10% states Various Various
84 60 Various Various
79 77 70 64
28 34
Top 25% agencies Best of 6 countries
Various Various 101
Various Various Top 10% hospitals
17 22 Various Various 85
62 65 60 67 84
47
Best of 6 countries
81
58
38
Best of 6 countries
72
53
54
90th percentile Medicare plans
74
74
58
Best of 6 countries
65
89
Various 65 60 83
Various Target Best of 5 countries Target
Various 100 91 100
87 65 66 83
58
Target
100
58
66
Target
100
66
Various 26
Various Best of 6 countries
Various 6
48 23
Various
Various
Various
57
18 26 829; 30
10th percentile regions 10th percentile regions
14 23 314; 27
75 88
Various
Various
Various
68
2.0
28
7.3 17 –
Top 3 of 11 countries Top 3 of 19 countries –
80 –
21 66
* Source: The Commonwealth Fund, calculated from Organization for Economic Cooperation and Development Health Data 2006 (www.commonwealthfund.org); Cylus J, Anderson GF. Multinational Comparisons of Health Systems Data, 2006. The Commonwealth Fund; May 2007. AMI ⫽ acute myocardial infarction; CHF ⫽ congestive heart failure; COPD ⫽ chronic obstructive pulmonary disease. Reproduced with permission from reference 85. † “Various” denotes indications that make up ⱖ2 related measures. Scores average the individual ratios for each component. For detailed information on the national and benchmark rates for individual components, please refer to Schoen C, Davis K, How SK, Schoenbaum SC. U.S. health system performance: a national scorecard. Health Aff (Millwood). 2006;25:w457-75. Epub 2006 Sep 20. [PMID: 16987933]. www.annals.org
1 January 2008 Annals of Internal Medicine Volume 148 • Number 1 61
Position Paper
High-Performance Health Care System with Universal Access
preventive care but received low scores on long-term care management, safe care, and patient-centered care. For overall quality, the United States ranked fifth and Canada ranked sixth. Access. In a high-performance health care system, needed health care services would be readily accessible to all members of the population. Measures of access include health insurance coverage, ability to see a physician and obtain needed medical attention, families spending less than 10% of income on out-of-pocket medical costs and premiums (5% if low income), ease of obtaining afterhours care, short waiting times for doctor appointments, and a minimal number of patients with problems with medical bills or high medical debts. With 47 million uninsured, the United States ranked last on access. However, the report noted that insured patients in the United States have rapid access to specialized care. Overall, Germany ranked first on access. Efficiency. A well-functioning system would have low rates of overuse, inappropriate use, or waste; minimal expenditures for administrative and regulatory cost; and use of information tools (for example, health information technology and EMRs) to support efficient care. Of the 6 countries compared, the United States ranked last in terms of efficiency. The Commonwealth Fund Commission found that the United States had poor performance in terms of measures of national health expenditures, administrative costs, the use of information technology, and the use of multidisciplinary teams. It noted that “the US lags well behind other nations in the in the use of electronic medical records: 17 percent of U.S. doctors compared with 80 percent in the top three countries” (53). Equity. Measures of equity in the health care system reflect differences based on income, insurance status, and geography (urban versus rural), as well as differences among population groups based on age, sex, race, and ethnicity. A well-functioning system would have minimal differences among groups in terms of access to and quality of health care services. The United States also ranked last on measures of equity, particularly because of inequities in access and quality based on income. The Commonwealth Fund Commission noted that there is a wide gap between low-income or uninsured populations and those with higher incomes and insurance. It also considered disparities among racial and ethnic groups and concluded that “Overall, it would require a 24% or greater improvement in African-American mortality, quality, access and efficiency indicators to approach benchmark white rates” (53). Capacity to Innovate and Improve. A system’s ability to innovate and improve is a crucial element for attaining high performance. The Commonwealth Fund Commission did not identify specific indicators or scores for this element. Measures could include investments in research (clinical, technological, pharmaceutical, and health services research) and having a health care infrastructure that fosters innovation. This indicator could also include having 62 1 January 2008 Annals of Internal Medicine Volume 148 • Number 1
an infrastructure and workforce planning capacity to assure sufficient numbers of appropriately trained physicians and other health care professionals. The Commonwealth Fund Commission’s data indicate that the U.S. health care system has much room for improvement. The Commission concluded that The Scorecard results make a compelling case for change. Simply put, we fall far short of what is achievable on all major dimensions of health system performance. The overwhelming picture that emerges is one of missed opportunities—at every level of the system—to make American health care truly the best that money can buy (53).
The Commonwealth Fund Commission estimated that closing the gaps between actual and achievable performance as measured by its scorecard could save at least $50 billion to $100 billion per year in health care spending and could prevent 100 000 to 150 000 deaths per year (53). In addition, it cited the Institute of Medicine’s estimate that the nation could achieve economic savings of up to $130 billion per year from insuring the uninsured (54). Clearly, the evaluations and comparisons by the Commonwealth Fund Commission indicate that the U.S. health care system must improve considerably to achieve the performance levels attained by health care systems in other countries. The next section of this article contains a detailed comparison of health care systems in the United States and other countries.
THE U.S. HEALTH CARE SYSTEM COMPARED THAT IN OTHER COUNTRIES
WITH
Difficulties with Comparing Health Care in Different Countries
Although many individuals in the United States receive exemplary health care, international comparisons on most key indicators of the public’s health have shown that the United States has poorer health outcomes in the aggregate than many other industrialized countries. However, comparing health data from different countries can be difficult because differences in health outcomes may also reflect economic, demographic, social, and cultural factors. International comparisons by definition involve national averages and fail to recognize wide variations within such countries as the United States, in which, for example, public spending on health varies from $59 per capita in Iowa to $499 per capita in Hawaii and infant mortality rates range from 4.7 deaths per 1000 births in Massachusetts to 10.1 in Mississippi (55). International comparisons are subject to error because of differences in the way countries define, report, and interpret data. Also, the growing practice of cross-national travel for health care—European Union (EU) citizens can now receive care anywhere within the EU—makes it difficult to attribute health outcomes to health care in one country. These caveats notwithstanding, www.annals.org
High-Performance Health Care System with Universal Access
the ACP believes that the United States has much to learn by closely examining how other countries’ health care systems tried to solve the problems that underlie the United States’ low-ranking performance relative to its per capita national health care expenditures, which rank first among nations. In the past, data for these comparisons generally were limited to such indicators of health status as life expectancy and infant mortality and national health expenditures. In 2001, the Organization for Economic Co-operation and Development (OECD) began a project to measure and compare health care quality among countries (56). In 2005, the OECD and the World Health Organization agreed to compile health data on countries in the EU and other industrialized countries. This international benchmarking project uses international standards and definitions, verifies data, and develops uniform methodological guidelines. Valid comparative data will enable researchers to better understand how major changes to health care delivery affect health care quality (57). All nations stand to learn from the OECD health care project. Expenditures for Health Care Services
The United States spends a greater share of its GDP on health care than any other country. Data for 2005 from the OECD for its 30 member countries show that although the United States spent 15.3% of its GDP on health care, other industrialized countries were spending 8% to 11%, with an average of 9.0% (58). Table 1 shows that the United States spent $6401 per capita on health in 2005, far more per person than any other country. Switzerland, with the next highest per capita health spending, spent only two thirds as much, $4177 per person. Other industrial countries, including Canada, France, Germany, Japan, and the United Kingdom, spent about half as much per capita as the United States (59). The reasons for these differences are not easily understood. Despite far greater expenditures, the volume of medical services (for example, physician and hospital visits) used by U.S. residents is roughly comparable to that of the other 29 OECD countries. In 1996, only 12% of the U.S. population was hospitalized per year, compared with 16% on average in OECD countries. The United States has fewer inpatient hospital beds per 1000 people, but hospital stays are generally shorter and less frequent in the United States. The differences in total and per capita expenditures appear to be due primarily to higher prices in the United States and greater intensity of services, including greater use and earlier dispersion of technology (60). As a wealthy nation, the United States can devote a greater share of its national income on health care than can other countries. As wealth increases, individuals and society as a whole have greater means to purchase health care services, including services that in other countries might be considered discretionary or luxuries. Consequently, the United States adopts and disperses new medical technolwww.annals.org
Position Paper
ogy, such as computed tomography, magnetic resonance imaging, neonatal intensive care units, cardiac and coronary artery bypass grafting, angioplasty, and positron emission tomography, more readily and more rapidly than other countries (50). Although the United States produces and consumes more goods and services than any other country, resources still are limited and greater spending on health care will mean that less is available for other highpriority items, such as housing, education, and national defense, or will contribute to the escalation of the public debt. Administrative and Regulatory Costs
Differences in the definitions of administrative costs and methods for measuring them have resulted in widely differing estimates. For example, one study (61) estimated administrative and regulatory costs to be 31.0% of health care expenditures in the United States ($1059 per capita), as compared with Canada’s rate of 16.7 % ($307 per capita). However, OECD data for 2003 (Figure 3 [62]) indicate that the United States spent 7.3% of total national health expenditures on health administration and insurance costs; Germany spent 5.6%, and Canada spent 2.6%. Studies performed by the Centers for Medicare & Medicaid Services (CMS) show that gross administrative overhead for private U.S. health insurance was 14.3% in 2005 (18). The CMS data show that administrative costs for the 42 million enrollees covered by Medicare Part A (hospital insurance) were less than 1.6% of disbursements and were under 2.1% for the 40 million enrollees in Medicare Part B (supplemental medical insurance). The CMS reported that combined state and federal administrative costs for Medicaid were less than 1% of disbursements (18). While the estimates differ, they all show that administrative costs of private for-profit insurance plans in the United States are higher than those of Canada, other coun-
Figure 3. Percentage of national health expenditures spent on health administration and insurance, 2003.
Source: Commonwealth Fund National Scorecard on U.S. Health System Performance: Complete Chartpack (62) (www.commonwealthfund .org). *Data from 2002. †Data from 1999. ‡Data from 2001. §Includes claims administration, underwriting, marketing, profits, and other administrative costs; based on premiums minus claims expenses for private insurance. 1 January 2008 Annals of Internal Medicine Volume 148 • Number 1 63
Position Paper
High-Performance Health Care System with Universal Access
Figure 4. Percentage of health care costs paid out of pocket, 2004.
Quality and Outcomes of Health Care in Different Countries
Recent surveys of patient care experiences and patient ratings of various dimensions of care in the United States and 5 other countries (Australia, Canada, New Zealand, the United Kingdom, and Germany) show that patients rank the U.S. health care system lower than health systems of other countries on several key measures. People in these countries, whose physician workforces have a larger proportion of primary care physicians than the United States, see less need for a complete rebuilding of their health care systems, find their regular physicians’ advice to be helpful, and feel that they receive coordinated care. As Figure 5 shows, the United States had the poorest overall ranking and poorest rating on safe care, access, efficiency, equity, and healthy lives (64). Of 51 indicators of quality of care, the United States ranked first on only 6 indicators, including effectiveness of care, but last or tied for last on 27 (65). Table 1 compares some key health statistics for selected countries. Measures of health (life expectancy at birth, infant mortality, and deaths per 100 000 for diseases of the respiratory system and for diabetes) indicate that health in the United States is no better than in other industrialized countries, and in many cases is clearly worse, despite the higher level of U.S. expenditures (58). Some Health System Characteristics That May Explain International Differences in Health System Performance Commitment to Primary Care
Data are from a previous year for 2 countries: For the Slovak Republic, data are from 2003; for Japan, data are from 2002. Recent data are available only for 26 of the 30 Organization for Economic Co-operation and Development (OECD) countries. Source: Congressional Research Service based on OECD Health Data 2006 (October 2006).
tries, and nonprofit government programs in the United States. The differences reflect the added administrative costs incurred in the United States by private insurance companies for advertising, marketing, collecting premiums, and profits. Out-of-Pocket Costs
In the United States, out-of-pocket spending by patients accounts for 13.2% of total health care spending, a figure that is less than the 14.9% share in Canada. Although the Canadian national health program does not have cost sharing for covered health care services, Canada does not cover prescription drugs provided outside of hospitals. Figure 4 shows that out-of-pocket spending in the United States also accounts for a smaller share of total health spending than in most other OECD countries, for which the average is 19.8. However, out-of-pocket expenditures in the United States are still higher in absolute terms compared with other countries. Differences in costsharing requirements and covered services in insurance plans account for much of these differences among countries (63). 64 1 January 2008 Annals of Internal Medicine Volume 148 • Number 1
Most strongly performing health care systems have strong primary care. Indeed, it is at the center of these countries’ systems. Strong primary care systems and practice characteristics are associated with improved population health. Systems that enhance the provision of primary health care are associated with better overall mortality rates, including premature death from asthma and bronchitis, emphysema and pneumonia, and cardiovascular disease (66). Access to primary care also is associated with a more equitable distribution of health in populations (67). Yet, the United States is in the midst of a primary health care workforce crisis and may not have a sufficient supply of primary care physicians to meet future needs. Control over Workforce Supply
Control over the supply of different types of physicians is another characteristic of well-performing health care systems. In the United Kingdom and Canada, countries with single-payer systems, the government has leverage to manipulate the health care workforce supply, including controlling both training capacity and employment opportunities. In the United States, the federal government’s primary policy for influencing physician supply is through Medicare reimbursement of graduate medical education residency training positions. The United States also has limited funding to support primary care training programs (Title VII) and scholarship programs with service www.annals.org
High-Performance Health Care System with Universal Access
obligations, such as the National Health Service Corps, Uniformed Services, and Indian Health Service.
Widespread Implementation of Electronic Medical Records
Compared with countries with well-performing health care systems, the United States lags seriously in the implementation of EMR systems in office practice. Compared with primary care doctors in 6 other countries, U.S. physicians are among the least likely to have extensive clinical information systems. In 2006, nearly all primary care doctors in the Netherlands (98%), and 79% to 92% of doctors in Australia, New Zealand, and the United Kingdom, have EMR systems, while the rate was only 28% in the United States and 23% in Canada. Most doctors in countries with high rates of EMR systems routinely use them to electronically order tests, prescribe medications, and access patients’ test results. Compared with doctors in the United States, doctors in these countries are more likely to receive computerized alerts about potential problems concerning drug dosages and interactions, have reminder systems to notify patients about preventive or follow-up care, and (except for the Netherlands) receive prompts to provide patients with test results. More than 60% of the doctors in the 4 countries with high EMR use, as well as those in Germany (where 42% have EMR systems), say it is easy to generate lists of patients by diagnosis or health risk; in contrast, only 37% of U.S. doctors say it is easy, and 60% say it is somewhat difficult or worse to generate such lists. Likewise, doctors in countries with high rates of EMR systems are 2 to 4 times as likely to say it is easy to generate lists of patients who are due or overdue for tests or preventive care; only 20% of doctors in the United States report that it is easy (68).
Position Paper
LESSONS FROM OTHER COUNTRIES AND ACP RECOMMENDATIONS FOR REDESIGNING THE U.S. HEALTH CARE SYSTEM Analysis by the ACP of health care in 12 other industrialized countries illustrates various approaches to assuring universal access to high-quality health care. Each system has provided comparable or better health care at less cost than in the United States. The United States has much to learn from these countries. The following section describes key lessons from these countries and recommendations that build on these lessons. Figure 6 summarizes the lessons learned and the recommendations that flow from them. Paying for Health Care
Lesson 1: Well-functioning health systems all guarantee that all residents will have access to affordable health coverage for a defined set of benefits (that is, universal coverage). Countries have used different strategies to achieve universal coverage. Some have opted for a system funded solely by the national or provincial governments (single-payer systems, as in Canada, United Kingdom, Japan, and Taiwan), while others have a mix of public and private sources of funding (pluralistic systems, as in Australia, Belgium, Denmark, France, Germany, the Netherlands, New Zealand, and Switzerland). Lesson 2: Global budgets (Canada, Germany, New Zealand, Taiwan, the United Kingdom, and the U.S. Veterans Administration) can help restrain health care costs but do not provide effective incentives for improved efficiency unless the annual expense budget is reasonable and the target region is small enough to motivate individual providers to avoid overutilization of services. Lesson 3: Cost savings can be achieved through the use
Figure 5. Commonwealth Fund overall rankings of 6 countries, according to key indicators of performance.
Source: Calculated by the Commonwealth Fund based on the Commonwealth Fund 2004 International Health Policy Survey, the Commonwealth Fund 2005 International Health Policy Survey of Sicker Adults, the 2006 Commonwealth Fund International Health Policy Survey of Primary Care Physicians, and the Commonwealth Fund Commission on a High Performance Health System National Scorecard (65) (www.commonwealthfund.org). *Data from 2003. www.annals.org
1 January 2008 Annals of Internal Medicine Volume 148 • Number 1 65
Position Paper
High-Performance Health Care System with Universal Access
Figure 6. Lessons learned and resulting American College of Physicians policy recommendations. Lesson
Recommendation
Well-functioning health systems guarantee that all residents have access to affordable health care. Countries differ in how they have chosen to achieve universal coverage; some have opted for a system funded solely by the national or provincial governments, whereas most others have opted for models that include a mix of public and private sources of funding.
Provide universal health insurance coverage to ensure that all people within the United States have equitable access to appropriate health care. Federal and state governments should consider adopting one of the following pathways:
Global budgets can help restrain health care costs, but do not provide incentives for improved efficiency unless they are set reasonably and targeted to small enough groups. Cost savings can be achieved through the use of government power to negotiate prices but may result in shortages of services subject to price controls, delays in obtaining elective procedures, cost-shifting, and creation of parallel private sector markets.
Single-payer systems, which generally have the advantage of being more equitable, with lower administrative costs than systems using private health insurance, lower per capita health care expenditures, high levels of consumer/patient satisfaction, and high performance on measures of quality and access. Such systems typically rely on global budgets and price negotiation to help restrain health care expenditures, which may result in shortages of services and delays in obtaining elective procedures and limit individuals’ freedom to make their own health care choices. Pluralistic systems, which can be designed to assure universal access while allowing individuals the freedom to purchase private supplemental coverage. Such systems are more likely to result in inequities in coverage and higher administrative costs.
In countries with shared authority between national and regional governments, universal coverage can be achieved by providing financial support from the national government to efforts by regional governments to establish their own programs.
Congress should encourage state innovation by providing dedicated federal funds to support state-based programs to cover all uninsured persons within the state.
Cost-sharing, designed so that low-income individuals pay no or nominal amounts, can help restrain costs while assuring that poorer individuals are still able to access services.
Cost-sharing provisions should encourage patient cost-consciousness without deterring patients from receiving needed and appropriate services.
Societal investment in medical and other health professional education can help achieve a health care workforce that is balanced, well-trained, and in sufficient supply. Investment in primary and preventive care can result in better health outcomes, reduce costs, and may better assure an adequate supply of primary care physicians.
Develop a national health care workforce policy for the education and training of an adequate supply of health professionals to meet the nation’s health care needs, including primary care physicians.
Effective physician payment systems include support for the role of primary care physicians, incentives for quality improvement and reporting, and incentives for care coordination. Higher quality of care can be encouraged through establishment of performance measures, financial incentives, and active monitoring of performance.
Support initiatives that provide financial incentives to physicians for the voluntary achievement of evidence-based performance standards, to encourage quality improvement and reduction of avoidable medical errors, and incentives for systems performance that encourage comprehensive and continuous care coordination and prudent stewardship of health care resources.
Uniform billing systems and electronic processing of claims improve efficiency and reduce administrative expenses.
Support an interoperable health information technology infrastructure with federal funds to assist physicians in acquiring technology that will enhance delivery of evidence-based patient-centered care.
Redirect federal health care policy toward supporting patient-centered health care that builds upon the relationship between patients and their primary care physicians and the patient-centered medical home.
Reduce administrative and regulatory burdens, such as multiple and duplicative physician credentialing forms and multiplicity of types of insurance forms, and their attendant costs. Insufficient investments in research and medical technology result in reliance on outdated technologies and medical equipment and delay patients’ access to advances in medical science.
of government power to negotiate prices (Belgium, Canada, Japan, and the U.S. Veterans Administration) but may result in shortages of the services that are subject to price controls, delays in obtaining elective procedures, cost shifting, and creation of parallel private sector markets for health care services for those who can afford to buy services from sources not subject to price controls (Japan, New Zealand, and the United Kingdom). Lesson 4: Countries that have federal systems in which national and regional governments share authority can 66 1 January 2008 Annals of Internal Medicine Volume 148 • Number 1
Encourage public and private investments in all kinds of medical research, including research on the comparative effectiveness of different treatments, to foster continued innovation and improvements in health care.
achieve universal coverage by establishing a system in which regional governments receive substantial financial support from the national government but are free to establish their own programs. In Canada, federal support is subject to federal requirements for provinces to assure cross-border consistency in benefits and out-of-pocket costs and access to services across regional borders. Recommendation 1a: Provide universal health insurance coverage to assure that all people within the United States have equitable access to appropriate health care withwww.annals.org
High-Performance Health Care System with Universal Access
out unreasonable financial barriers. Health insurance coverage and benefits should be continuous and not dependent on place of residence or employment status. The ACP further recommends that the federal and state governments consider adopting one or the other of the following pathways to achieving universal coverage: 1. Single-payer financing models, in which one government entity is the sole third-party payer of health care costs, can achieve universal access to health care without barriers based on ability to pay. Single-payer systems generally have the advantage of being more equitable, with lower administrative costs than systems using private health insurance, lower per capita health care expenditures, high levels of consumer and patient satisfaction, and high performance on measures of quality and access. They may require a higher tax burden to support and maintain such systems, particularly as demographic changes reduce the number of younger workers paying into the system. Such systems typically rely on global budgets and price negotiation to help restrain health care expenditures, which may result in shortages of services and delays in obtaining elective procedures and limit individuals’ freedom to make their own health care choices. 2. Pluralistic systems, which involve government entities as well as multiple for-profit or not-for-profit private organizations, can assure universal access, while allowing individuals the freedom to purchase private supplemental coverage, but are more likely to result in inequities in coverage and higher administrative costs (Australia and New Zealand). Pluralistic financing models must provide 1) a legal guarantee that all individuals have access to coverage and 2) sufficient government subsidies and funded coverage for those who cannot afford to purchase coverage through the private sector. (See the ACP’s proposal for expanding access to health insurance as an example of how a pluralistic system can achieve universal coverage [69].) Recommendation 1b: Provide everyone access to affordable coverage—whether provided through a singlepayer or pluralistic financing model—that includes coverage for a core package of benefits, including preventive services, primary care services—including but not limited to chronic illness management—and protection from catastrophic health care expenses. Recommendation 1c: Until there is political consensus for achieving universal coverage at a federal level, Congress should encourage state innovation by providing dedicated federal funds to support state-based programs with an explicit goal of covering all uninsured persons within the state. (See the ACP position paper, “State Experimentation with Reforms to Expand Access to Health Care” [70].) Comment: Universal health care insurance is necessary to ensure that everyone within the United States has access to needed health care services of high quality. The federal government should assure that all persons within the borders of the United States also have access to health care services without undue financial barriers and that health www.annals.org
Position Paper
care services provided are adequately reimbursed. The ACP recommends 2 alternatives: a system funded solely or principally by government (federal and state), commonly known as a single-payer system, or a pluralistic system that incorporates existing public and private programs with additional guarantees of coverage and with sufficient subsidies and other protections to assure that coverage is available and affordable for all. The ACP has proposed a stepby-step plan that would achieve universal coverage while maintaining a pluralistic system of mixed public and private sector funding (69). Controlling Health Care Costs
Lesson 5: The best systems ensure access to health care without financial barriers. Cost sharing with co-payment schedules based on income, so that low-income individuals pay no or nominal amounts (Belgium, France, Japan, New Zealand, and Switzerland), can help restrain costs while assuring that poorer individuals can access services. Lesson 6: Incentives to encourage personal responsibility for health (Australia, Belgium, Japan, New Zealand, the Netherlands, Switzerland, and Taiwan) can lead to healthy behaviors, improved health outcomes, and responsible utilization of health care services. These countries restrain costs without punishing people who fail to adopt recommended behaviors or lifestyles. Recommendation 2: Create incentives to encourage patients to be prudent purchasers and to participate in their health care. Patients should have ready access to health information necessary for informed decision making. Cost-sharing provisions should be designed to encourage patient cost-consciousness without deterring patients from receiving needed and appropriate services or participating in their care. Comment: Consumer-directed health care—in which patients are actively involved in medical decision making and are prudent purchasers of health care—is one strategy for reducing health care costs and improving the efficiency of the health care system. However, for patients to make informed decisions, they must have access to pertinent, accurate, and understandable information. Health systems should provide easy access to information about the actual prices of medical services and available treatment options and patient education about health, diet and nutrition, and preventive health care. Patients should have access not only to information about their own health and treatment options but also to information that compares the effectiveness and costs of drugs, tests, and medical procedures. Public access to information about the qualifications and performance of physicians, hospitals, and other providers of health care services would also inform patient decision making. Achieving a transparent and interactive health information system that facilitates ready access to valid and reliable data will require collaboration between the public and private sectors (71). Greater cost sharing is one means to encourage pa1 January 2008 Annals of Internal Medicine Volume 148 • Number 1 67
Position Paper
High-Performance Health Care System with Universal Access
tients to be more prudent purchasers of health care. However, merely imposing greater cost-sharing requirements can reduce appropriate use of health care services. Increasing cost sharing can also create greater financial burdens and barriers to obtaining needed health care services. Increased cost sharing can increase inequities because it raises out-of-pocket costs. It can create financial burdens that especially affect low-income people. Out-of-pocket costs may cause patients to skip preventive health care services that could prevent more serious health problems and that ultimately would be cost-effective. Nevertheless, as their health care costs continue to rise, other countries are increasingly resorting to requiring patient cost sharing (France, Japan, New Zealand, and Switzerland). As yet, the impact of these measures on health is unknown. Another approach is to create positive incentives for patients to seek increased value for their health care dollar. Congress sought to achieve this objective by permitting individuals and their employers to make tax-free contributions to health savings accounts. The individual owns and controls these accounts and can use them to pay for “qualified medical expenses.” Unused funds in a health savings account grow year-to-year tax free, thereby creating further incentives for the individual to be prudent purchasers of health care services (72). Assuring a Health Care Workforce to Meet the Nation’s Health Care Needs
Lesson 7: Societal investment in health professional education, which would reduce the cost to students, can help achieve a health care workforce that has the right proportion of primary care physicians and subspecialists, is well trained, and is large enough to assure access to care (France, Germany, the United Kingdom, and the U.S. Veterans Administration). Lesson 8: Investment in primary and preventive care can result in better health outcomes, reduce costs, and may better assure an adequate supply of primary care physicians. These efforts can be further enhanced by assuring that all residents have equitable access to primary care physicians (Australia, Canada, Denmark, France, the Netherlands, New Zealand, Switzerland, and the United Kingdom) and utilizing the patient-centered primary care model (Denmark). Recommendation 3: Develop a national health care workforce policy that includes sufficient support to educate and train a supply of health professionals that meets the nation’s health care needs. To meet this goal, the nation’s workforce policy must focus on ensuring an adequate supply of primary and principal care physicians trained to manage care for the whole patient. The federal government must intervene to avert the impending catastrophic shortage of primary care physicians. A key element of workforce policy is setting specific targets for producing generalists and specialists and enacting policy to achieve those targets. Comment: All stakeholders must be involved in coor68 1 January 2008 Annals of Internal Medicine Volume 148 • Number 1
dinated workforce planning to ensure an adequate supply of health care professionals. This planning must include determining the workforce needs for all health care professionals, including physicians, nurses, and other health care professionals. The United States has a lower proportion of primary care physicians relative to other specialists than many other industrialized nations that score better on measures of cost and quality. The ACP is particularly concerned about the looming crisis in the supply of primary care physicians in the United States. Within the United States, states with more primary care physicians per capita have better health outcomes, including mortality from cancer, heart disease, or stroke (73, 74). In the United States, states with higher proportions of specialist physicians have higher per capita Medicare spending. Conversely, a greater number of primary care physicians is associated with increased quality of health services, as well as a reduction in costs (75). The preventive care that primary care physicians provide can help to reduce hospitalization rates (76). In fact, hospitalization rates and expenditures for conditions amenable to ambulatory care are higher in areas with fewer primary care physicians and limited access to primary care (77, 78). The supply of primary care physicians is also associated with an increase in life span (79, 80). Several countries appear to be exceptions to the rule that successful health systems have more primary care physicians. In particular, the relatively low percentages of primary care physicians reported for Denmark and the Netherlands stand out, even though both countries have policies to encourage patients to have a long-term relationship with a primary care physician. This anomaly may be an artifact of different methods for collecting and reporting workforce data despite the efforts of the OECD. Possibly, these countries rely more on physician extenders and the extensive use of EMRs to achieve better efficiency and fail to count as primary care physicians those who provide night coverage and what would be considered primary in-hospital care in the United States. Further research is needed to better understand these apparent exceptions. Another important issue to study is how the organization of care affects the rates of referrals to subspecialists—a key determinant of differences in per capita costs between geographic regions in the United States—in the United States and other countries. Workforce planning should strive to achieve a diverse workforce of health professionals that increases representation of ethnic and minority providers (81– 84). Consequently, federal and state funding should be continued and increased for programs and initiatives that strive to increase the number of health care providers in minority communities. National health workforce planning should also encourage medical and other health professional schools to revitalize efforts to improve matriculation and graduation rates of minority students and to recruit and retain minority faculty (85). All users and payers of health care must contribute their share to support medical education, which is a public www.annals.org
High-Performance Health Care System with Universal Access
good that benefits all of society. Undergraduate, graduate, and continuing medical education must have adequate funding. Most other countries finance medical school education with public funds, so that students pay little (the Netherlands) or no (Australia, Canada, France, Germany, Japan, and Switzerland) tuition and typically are responsible only for the cost of books and fees (86). In contrast, the average tuition in the United States in 2005 was $20 370 for public medical schools and $38 190 at private medical schools. Students and their families pay most of this cost. As a result, 85% of graduating medical students begin their careers with substantial educational debts. The average debt in 2005 was $105 000 for graduates of public medical institutions and $135 000 for graduates of private medical schools (87). Rising educational debt influences physician career choices and is one of the factors that discourage medical students from choosing a career in primary care (88). The long pipeline of medical education and training, the impending crisis in primary care, and the retirement and career changes of older physicians require the United States to take action to assure a constant influx of new students embarking on medical careers, particularly in primary care. Physician workforce planning should determine the nation’s current and future needs for appropriate numbers of physicians by specialty and among geographic areas. A national commission should provide a blueprint for action at the federal level to accomplish this task. Such planning would involve a systematic determination of residency training needs and guidance for allocation of federal funding support. Immediate and comprehensive reforms are needed to assure that the United States has enough primary care physicians to care for an aging population that will suffer from chronic diseases. A more detailed presentation of ACP recommendations concerning a national health workforce policy can be found in the position papers “Creating a New National Workforce for Internal Medicine” (89) and “The Impending Collapse of Primary Care Medicine and Its Implications for the State of the Nation’s Health Care” (48). Policies That Promote Patient-Centered Care
Lesson 9: Effective physician payment systems include adequate payment for primary care services, incentives for quality improvement and reporting (Belgium and the United Kingdom), recognizing geographic or local payment differences (Canada, Denmark, Germany, and the United Kingdom), and incentives for care coordination (Denmark and the Netherlands). Recommendation 4: Redirect federal health care policy toward supporting patient-centered health care that builds on the relationship between patients and their primary and principal care physicians and financially supports the patient-centered medical home, a practice system that the evidence suggests has the potential to improve health outwww.annals.org
Position Paper
comes, achieve more efficient use of resources, and reduce health care disparities. Comment: Principal care physicians provide the predominant source of care for a patient. Primary care physicians are principal care physicians, but so are other medical specialists and subspecialists when they are the patient’s principal source of care. In the position paper “A System in Need of Change: Restructuring Payment Policies to Support Patient-Centered Care” (90), the ACP proposes that the federal government take the lead in restructuring payment policies to achieve patient-centered health care. (The advanced medical home is a model— described in previous ACP position papers—that offers the benefits of a whole person– oriented personal physician who accepts overall responsibility for the care of the patient and leads a team that provides enhanced access to care, improved coordinated and integrated care, and increased efforts to ensure safety and quality. The American Academy of Family Physicians has proposed a similar model called the personal medical home. The ACP, American Academy of Family Physicians, American Academy of Pediatrics, and American Osteopathic Association have adopted a joint statement of principles that uses the patient-centered medical home as a common descriptor for both models. We will use the term patient-centered medical home, which is interchangeable with the term advanced medical home as described in other ACP position papers.) A patient-centered medical home is a medical practice in which: 1. Each patient has an ongoing relationship with a personal physician trained to provide first contact, continuous, and comprehensive care. 2. A personal physician leads a team of individuals at the practice level who collectively take responsibility for treating and managing care for the whole patient, rather than limiting practice to a single disease condition, organ system, or procedure. 3. Care is coordinated and/or integrated across all elements of the health care system (for example, subspecialty care, hospitals, home health agencies, nursing homes) and the patient’s community (for example, family, public, and private community-based services). 4. The practice consistently uses evidence-based medicine, clinical decision-support tools, health information exchange, and other means to guide decision making and to assure that patients get the indicated care when and where they need and want it in a culturally and linguistically appropriate manner. 5. Patients are involved in planning, decision making, and accountability for ongoing medical care. 6. Patients have enhanced access to care through such systems as open scheduling, expanded hours, and new options for communication between patients, their personal physician, and practice staff. 7. Practices go through a voluntary recognition process by an appropriate nongovernment entity to demonstrate 1 January 2008 Annals of Internal Medicine Volume 148 • Number 1 69
Position Paper
High-Performance Health Care System with Universal Access
that they have the capabilities to provide patient-centered services consistent with the medical home model. 8. Practices receive payments that appropriately recognize the added value provided to patients (91). The ACP has previously proposed a series of fundamental changes to improve the delivery of health care services. Patients should be encouraged or provided incentives to enroll in a medical home. Medical homes should meet standards of accessibility and care coordination. Position papers from the ACP provide greater detail on each of the following proposals: 1. Change payment policies to provide physician case management fees for care coordination services (92). 2. Encourage the use of EMRs (93). 3. Encourage the use of and exchange of electronic health care information (94). 4. Provide incentives for coordinated, patient-centered care (advanced medical home) (95). 5. Use evidence-based performance measures to improve the quality of care and providing incentives, including financial incentives, to reward physicians who meet or exceed standards (96). 6. Pay physicians for computer-based consultations (97). 7. Pay physicians for telephone consultations (98). 8. Promote professionalism and the patient–physician relationship, including physician responsibility to be prudent managers of resources (99). Measuring the Quality of Health Care
Lesson 10: Performance measures, financial incentives, and active monitoring of performance are key elements of health systems that provide high-quality care (Australia, New Zealand, the United Kingdom, and the U.S. Veterans Administration). Recommendation 5: Provide financial incentives for physicians to achieve evidence-based performance standards. The United States should consider revising existing volume-based payment systems used by Medicare and most private insurers to 1) better support physician– patient relationships by creating care coordination payments and other incentives for physicians working with health care teams to provide patient care management that includes comprehensive ongoing care and 2) maintain a fee-for-service component for separately identifiable visits and procedures, such as the bundled and hybrid payment structure used in Denmark and the Netherlands. Comment: The current physician payment system in the United States provides incentives for increasing the volume of physician services but few financial incentives for cost-effective or efficient care. It also better rewards physicians for the use of technological procedures as opposed to time-intensive services. Physician payment methods in the United States also provide little incentive for physicians to assume responsibility for being prudent managers of health care resources. A better payment model is 70 1 January 2008 Annals of Internal Medicine Volume 148 • Number 1
the blended approach as used in Denmark, where primary care physicians receive a capitated payment for providing care coordination and case management— by telephone or e-mail—as in a medical home, in addition to receiving fee-for-service payments for office visits. Achieving a well-functioning health care system that encourages quality improvement will require incentives to encourage change. Performance measurement, the objective assessment of how well physicians adhere to evidencebased standards to achieve desired outcomes, is increasingly being applied in the health care sector to improve the quality, safety, and accountability of medical care. Pay-forperformance programs utilize performance measures to enhance the quality of health care by rewarding physicians for adhering to evidence-based standards of care. The ACP policy and its analysis of performance measurement and pay-for-performance is presented in greater detail in 2 position papers, “The Use of Performance Measurements to Improve Physician Quality of Care” (96) and “Linking Physician Payments to Quality Care” (100). In these papers, the ACP warns that: Performance measures—if done right— have potential to assess physician performance, improve the quality of patient care, enhance the coordination and management of care, and reward physicians who meet or exceed the benchmarks set by performance measures. However, if applied in a bureaucratic, arbitrary, or punitive manner, performance measurement can hinder quality and harm patient care, undermine the physician–patient relationship, and cause physician frustration and career dissatisfaction (96).
Pay-for-performance systems should be evidencebased, transparent, fair, and equitable for practicing physicians. The ACP believes that the primary goal of such programs must be to promote continuously improving quality care across the health care delivery system. Accordingly, pay-for-performance programs should focus on the following: 1. Demonstrating that they lead to patient care that is safer and more effective as the result of program implementation. 2. Provide incentives for all physicians to perform better, continually raising the bar on quality. 3. Establishing or linking to technical assistance efforts and learning collaboratives so that all providers are motivated and helped to improve their performance. Major changes are needed to the current physician payment system in the United States to achieve a system that truly rewards quality improvement on evidence-based measures of care. Adding reimbursement tied to physician performance on top of the current payment system, unless substantial, will be inadequate to materially change the current level of physician performance. Instead, physician payment methods need fundamental redesign (as outlined www.annals.org
High-Performance Health Care System with Universal Access
in recommendation 5), so that physician reimbursement would no longer be based on volume and episodes of acute illnesses but on patient-centered, physician-guided care coordination and quality performance based on evidencebased clinical measures. Practice-based electronic health information systems (see recommendation 6 below) will facilitate the collection and reporting of patient data for measurement purposes, so that physicians can easily report and share information without further adding to administrative and paperwork burdens. Performance measures will not lead to quality improvement if physicians in practice lack the ability to incorporate proven quality improvement measures into their practices. Electronic Billing and Medical Records
Lesson 11: Adoption of a uniform billing system and electronic processing of claims improves efficiency and reduces administrative expenses (Germany, Canada, Taiwan, the United Kingdom, and most others, including the U.S. Veterans Administration). Recommendation 6: Reduce the costs of health care administration and the attendant burdens they place on patients and their physicians by creating uniform billing and credentialing systems across all payers. Recommendation 7: Support with federal funds an interoperable health information technology infrastructure that assists physicians in delivering evidence-based patientcentered care. Comment: Reducing paperwork, claims processing, and regulatory requirements could yield large savings. The ACP has long advocated measures to reduce administrative burdens and regulatory hassles (101). In a 1998 policy paper on the topic of hassles created by insurers (102), the American Society of Internal Medicine found the following: 1. Physicians are spending more time on insurance paperwork and less time seeing patients. 2. Physicians believe that insurers question their professional judgment too often. 3. Physicians have been forced to hire additional personnel to keep up with the abundant paperwork that insurance hassles create. The ACP continues to advocate the following longheld positions: 1. All health insurance industry forms should be uniform, with one form per task rather than a different form for the same task from every insurer (for example, a single durable medical equipment approval form and a single referral form). 2. All health care plans and hospitals should use one standard physician credentialing and recredentialing form. Comment: Electronic technology will allow automating payment and health insurance transactions without reliance on paper processing. Automated point-of-care transactions are made possible by using smart card technology www.annals.org
Position Paper
(similar to automated teller machine cards) that will automatically verify the individual’s coverage status, benefits, and required copayments and co-insurance, and bill the appropriate payer for care rendered and the individual for their required cost sharing on a debit basis. Denmark uses this system. Greater use of health information technology, use of EMRs, and implementation of systems to enable electronic prescribing can improve the quality of patient care, reduce medical errors, increase efficiency, reduce administrative costs, and achieve substantial cost savings. Coordination of patient care—which is the essence of the patient-centered primary care model recommended by the ACP—requires smooth transfer of information (with appropriate safeguards of patient privacy) among a team of providers. Use of interoperable health information technology systems in this model will help eliminate duplication of information gathering and testing and will promote care coordination. Denmark, Taiwan, and the Netherlands have an interoperable health information infrastructure that incorporates decision-support tools. Systems like these will enable physicians to obtain instantaneous information at the point of medical decision making and will enhance electronic communications among physicians, hospitals, pharmacies, diagnostic testing laboratories, and patients. Health information technology would support patient registries, enhance monitoring of patient adherence, increase access to laboratory and test results, provide prompts for physician and patient reminders and alerts, recommend treatment plans, and enable longitudinal charting of risk factors, utilization of services, and health outcomes (68). Health information technology could also enable ongoing, routine feedback from patients to the practice, using lowcost, Internet-based, patient-centered care surveys. This feedback could lead to targeted plans for practice improvement. However, physician practices in the United States lag far behind those in other developed countries in their capacity to access and share information electronically (68). Several barriers have slowed progress. The United States does not provide tax credits or incentives for implementing EMR systems and does not maintain an interoperable system for sharing health information. Medicare and other health care payers do not reimburse physicians for electronic consultations, even though they would cost much less than office visits. Barriers limiting physician adoption of systems of EMRs include not only the initial cost of required investments in the technology but also the disruption and possibly greater costs of time, training, and data entry involved in transferring paper to electronic records (103). Physicians are also hesitant to invest in systems that may not become the industry standard, that may not be able to communicate with other systems, and that may quickly become obsolete. Regulatory barriers and lack of interoperability also impede physicians from being able to transmit prescriptions electronically. Concerns about pro1 January 2008 Annals of Internal Medicine Volume 148 • Number 1 71
Position Paper
High-Performance Health Care System with Universal Access
tecting patient privacy also limit electronic access to medical and hospital records and to laboratory and diagnostic test results.
ogy assessments, and to foster international cooperation in sharing information.
Dealing with New Medical Care Technology
SUMMARY
Lesson 12: Insufficient investments in research and medical technology result in reliance on outdated technologies and medical equipment, and delay patients’ access to advances in medical science (Canada and the United Kingdom). Recommendation 8: Encourage public and private investments in all kinds of medical research—including research on comparative effectiveness of different treatments—to foster continued innovation and improvements in health care. Comment: Investments in basic health research are critical to advance medical knowledge. The nation’s investments, in basic research both privately and through the National Institutes of Health, have led to important advances in medicine. The public benefits from discoveries that advance medical science as well as from the development of new pharmaceuticals, medical equipment, processes, and procedures. Incentives to continually invest in basic and clinical research are essential to progress. Another form of research has received less attention— and far less funding— but is necessary to properly evaluate the health consequences of advances in medical research: health services research and the scientific assessment of the safety, clinical effectiveness, and cost and benefits of health care technology. The United States must invest in health services research in order to determine the safety, effectiveness, and efficacy of medical tests and procedures, and to determine the comparative effectiveness— cost, value, and efficacy— of different treatment regimens and technologies. Information obtained from this research must be widely disseminated to guide health care providers to appropriately utilize new technologies and avoid inappropriate use. According to the AHRQ, “Health services research examines how people get access to health care, how much care costs, and what happens to patients as a result of this care. The main goals of health services research are to identify the most effective ways to organize, manage, finance, and deliver high quality care; reduce medical errors; and improve patient safety” (104). Many other countries that have national health insurance programs, such as the United Kingdom and Australia, perform evidence-based evaluations of new drugs and technology. Much of this information is shared through the Network of Agencies for Health Technology Assessment, of which the AHRQ is a member. To attain a well-functioning health care system, the United States should increase investment in technology assessments, comparative effectiveness, and health services research. The AHRQ must have adequate funding to support research, to disseminate the results of health services research and technol-
Health care in the United States has many positive features and in many respects is superb compared with health care anywhere else in the world. Those with adequate health insurance coverage or sufficient financial means have access to the latest technology and the best care. However, as this paper points out, the U.S. health care system is inefficient and inconsistent: Health care quality and access vary widely both geographically among populations, some services are overutilized, and costs are far in excess of those in other countries. Moreover, the United States ranks lower than other industrialized countries on many of the most important measures of health. Current international comparisons of measures of health (life expectancy at birth, infant mortality, and deaths per 100 000 for diseases of the respiratory system and for diabetes) indicate that population health in the United States is not better than in other industrialized countries despite the greater U.S. expenditures (58). The experience and innovations of health care systems in other countries provide many lessons as the United States tries to improve its health system. Among these lessons are the value of an orientation and emphasis on patient-centered primary care and the importance of assuring a well-educated physician workforce that meets the country’s need for primary care physicians. The quality and accessibility of health care in the United States could be improved by adopting reimbursement programs like those in other countries that provide substantial rewards based on performance on quality metrics and care coordination rather than solely on the volume of services provided. These payment systems together with national workforce planning might also help address the impending primary health care workforce shortages in the United States. Universal and compulsory health insurance coverage could eliminate many of the disparities and inequities in the United States. Expanded use of health information technology and substantial governmental investments and support for a health information technology infrastructure with appropriate patient privacy protections could enhance health care decision making by physicians and patients and would bolster the growing movement for consumerdirected health care. These are some of the lessons we can learn from other industrialized countries. Other lessons for a more efficiently functioning health care system include achieving lower administrative costs by standardizing coverage and insurance transactions; providing coverage through publicly funded programs rather than private insurance; and automating transactions among providers, patient, and insurers. This article does not address many other issues in depth. Topics for further in-depth analysis include the costs and impact of malpractice liabil-
72 1 January 2008 Annals of Internal Medicine Volume 148 • Number 1
AND
CONCLUSIONS
www.annals.org
High-Performance Health Care System with Universal Access
ity insurance, determination of prescription drug prices, differences in medical education (including costs and student debt), financing long-term care, and physician earnings and income. The United States may also benefit by examining how other countries manage end-of-life care, determine the distribution of health care resources, and make decisions on coverage and benefits. The ACP has offered a series of recommendations to achieve a well-functioning health care system. All Americans should have access to a primary care physician and should have a patient-centered medical home for their ongoing, continuous, comprehensive, and coordinated care. All Americans should have health insurance coverage that includes preventive and primary care services, as well as protection from catastrophic health care costs. Federal health policy should support the patient-centered primary care model. The United States lacks a national health care workforce policy. It should provide for sufficient support for the infrastructure required to educate and train an adequate supply of health professionals that would properly meet the nation’s health care needs, including primary and principal care physicians that are trained to manage care of the whole patient. Workforce planning should specify an appropriate mix of physicians between primary and specialty care and describe the policies required to achieve that goal. Public and private investments in research must continue to support advances in basic and clinical medical science as well as in health services research. Other ACP recommendations call for financial incentives to encourage quality improvement and reduction of avoidable medical errors, support for a health information technology infrastructure to assist patients and physicians in making informed decisions about the appropriate use of health care services, and use of technology to achieve a more efficient health care system. The main lesson of this article is that many countries have better functioning, lower cost health care systems that outperform the United States. We must learn from them. Requests for Single Reprints: Customer Service, American College of Physicians, 190 N. Independence Mall West, Philadelphia, PA 19106.
References 1. U.S. Bureau of the Census. Income, poverty, and health insurance coverage in the United States. Washington, DC: U.S. Department of Commerce, Bureau of the Census; 2006. 2. Centers for Disease Control and Prevention. Lack of health insurance and type of coverage. early release of selected estimates based on data from the 2006 National Health Interview Survey. Atlanta: Centers for Disease Control and Prevention; June 2007. 3. Families USA. Wrong direction: one out of three Americans are uninsured. Publication no. 07-108; 2007. Accessed at www.familiesusa.org/resources /publications/reports/wrong-direction.html on 28 September 2007. 4. Schoen C, Doty MM, Collins SR, Holmgren AL. Insured but not protected: how many adults are underinsured? Health Aff (Millwood). 2005;Suppl Web Exclusives:W5-289-W5-302. [PMID: 15956055] 5. Ayanian JZ, Weissman JS, Schneider EC, Ginsburg JA, Zaslavsky AM. Unmet health needs of uninsured adults in the United States. JAMA. 2000;284: www.annals.org
Position Paper
2061-9. [PMID: 11042754] 6. McWilliams JM, Meara E, Zaslavsky AM, Ayanian JZ. Use of health services by previously uninsured Medicare beneficiaries. N Engl J Med. 2007;357:14353. [PMID: 17625126] 7. Wennberg JE, Cooper MM. The Dartmouth Atlas of Health Care 1999. Chicago: American Hospital Publishing; 1999. 8. Fisher ES, Wennberg DE, Stukel TA, Gottlieb DJ, Lucas FL, Pinder EL. The implications of regional variations in Medicare spending. Part 1: the content, quality, and accessibility of care. Ann Intern Med. 2003;138:273-87. [PMID: 12585825] 9. Sirovich BE, Gottlieb DJ, Welch HG, Fisher ES. Regional variations in health care intensity and physician perceptions of quality of care. Ann Intern Med. 2006;144:641-9. [PMID: 16670133] 10. Fisher ES, Wennberg DE, Stukel TA, Gottlieb DJ, Lucas FL, Pinder EL. The implications of regional variations in Medicare spending. Part 2: health outcomes and satisfaction with care. Ann Intern Med. 2003;138:288-98. [PMID: 12585826] 11. McGlynn EA, Asch SM, Adams J, Keesey J, Hicks J, DeCristofaro A, et al. The quality of health care delivered to adults in the United States. N Engl J Med. 2003;348:2635-45. [PMID: 12826639] 12. Institute of Medicine. To Err Is Human: Building a Safer Health System. Washington, DC: National Academies Pr; 2000. 13. Institute of Medicine. Crossing the Quality Chasm: A New Health System for the 21st Century. Washington, DC: National Academies Pr; 2001. 14. Wu S, Green A. Projection of Chronic Illness Prevalence and Cost Inflation. Santa Monica, CA: RAND Health; October 2000. 15. Anderson GF. Medicare and chronic conditions. N Engl J Med. 2005;353: 305-9. [PMID: 16034019] 16. Agency for Healthcare Research and Quality. 2005 national healthcare disparities report. Rockville, MD: U.S. Department of Health and Human Services, Agency for Healthcare Research and Quality; December 2005. AHRQ publication no. 06-0017. 17. Borger C, Smith S, Truffer C, Keehan S, Sisko A, Poisal J, et al. Health spending projections through 2015: changes on the horizon. Health Aff (Millwood). 2006;25:w61-73. [PMID: 16495287] 18. Centers for Medicare & Medicaid Services. Office of the Actuary, National Health Statistics Group. National health expenditures aggregate, per capita, percent distribution, and annual percent change by source of funds: calendar years 1960-2005. Accessed at www.cms.hhs.gov/NationalHealthExpendData/down loads/tables.pdf on 30 January 2007. 19. Williams B, Dulio A, Claypool H, Perry MJ, Cooper BS. Waiting for Medicare: experience of uninsured people with disabilities in the two-year waiting period for Medicare. Christopher Reeve Paralysis Foundation and the Commonwealth Fund; October 2004. Accessed at www.cmwf.org/usr_doc/786_Williams _waiting_for_Medicare.pdf on 2 November 2007. 20. Centers for Medicare & Medicaid Services. National health expenditures accounts: definitions, sources, and methods used in the NHEA 2005. Accessed at www.cms.hhs.gov/NationalHealthExpendData/downloads/dsm-05.pdf on 19 May 2007. 21. Kaiser Family Foundation and Health Education Trust. Employer health benefits 2005 annual survey. Accessed at www.kff.org/insurance/7315/index.cfm on 15 August 2006. 22. Centers for Medicare & Medicaid Services. Office of the Actuary, National Health Statistics Group. National health expenditure data, historical. The nation’s health dollar, calendar year 2005—where it went, where it came from. Accessed at www.cms.hhs.gov/NationalHealthExpendData/downloads/PieChart SourcesExpenditures2005.pdf on 30 January 2007. 23. U.S. Bureau of the Census. Income, poverty and health insurance coverage in the United States. Washington, DC: U.S. Department of Commerce, Bureau of the Census; 2006. 24. By 2005 average family premium reached over $10,000 per year, health agency says. BNA. Health Care Daily Report. 20 August 2007;12. 25. Crimmel BL, Taylor AK, Zawacki AM. Changes in co-pays for employersponsored health insurance plans, 1999-2003. June 2006. Agency for Healthcare Research and Quality. Statistical brief no. 127. Accessed at www.meps.ahrq.gov /mepsweb/data_files/publications/st127/stat127.pdf on 10 August 2007. 26. Sommers JP. Medical Expenditure Panel Survey: co-pays, deductibles, and coinsurance percentages for employer-sponsored health insurance in the nonfederal workforce, by industry classification, 2005. August 2007. Agency for Healthcare Research and Quality. Statistical brief 182. Accessed at www.meps 1 January 2008 Annals of Internal Medicine Volume 148 • Number 1 73
Position Paper
High-Performance Health Care System with Universal Access
.ahrq.gov/mepsweb/data_files/publications/st182/stat182.pdf on 30 August 2007. 27. Braithwaite RS, Rosen AB. Linking cost sharing to value: an unrivaled yet unrealized public health opportunity. Ann Intern Med. 2007;146:602-5. [PMID: 17438319] 28. Dubay L, Holahan J, Cook A. The uninsured and the affordability of health insurance coverage. Health Aff (Millwood). 2007;26:w22-30. [PMID: 17138578] 29. Farber J, Siu A, Bloom P. How much time do physicians spend providing care outside of office visits? Ann Intern Med. 2007;147:693-8. [PMID: 18025449] 30. Centers for Medicare & Medicaid Services. National health expenditure data, historical. Accessed at www.cms.hhs.gov/NationalHealthExpendData /02_NationalHealthAccountsHistorical.asp#TopOfPage on 29 August 2007. 31. Centers for Medicare & Medicaid Services. Overview, national SCHIP policy, SCHIP and NHE summary including share of GDP, CY 1960-2004. Accessed at www.cms.hhs.gov/NationalSCHIPPolicy/ on 29 August 2007. 32. Centers for Medicare & Medicaid Services. Medicare & you 2008. Accessed at www.medicare.gov/Publications/Pubs/pdf/10050.pdf on 5 October 2007. 33. Rowland D. Medicaid—implications for the health safety net. N Engl J Med. 2005;353:1439-41. [PMID: 16207845] 34. Centers for Medicare & Medicaid Services. Medicaid at-a-glance 2005: a Medicaid information source. Accessed at www.cms.hhs.gov/MedicaidGenInfo /Downloads/MedicaidAtAGlance2005.pdf on 14 August 2006. 35. Panangala SV. Congressional Research Service. Veterans’ medical care: FY2007 appropriations. CRS Report for Congress. 8 May 2006; #RL33409. 36. Iglehart JK. Reform of the Veterans Affairs heath care system. N Engl J Med. 1996;335:1407-11. [PMID: 8857026] 37. Asch SM, McGlynn EA, Hogan MM, Hayward RA, Shekelle P, Rubenstein L, et al. Comparison of quality of care for patients in the Veterans Health Administration and patients in a national sample. Ann Intern Med. 2004;141: 938-45. [PMID: 15611491] 38. Jha AK, Perlin JB, Kizer KW, Dudley RA. Effect of the transformation of the Veterans Affairs Health Care System on the quality of care. N Engl J Med. 2003;348:2218-27. [PMID: 12773650] 39. Long JA, Polsky D, Metlay JP. Changes in veterans’ use of outpatient care from 1992 to 2000. Am J Public Health. 2005;95:2246-51. [PMID: 16257943] 40. U.S. Department of Veterans Affairs. VA and spinal cord injury. Fact Sheet. May 2005. Accessed at www1.va.gov/opa/fact/spinalcfs.asp on 7 November 2007. 41. U.S. General Accounting Office. VA and DOD health care: factors contributing to reduced pharmacy costs and continuing challenges. Testimony before the Subcommittee on National Security, Veterans Affairs and International Relations. Washington, DC: U.S. General Accounting Office; July 2002: GAO-02969T. 42. Families USA. No bargain: Medicare drug plans deliver high prices. Publication no. 07-101, January 2007. Accessed at www.familiesusa.org/assets/pdfs/no -bargain-medicare-drug.pdf in May 2007. 43. Lichtenberg FR. Older drugs, shorter lives? An examination of the health effects of the Veterans Health Administration formulary. New York: Center for Medical Progress; 2005: Medical Progress Report No. 2. 44. Doty MM, Edwards JN, Holmgren AL. Seeing Red: Americans Driven into Debt by Medical Bills. New York: The Commonwealth Fund; August 2005. 45. Merlis M, Gould D, Mahato B. Rising out-of-pocket spending on medical care: a growing strain on family budgets. New York: The Commonwealth Fund; February 2006. Publication no. 887. 46. Hsu J, Price M, Huang J, Brand R, Fung V, Hui R, et al. Unintended consequences of caps on Medicare drug benefits. N Engl J Med. 2006;354:234959. [PMID: 16738271] 47. U.S. Government Accountability Office. Public payers face burden of entitlement program growth, while all payers face rising prices and increasing use of services: testimony of A. Bruce Steinwald to the Subcommittee on Military Construction, Veterans Affairs, and Related Agencies, Committee on Appropriations, House of Representatives. Washington, DC: U.S. Government Accountability Office; 15 February 2007. GAO-07-497T. Accessed at www.gao.gov/new.items /d07497t.pdf on 1 August 2007. 48. American College of Physicians. The impending collapse of primary care medicine and its implications for the state of the nation’s health care. 30 January 2006. Accessed at www.acponline.org/hpp/statehc06_1.pdf on 6 November 2007. 74 1 January 2008 Annals of Internal Medicine Volume 148 • Number 1
49. Bodenheimer T. Primary care—will it survive? N Engl J Med. 2006;355: 861-4. [PMID: 16943396] 50. Bodenheimer T. High and rising health care costs. Part 2: technologic innovation. Ann Intern Med. 2005;142:932-7. [PMID: 15941701] 51. Cutler DM, McClellan M. Is technological change in medicine worth it? Health Aff (Millwood). 2001;20:11-29. [PMID: 11558696] 52. Commonwealth Fund Commission on a High Performance Health System. Framework For A High Performance Health System For The United States, August 2006. Accessed at www.cmwf.org on 9 January 2007. 53. Commonwealth Fund Commission on a High Performance Health System. Why not the best? Results from a national scorecard on U.S. health system performance. September 2006. Accessed at www.cmwf.org on 9 January 2007. 54. Schoen C, How SK. National scorecard on U.S. health system performance: technical report. Commonwealth Fund Commission on a High Performance Health System. 2006. Accessed at www.commonwealthfund.org/usr_doc /Schoen_natscorecard_techrpt_954.pdf?section⫽4039 on 4 October 2007. 55. United Health Foundation. America’s health rankings: a call to action for people & their communities. 2006. Accessed at www.unitedhealthfoundation.org /ahr.html on 15 August 2007. 56. Wilson JF. Lessons for health care could be found abroad. Ann Intern Med. 2007;146:473-6. [PMID: 17371900] 57. Organization for Economic Co-operation and Development. Joint OECDEurostat-WHO health accounts data-collection initiative launched. OECD Health Update. January 2006;1. Accessed at www.oecd.org/dataoecd/13/32 /36040504.pdf on 5 April 2007. 58. Organization for Economic Co-operation and Development. OECD Health Data 2006: frequently requested data. Accessed at www.oecd.org/document/16/0,2340,en_2649_37407_2085200_1_1_1_37407,00.html on 9 August 2006. 59. Organization for Economic Co-operation and Development. Total expenditures per capita, June 2006. Accessed at www.oecd.org/document/16 /0,2340,en_2649_37407_2085200_1_1_1_37407,00.html on 8 August 2006. 60. Anell A, Willis M. International comparison of health care systems using resource profiles. Bull World Health Organ. 2000;78:770-8. [PMID: 10916914] 61. Woolhandler S, Campbell T, Himmelstein DU. Costs of health care administration in the United States and Canada. N Engl J Med. 2003;349:768-75. [PMID: 12930930] 62. Schoen C, How SK. National scorecard on U.S. health system performance: complete chartpack. Commonwealth Fund. 2003; p. 34. Accessed at www .commonwealthfund.org/usr_doc/Schoen_natscorecard_chartpack_955.pdf ?section⫽4039 on 4 October 2007. 63. Peterson CL, Burton R. U.S. health care spending: comparison with other OECD countries. Congressional Research Service. 2007. Accessed at http: //digitalcommons.ilr.cornell.edu/cgi/viewcontent .cgi?article⫽1316&context⫽key_workplace on 2 October 2007. 64. Schoen C, Osborn R, Huynh PT, Doty M, Zapert K, Peugh J, et al. Taking the pulse of health care systems: experiences of patients with health problems in six countries. Health Aff (Millwood). 2005;Suppl Web Exclusives:W5509-25. [PMID: 16269444] 65. Davis K, Schoen C, Schoenbaum SC, Audet AJ, Doty MM, Holmgren AL, et al. Mirror, mirror on the wall: an update on the quality of American health care through the patient’s lens. The Commonwealth Fund. April 2006. Accessed at www.cmwf.org/publications/publications_show.htm?doc_id⫽364436 on 9 August 2006. 66. Macinko J, Starfield B, Shi L. The contribution of primary care systems to health outcomes within Organization for Economic Cooperation and Development (OECD) countries, 1970-1998. Health Serv Res. 2003;38:831-65. [PMID: 12822915] 67. Starfield B, Shi L, Macinko J. Contribution of primary care to health systems and health. Milbank Q. 2005;83:457-502. [PMID: 16202000] 68. Schoen C, Osborn R, Huynh PT, Doty M, Peugh J, Zapert K. On the front lines of care: primary care doctors’ office systems, experiences, and views in seven countries. Health Aff (Millwood). 2006;25:w555-71. [PMID: 17102164] 69. American College of Physicians–American Society of Internal Medicine. Achieving affordable health insurance coverage for all within seven years. A proposal from America’s internists. Philadelphia: American College of Physicians– American Society of Internal Medicine; 2002. Accessed at www.acponline.org /hpp/afford_7years.pdf on 6 November 2007. 70. American College of Physicians. State experimentation with reforms to expand access to health care: a summary of state efforts to reform health care and www.annals.org
High-Performance Health Care System with Universal Access recommendations from the American College of Physicians on key elements that should be included in any reform. Philadelphia: American College of Physicians; July 2007. Accessed at www.acponline.org/hpp/state_exp.pdf on 6 November 2007. 71. Clancy CM. Getting to ‘smart’ health care. Health Aff (Millwood). 2006;25: w589-92. [PMID: 17090557] 72. American College of Physicians. Consumer-directed health care and health savings accounts [policy monograph]. Philadelphia: American College of Physicians; 2005. Accessed at www.acponline.org/hpp/consumer_savings.pdf on 6 November 2007. 73. Shi L. The relationship between primary care and life chances. J Health Care Poor Underserved. 1992;3:321-35. [PMID: 1420668] 74. Shi L. Primary care, specialty care, and life chances. Int J Health Serv. 1994; 24:431-58. [PMID: 7928012] 75. Baicker K, Chandra A. Medicare spending, the physician workforce, and beneficiaries’ quality of care. Health Aff (Millwood). 2004;Suppl Web Exclusives: W184-97. [PMID: 15726699] 76. Bindman AB, Grumbach K, Osmond D, Komaromy M, Vranizan K, Lurie N, et al. Preventable hospitalizations and access to health care. JAMA. 1995;274: 305-11. [PMID: 7609259] 77. Parchman ML, Culler S. Primary care physicians and avoidable hospitalizations. J Fam Pract. 1994;39:123-8. [PMID: 8057062] 78. Basu J, Friedman B, Burstin H. Managed care and preventable hospitalization among Medicaid adults. Health Serv Res. 2004;39:489-510. [PMID: 15149475] 79. Vogel RL, Ackermann RJ. Is primary care physician supply correlated with health outcomes? Int J Health Serv. 1998;28:183-96. [PMID: 9493759] 80. Greenfield S, Nelson EC, Zubkoff M, Manning W, Rogers W, Kravitz RL, et al. Variations in resource utilization among medical specialties and systems of care. Results from the medical outcomes study. JAMA. 1992;267:1624-30. [PMID: 1542172] 81. Institute of Medicine. Unequal Treatment: Confronting Racial and Ethnic Disparities in Health Care. Washington, DC: National Academies Pr; 2002. 82. Betancourt JR. Eliminating racial and ethnic disparities in health care: what is the role of academic medicine? Acad Med. 2006;81:788-92. [PMID: 16936481] 83. Institute of Medicine. In the Nation’s Compelling Interest: Achieving Diversity in the Health Care Workforce. Washington, DC: National Academies Pr; 2004. 84. Powe NR, Cooper LA. Diversifying the racial and ethnic composition of the physician workforce. Ann Intern Med. 2004;141:223-4. [PMID: 15289221] 85. American College of Physicians. Racial and ethnic disparities in health care: a position paper of the American College of Physicians. Ann Intern Med. 2004; 141:226-32. [PMID: 15289223] 86. Institute of Medicine. Medical Education and Societal Needs: A Planning Report for Health Professions. Washington, DC: National Academies Pr; 1983. Accessed at http://books.nap.edu/openbook.php?record_id⫽729&chapselect⫽yo &page⫽R1 on 17 July 2007. 87. AAMC, medical education costs and student debt. Report of the AAMC Working Group on Medical Education Costs and Student Debt. Washington, DC: Association of American Medical Colleges; 2005. 88. Rosenblatt RA, Andrilla CH. The impact of U.S. medical students’ debt on their choice of primary care careers: an analysis of data from the 2002 medical school graduation questionnaire. Acad Med. 2005;80:815-9. [PMID: 16123459] 89. American College of Physicians. Creating a new national workforce for
www.annals.org
Position Paper
internal medicine. Philadelphia: American College of Physicians; 2006. Accessed at www.acponline.org/hpp/im_workforce.pdf on 6 November 2007. 90. American College of Physicians. A system in need of change: restructuring payment policies to support patient-centered care. Philadelphia: American College of Physicians; January 2007. Accessed at www.acponline.org/hpp /statehc07_5.pdf on 4 November 2007. 91. American Academy of Family Physicians, American Academy of Pediatrics, American College of Physicians, American Osteopathic Association. Joint principles of the patient-centered medical home. Accessed at www.acponline.org/hpp /approve_jp.pdf on 18 October 2007. 92. American College of Physicians. Patient-centered, physician-guided care for the chronically ill: the American College of Physicians prescription for change. Philadelphia: American College of Physicians; October 2004. Accessed at www .acponline.org/hpp/patcen_chronill.pdf on 4 November 2007. 93. American College of Physicians. The paperless medical office: digital technology’s potential for the internist. Philadelphia: American College of Physicians; March 2004. Accessed at www.acponline.org/ppvl/policies/e000977.pdf on 4 November 2007. 94. American College of Physicians. Enhancing the quality of patient care through interoperable exchange of electronic healthcare information. Philadelphia: American College of Physicians; April 2004. Accessed at www.acponline .org/hpp/quality_care.pdf on 4 November 2007. 95. American College of Physicians. The advanced medical home: a patientcentered, physician-guided model of health care. Philadelphia: American College of Physicians; January 2006. Accessed at www.acponline.org/hpp/statehc06_5 .pdf on 4 November 2007. 96. American College of Physicians. The use of performance measurements to improve physician quality of care. Philadelphia: American College of Physicians; March 2004. Accessed at www.acponline.org/hpp/performance_measure.pdf on on 4 November 2007. 97. American College of Physicians. The changing face of ambulatory medicine—reimbursing physicians for computer-based care. Philadelphia: American College of Physicians; March 2003. Accessed at www.acponline.org/ppvl/policies /e000920.pdf on 4 November 2007. 98. American College of Physicians–American Society of Internal Medicine. Telephone triage. Philadelphia: American College of Physicians–American Society of Internal Medicine; September 2000. Accessed at www.acponline.org/ppvl /policies/e000707.pdf on 4 November 2007. 99. American College of Physicians. Medical professionalism in the changing health care environment: revitalizing internal medicine by focusing on the patient-physician relationship. Philadelphia: American College of Physicians; April 2004. Accessed at www.acponline.org/ethics/changing.pdf. 100. American College of Physicians. Linking physician payments to quality care. Philadelphia: American College of Physicians; 2005. Accessed at www .acponline.org/hpp/link_pay.pdf on 6 November 2007. 101. American Society of Internal Medicine. America’s health care system strangling in red tape. Washington, DC: American Society of Internal Medicine; 1990. 102. American Society of Internal Medicine. America’s reducing the managed care hassle factor. Washington, DC: Amerian Society of Internal Medicine; 1998. 103. Baron RJ. Quality improvement with an electronic health record: achievable, but not automatic. Ann Intern Med. 2007;147:549-52. [PMID: 17938393] 104. Agency for Healthcare Research and Quality. Role and mission of the Agency for Healthcare Research and Quality. 2002. Accessed at www.ahrq.gov /about/annrpt02/annrpt02b.htm on 6 November 2007.
1 January 2008 Annals of Internal Medicine Volume 148 • Number 1 75