Quantising Contribution Effort in Online Communities Grégoire Burel
Yulan He
Knowledge Media Institute The Open University, UK
School of Engineering & Applied Science Aston University, UK
[email protected]
[email protected]
ABSTRACT We describe the Joint Effort-Topic (JET) model and the Author Joint Effort-Topic (αJET) model that estimate the effort required for users to contribute on different topics. We propose to learn word-level effort taking into account term preference over time and use it to set the priors of our models. Since there is no gold standard which can be easily built, we evaluate them by measuring their abilities to validate expected behaviours such as correlations between user contributions and the associated effort.
Categories and Subject Descriptors I.2.7 [Artificial Intelligence]: Natural Language Processing—Text analysis
1. INTRODUCTION Recently, much works have explored user behaviour in online communities. However, the effort users put into their contributions has not been quantitatively studied. Understanding the effort that each user requires in her contribution could help in identifying low effort topics as well as relatively high effort topics. In general, it is difficult to measure users’ effort. There has been some research work focusing on topics indirectly relating to effort modelling such as question complexity, user maturity [3] and user expertise [6, 4, 1]. We hypothesise that users tend to contribute uniformly over a short period of time and that any deviation from their normal contribution patterns indicates a change in the amount of work allocated to each of their contributions. We also assume that each user has her own preferred vocabulary and any vocabulary variations can be used as a proxy measure of effort. Following these assumptions, we propose two models which capture the effort required by users to contribute to different topics, the Joint Effort Topic (JET) model and its authored version, the Author Joint Effort Topic (αJET) model.
2. JOINT EFFORT TOPIC (JET) MODEL In this paper we define the concept of contribution effort as a value representing the amount of labour required for contributing or posting to a community (Definition 1). In other words, contribution effort is a measure of contribution ability rather than content complexity.
Copyright is held by the International World Wide Web Conference Committee (IW3C2). IW3C2 reserves the right to provide a hyperlink to the author’s site if the Material is used in electronic media. WWW’14 Companion, April 7–11, 2014, Seoul, Korea. ACM 978-1-4503-2745-9/14/04. http://dx.doi.org/10.1145/2567948.2576949.
In order to quantise effort, we assume that the contribution effort of a particular post can be decomposed into word-level effort. In particular, a user has a preferred set of vocabulary terms to use within a certain period of time. Words used more often during this period would incur lower contribution effort. On the contrary, words used less incur higher contribution effort. Therefore, we consider that the effort associated with a given contribution is correlated with the preference associated with particular vocabulary terms. The more a given term is contributed the less contribution effort it involves. On the contrary, the less a term is contributed the more the contribution effort incurred (H1). Similarly, we also assume that users’ average contribution effort within a certain time period should remain relatively stable (H2).
2.1
Measuring Effort with Stanines
For detecting changes in contribution effort, we use the concept of Stanines1 . Following H1 and H2, we calculate the effort of a document based on the distribution of word counts within the current time period and the distribution of the word counts during the last M time periods so that each word can be associated with an effort value ranging from 1 (high effort) to 9 (low effort). The effort of a given word can be calculated either for a full community or for each individual. For a given user, the effort e p,w associated with a given word w in period p can be calculated based on the deviation from the number of times the same word has been observed in the last M periods for the same user. We refer to the general effort measure as STAN and the author-specific effort measure as ASTAN.
2.2
JET and α JET For better accuracy, the effort of a document can then be modelled as a mixture of topic-level efforts. Therefore, We propose a Bayesian model which jointly models topics and topic-level efforts based on Latent Dirichlet Allocation (LDA) [2]. We could simply extend the previously proposed Joint Sentiment Topic (JST) [5] model and replace sentiment labels with effort labels. However, in JST, the sentiment prior knowledge comes from a fixed sentiment lexicon. In our case, the word-level effort prior is dynamically computed for each time period based on the aforementioned Stanine method. In addition, we also need to incorporate author information in order to enable the measure of author-specific effort. Furthermore, we propose to integrate period information in order to track effort evolution and allow the association of author topics with primary topics so that we can compare the topics and effort of different authors in different time periods more easily. As a result, we distinguish two different effort models: 1) The Joint Effort Topic (JET) model, the effort model that does not distinguish document authors, and; 1 Stanine (STAndard NINE) is a method of scaling test scores on a nine-point standard scale and is based on the concept of z-scores.
γ’
Ψ’ K’
γ
β’
Φ’
Ψ
w’
k’
w
k
f
β
Φ K’xE
ExK
γS
e
α
σ Nd D
fM M P A
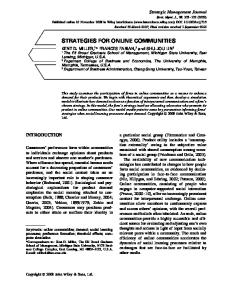
Figure 1: Joint Effort Topic (JET) model (without dashed plate) and Author Joint Effort Topic (αJET) model (with dashed plate). 2) The Author Joint Effort Topic model (αJET), the effort model that includes author informations (Figure 1). The generative process which corresponds to each model is presented as follow (the elements in bold are only valid for αJET): k0
draw ψk0 ∼ Dir(γ 0 ), (d1 , d2 , . . . , dD ), draw φd0
i
i
– choose a word wi = w0i from the distribution over words defined by the period p, the topic ki , the effort label ei and author a, wi ∼ ψa,p,ei ,ki .
HTn : µ > µ0
HTn : µ < µ0
Model
HTn
Cooking
JET
HT1 HT2 HT3 HT1 HT2 HT3
0.707 0.968 0.009257∗∗ 0.155 0.107 0.001958∗∗
0.354 0.516 0.004629∗∗ 0.07738. 0.946 0.999
0.646 0.484 0.995 0.923 0.05374. 0.0009789∗∗∗
HT1 HT2 HT3 HT1 HT2 HT3
0.06595. 0.489 0.08999. 1.4e−07∗∗∗ 0.994 2.2e−10∗∗∗
0.967 0.756 0.04499∗ 7.1e−08∗∗∗ 0.497 0.999999
0.03297∗ 0.244 0.955 0.999999 0.503 1.1e−10∗∗∗
αJET
SF
JET
αJET
Signif. codes: p-value < 0.001 *** 0.01 ** 0.05 * 0.1 .
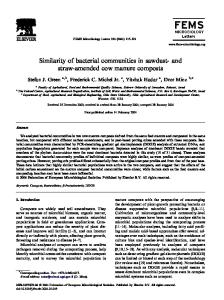
Table 1: Hypothesis testing using a t-test for JET and αJET for the Cooking (CO) and Server Fault (SF) datasets. Hypothesis: HT1 : Activity level (expected: µ > µ0 ); HT2 : Time to response (expected: µ < µ0 ), and; HT3 : Term preference (expected: µ < µ0 ).
Setting Model Priors
We use STAN and ASTAN as a rough estimation of word-level effort which can be subsequently used to set priors γs dynamically for JET and αJET. As a result, the effort associated with words and documents for a given time period and author can be biased. The bias permits an accurate repartition of the effort associated with words. Rather than directly using the effort index returned by STAN or ASTAN, we chose to smooth the word-level effort prior using a normal distribution centred around the effort index. This approach allows a soft assignment of effort label given a word. There are two special cases: 1) When p 6 M, there are not sufficient historical data to calculate the effort index; 2) When the current word has never appeared in the previous M periods. In both cases, a default uniform word prior is used. For other hyperparameters, we use uniform priors, α = β = β 0 = 10−4 and γ = γ 0 = 10−7 .
3.
P-values Hn : µ 6= µ0
Dataset
∈ {1..K 0 },
• For each primary topic • For each document d ∈ D = ∼ Dir(β 0 ), σd ∼ Dir(α); for each effort label e ∈ {1..E} (E = 9) and primary topic k0 , draw φd,k0 ,e ∼ Dir(β ). • For each period p ∈ P = {1..P} (e.g. day, month, year) with author a ∈ A = (a1 , a2 , . . . , aA ), for each effort label e ∈ {1..E} and for each effort topic k ∈ {1..K}, draw ψa,p,e,k ∼ Dir(γs ), • For each word position i in document d in period p, – choose a primary topic ki0 ∼ φd0 , an effort label ei ∼ σd , an effort-topic ki ∼ φd,k0 ,ei , a word w0i ∼ ψk0 0 ,
2.3
(post more messages) have lower effort than users that contribute less (HT1 ); 2) Users take more time to response on documents that require more effort (HT2 ),and; 3) Users have lower effort when using terms they are familiar with (HT3 ). We test each hypothesis on two Question Answering (Q&A) datasets extracted from the April 2011 Stack Exchange (SE) public dataset2 : Cooking (CO) and Server Fault (SF). We filter out stop words and words with a relative corpus frequency below 10−5 or higher than 0.99. Stemming is also applied. For the topics we set K 0 = 5 and K = 15. The expected behaviours are: 1) Activity level (HT1 ): Active users should be lower effort than less active users (µ > µ0 ) ; 2) Time to response (HT2 ): Fast responding users should have lower effort than slow respondents (µ < µ0 ) , and; 3) Term preference (HT3 ): Users that post using familiar terms should have lower effort than those that post using less familiar terms (µ < µ0 ). Looking at the results in Table 1, we deduce that αJET with priors derived from the Stanine based effort measure is inline with effort expectations and gives more accurate results than JET.
EVALUATION AND RESULTS
The lack of gold standard makes it hard to validate the proposed models. Although we cannot measure directly the accuracy of the model for predicting the effort of each user contributions, we can measure its ability to validate expected behaviours such as correlations between user contributions and the associated effort. In order to show the validity of the proposed models, we define a set three hypotheses and perform hypothesis testing on each of them. Our hypotheses are defined as follow: 1) Users who contribute a lot
Acknowledgments This work is partly funded by the EC-FP7 project Robust (grant number 257859) and the Shenzhen International Cooperation Research Funding (grant number GJHZ20120613110641217).
4. REFERENCES [1] E. Agichtein, C. Castillo, D. Donato, A. Gionis, and G. Mishne. Finding high-quality content in social media. In WSDM, 2008. [2] D. M. Blei, A. Y. Ng, and M. I. Jordan. Latent dirichlet allocation. J. Mach. Learn. Res., 3:993–1022, 2003. [3] G. Burel and Y. He. A question of complexity — Measuring the maturity of online enquiry communities. In Hypertext, 2013. [4] P. Jurczyk. Discovering authorities in question answer communities using link analysis. In CIKM, 2007. [5] C. Lin and Y. He. Joint Sentiment/Topic model for sentiment analysis. In CIKM, 2009. [6] J. Zhang, M. S. Ackerman, and L. Adamic. Expertise networks in online communities: structure and algorithms. In WWW, 2007.
2 http://www.clearbits.net/get/1698-apr-2011.torrent