Sizing Up Repo Arvind Krishnamurthy † Northwestern University
∗
Stefan Nagel ‡ Stanford University
Dmitry Orlov § Stanford University May 2013
ABSTRACT To understand which short-term debt markets suffered from “runs” during the financial crisis, we analyze a novel data set of repurchase agreements (repo), i.e., loans collateralized with securities, between non-bank cash lenders and dealer banks. We find that the collateral backing these repos prior to the crisis was largely composed of government securities rather than riskier private sector assets. The subsequent contraction in repo with private sector collateral was relatively small in aggregate, and relatively insignificant compared with the contraction in the asset-backed commercial paper market, but its effects were concentrated on a few most exposed dealer banks.
∗ We thank Peter Crane for providing data, and we are grateful for comments from Anat Admati, Tobias Adrian, Jeremy Bulow, Anna Cieslak, Darrell Duffie, Jacob Goldfield, Michael Fleming, Gary Gorton, Antoine Martin, Atif Mian, David Plecha, Philipp Schnabl, seminar participants at the Bank of Canada, Dartmouth, DePaul, University of Florida, Goethe University Frankfurt, Harvard, Loyola, New York Fed, Northwestern, University of Lugano, University of Minnesota, UNC Chapel Hill, UC San Diego, University of Southern California, Stanford, Wharton, University of Zurich, the American Economic Association Meetings, the NBER Monetary Economics and Capital Markets and the Economy workshops, the Stanford Institute for Theoretical Economics, and the Western Finance Association Meetings for useful comments. † Kellogg School of Management, Northwestern University, and NBER ‡ Graduate School of Business, Stanford University, NBER, and CEPR § Graduate School of Business, Stanford University
Short-term debt is widely understood to be a central factor in financial crises. Short-term debt can leave borrowers vulnerable to runs (Diamond and Dybvig (1983)) and rollover risk (Cole and Kehoe (2000), He and Xiong (2012)), which can lead to or exacerbate financial crises. In practice, there are many different forms of short-term debt, including bank deposits, short-term government debt, commercial paper and repurchase agreements. Financial crises in the U.S. during the 1800s, as well as the Great Depression, centered on runs on bank deposits (Bernanke (1983), Gorton (1988)). The Penn Central financial crisis of 1970 centered on the commercial paper market (Calomiris (1994)). The Asian financial crises of 1997 centered on the foreign-currency denominated short-term debt of Asian banks (Diamond and Rajan (2001)). Other international crises including the Mexican crisis of 1994 centered on the short-term liabilities of the government (Cole and Kehoe (1996)). While from a 50,000 foot view these crises are all about “short-term debt,” the economic mechanisms at work during a crisis differ depending on the specifics of the institutional setting. These specifics of a given crisis are also often critical in guiding responses by both the regulatory and private sector. The creation of the FDIC in 1934 was a direct response to the runs on depository institutions while the standard use of ratings and backup lines of credit in the commercial paper market were a response to the 1970 commercial paper crisis. Turning to the recent 2007-2009 crisis, there is initial suggestive evidence that the market for repurchase agreements (”repos”)—short-term loans collateralized with financial securities—may have played a central role. Gorton and Metrick (2010a, 2010b, 2011) document a rise in margin requirements (“haircuts”) in the repo market during the crisis and argue that the repo market suffered a run, which in turn amplified the financial crisis. At this point, however, little is known about the quantitative importance of such a run on repo nor the specific manner in which the repo market 1
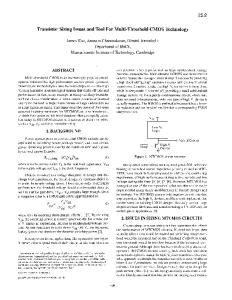
contributed to the financial crisis. Our objective is to fill this gap. We construct and study a far richer data set on repo than has thus far been available. The data comprise the repo transactions between two key repo lenders, money market funds (MMF) and security lenders (SL), and repo borrowers, primarily broker/dealers and banks. Gorton and Metrick hypothesize that repo played an important role in the funding of “shadow banks,” i.e., non-depository financial institutions, that transformed long-term and illiquid assets such as residential mortgages, auto loans, and credit card loans into short-term debt. These assets were packaged into private-label asset-backed securities (ABS), and the ABS in turn served as collateral in a chain of repo transactions with cash pools such as MMF and SL as the ultimate funding source at the end of the chain (see Figure 1). Further, when this collateral turned risky and illiquid at the onset of the 2007 financial crisis, the “depositors” in the repo market ran and lending to shadow banks collapsed. We examine this characterization using our detailed and novel data set. We seek to understand the nature of the collateral that depositors in the repo market accepted prior to the crisis, the extent to which they ran during the crisis, and the manner in which their behavior may have affected the shadow banking system. To understand the scope and limitations of our analysis, it is useful to discuss in more detail the funding flows in shadow banking depicted in Figure 1. There are two relevant parts of the repo market in the figure. The tri-party repo market that connects broker/dealers with non-bank cash investors like MMF and SL is the predominant way in which cash funding enters the shadow banking system through repo.1 In contrast, the bilateral repo market is largely a market through which funds are reallocated between dealers and between dealers and hedge funds. Our data allow a comprehensive analysis of the behavior of MMFs and SLs, who account for more than half of the lending in 1 These repos are called “tri-party” because a custodian bank, as the third party, safeguards the collateral on behalf of the cash lender.
2
!"&%
=&+12) !&%7/+/(2#
-(./(# "01.2#
!"&%
345#
!"&%
$6,+7(%+,# 8(9&#
$%&'(%) *(+,(%#
:$;4# <&1.067#
'()*+,(-.% /0+1% !!"#
!"#
%$>*(9&2672?# @AB#C:5D#
;+2F# 3(<0%6E(2# ;&,,+7(%+,## ,(1.(%#
Figure 1. Short-term Funding Flows in the Shadow Banking System. The biggest cash lenders to the shadow banking system are money market funds (MMF) and securities lenders (SL). MMF take short-term funds from retail investors, institutions and corporations, and promise to preserve a fixed $1 net asset value. SL are large institutional investors or custodians for institutional portfolios who lend securities to short-sellers and in return receive cash, as collateral, that they seek to reinvest. A substantial portion of funding provided by MMF and SL to the shadow banking system is provided in collateralized form with repurchase agreements (repo) or asset-backed commercial paper (ABCP). Repo is used by broker/dealers to fund their securities inventory, e.g. of asset-backed securities (ABS) and to fund repo loans that they provide to clients, e.g. hedge funds. ABCP is issued by special purpose vehicles (SPV) set up (usually by commercial banks) for the purpose of purchasing long-term ABS. The repos between MMF/SL and broker/dealers are typically tri-party repos, in which a custodian bank safeguards the collateral on behalf of the cash lender. Repos between broker/dealers and hedge funds are typically bilateral repos without a third party custodian to stand between.
3
the tri-party repo market. But, it is important to note that we lack data on the bilateral repo market, and thus the full picture on repo is yet to be assembled. One way of putting our results in context is to say that we characterize how repo depositors provided liquidity to the shadow banking system in aggregate. What is left to be understood is the role that repo played in the reallocation of liquidity among dealers and between dealers and hedge funds. As discussed below, our data does allow us to probe into dealer behavior to a limited extent and based on this we make some educated guesses regarding the behavior of the entire repo market.2 We start by examining the quantitative significance of repo deposits from MFFs and SLs in funding private sector assets prior to the crisis. If repo played an important role in driving the growth of shadow banking, as suggested by Gorton and Metrick, we should find that a substantial portion of outstanding ABS ended up as repo collateral with MMF and SL. We find however that only about 3% of outstanding private-label ABS ($151bn) are ultimately used as collateral to obtain repo financing from MMF and SL before the onset of the crisis. Most of the repo funding extended by MMF and SL is collateralized with Treasury or Agency-backed securities. In comparison, asset-backed commercial paper (“ABCP” in Figure 1) and direct holdings of privately securitized assets by MMF and SL play a more significant role than repo as short-term funding sources for private sector assets in the shadow banking system. In the period before the crisis, ABCP finances 23% of the outstanding private-label ABS, which is an order of magnitude larger than repo. 2 Existing statistics on aggregate repo volume in the U.S. such as the commonly cited Primary Dealer repo survey of the Federal Reserve are of only limited value in addressing these questions because they do not distinguish between the flows into the shadow banking system and the flows within the system. These volume statistics are computed by adding up all repos along the intermediation chain from non-banks to dealers and between dealers. The quantity of interdealer repo can be informative for understanding the counterparty exposures and funding flows among dealers, but not about how the shadow banking system funds itself in aggregate vis-a-vis non-banks.
4
As the crisis unfolds from 2007Q2 to 2009Q2, the total short-term funding of private-label ABS contracts by $1.4 trillion. Of this, $662bn is due to the reduction in outstanding ABCP while only $149bn of the contraction comes from the reduction of repo with private-label ABS collateral. The remainder comes from a contraction of direct holdings of private-label ABS by MMF and SL. Moreover, the contraction in short-term funding appears first in the ABCP market during the summer of 2007 (Covitz, Liang, and Suarez (2012)). In contrast, private-label ABS repo keeps growing until the collapse of Bear Stearns in 2008Q1. These findings are consistent with the view that a contraction in short-term debt markets played an important role in the collapse of funding of the shadow banking sector in aggregate, but they are inconsistent with the view that a run on repo played the central role. The more significant short-term debt contraction occurs in ABCP. This fact is important for understanding the mechanism through which the short-term debt contraction affected the financial system. While both ABCP and repo are collateralized forms of short-term debt, ABCP typically receives liquidity support guarantees from a commercial bank and hence the demise of the ABCP market affected commercial banks rather than the broker/dealer sector. The key role played by regulated banks in the ABCP market also gives greater weight to the regulatory arbitrage arguments of Acharya, Schnabl, and Suarez (2012) as being an important factor in driving the growth and fragility of the shadow banking system. While the contraction in tri-party repo with ABS collateral was quantitatively small relative to the aggregate balance sheet of the entire shadow banking system, our evidence that it collapses from $151bn pre-crisis to about $2bn in the first quarter of 2009 is qualitatively consistent with a run on repo, as suggested by Gorton and Metrick. Our data on MMF repo allows us to shed light on the nature of this run. We observe 5
the terms and the identity of the borrower in each repo agreement, and we present evidence that the withdrawal of MMF’s funding reflected an unwillingness to lend against risky or illiquid collateral and not an unwillingness to lend to specific counterparties. We probe further into the consequences of this run. It is possible that while the contraction in repo is small in aggregate, its effects may have been amplified if the contraction disproportionately affected systemically important institutions. We find evidence that is supportive of this channel. The contraction is concentrated among dealer banks that are most reliant on the private sector collateral in their repo funding from MMF at the outbreak of the crisis.3 These banks include Goldman Sachs, Morgan Stanley, Merrill Lynch, and Citigroup; in short, four of the key players in the financial sector. These dealer banks also have the highest perceived credit risk in September 2008. Moreover, we analyze the Federal Reserve’s emergency lending programs during the crisis, and find that the dealers most reliant on funding private collateral in the repo market are also the heaviest borrowers from the Federal Reserve. Putting all of this together, what happened in repo during the financial crisis? Our findings suggest that the run on repo backed by private sector collateral was not central to the collapse of short-term shadow bank funding in aggregate. For analyzing the economics of the role of repo in the demise of shadow banking, the analogy with a traditional bank run by non-bank depositors therefore seems less relevant. On the other hand, there is the evidence from Gorton and Metrick (2010a, 2011) that haircuts in the interdealer (bilateral) repo market rose dramatically in the crisis. This leaves open the possibility that repo may have played an important role in the allocation of liquidity between dealer banks and dealer banks and hedge funds. The economic mechanisms 3 It is difficult to pin down, however, how much of this was a causal effect of a refusal of repo lenders to extend funding against risky/illiquid collateral, and to what extent dependence on private collateral is just a symptom of weak capital positions, difficulty in obtaining unsecured funding, loss of brokerage business, and collateral calls by derivatives counterparties, as discussed in Duffie (2010).
6
in play in a run on repo by dealers may look different than a run by non-bank cash depositors. For example, the rise in interdealer haircuts could indicate a credit-crunch in which dealers act defensively given their own capital and liquidity problems, raising credit terms to their borrowers.4 As noted earlier, to fully understand what happened in the interdealer market, one needs quantity data on the bilateral market. To our knowledge, no such data exists either publicly or with regulators. The paper most related to ours is Copeland, Martin, and Walker (2011) who examine daily data on tri-party repo from July 2008 onwards. Their data has the advantage that it is high frequency, and, for example, sheds light on the Lehman Brothers failure. However, their sample is shorter and does not start until the middle of the financial crisis. We are particularly interested in understanding how the private-label ABS stock was financed pre-crisis, how this financing changed through the crisis, and how it compares with alternative funding sources such as ABCP. Their data is less suited to answering this question. Our MMF data also allows us to see borrower counterparty, collateral type, and repo terms for each repo agreement. In the sub-periods in which our data overlap, however, our findings agree with theirs on the quantitatively limited nature of the run and the relative stability of tri-party repo haircuts. Their empirical evidence also nicely complements ours by showing that changes in repo activity are quite smooth over time, without unusual end-of-the-month patterns, which provides reassurance that our low-frequency data is not missing some important intra-month dynamics during the height of the financial crisis. 4 Martin, Skeie, and von Thadden (2012) provide an alternative theoretical perspective on the differences between tri-party and bilateral repo markets. They focus on the fact that tri-party repo haircuts are not negotiated trade by trade, but are fixed in custodial agreements that are revised only infrequently. As a consequence, lenders in the tri-party repo market are more likely to stop lending altogether, while in bilateral repo lenders may keep lending, albeit at higher haircuts, if collateral risk increases. This prediction is consistent with both our evidence and the findings of Gorton and Metrick.
7
I. Funding Through Repurchase Agreements We start by describing the main features of repurchase agreements that are important for understanding our results. A more in-depth treatment of the institutional features of the repo market can be found, e.g., in Duffie (1996), Garbade (2006), and Federal Reserve Bank of New York (2010). A repo involves the simultaneous sale and forward agreement to repurchase the same, or a similar, security at some point in the future. Effectively, a repo constitutes a collateralized loan in which a cash-rich party lends to a borrower and receives securities as collateral until the loan is repaid. The borrower pays the cash lender interest in the form of the repo rate. The borrower typically also has to post collateral in excess of the notional amount of the loan (the haircut). The haircut is defined as h = 1 − F/C with collateral value C and notional amount F . For example, a repo in which the borrower receives a loan of $95m might require collateral worth $100m, implying that a haircut of 5% is applied to the market value of the collateral.5 Repos constitute an important funding source for dealer banks. They use repos to finance securities held on their balance sheets (as market-making inventory, warehousing during the intermediate stages of securitization, or for trading purposes), or to finance repo loans they provided to clients such as hedge funds. In the latter case, dealer banks re-hypothecate the collateral they receive from hedge funds to use as collateral in their repos with cash lenders. King (2008) estimates that about half of the financial instruments held by dealer banks were financed through repos. In the years before the financial crisis, repos became an important funding source 5 A central development in the 1980s that spurred the growth of repo was that repos received an exemption from automatic stay in bankruptcy (Garbade (2006)). This exemption allows the cash lender in a repo to sell the collateral immediately in the event of default by the borrower without having to await the outcome of lengthy bankruptcy proceedings, thereby reducing the counterparty risk exposure of the cash lender.
8
for the shadow banking system. Just like the traditional banking system, the shadow banking system raised short-term funding and directed these short-term funds into relatively illiquid long-term investments, such as corporate securities and loans, as well as residential and commercial mortgages, as illustrated in Figure 1. MMF and SL provided a large part of this short-term funding (Pozsar, Adrian, Ashcraft, and Boesky (2010)). MMF promise their investors a constant net-asset value (“$1 NAV”), which effectively makes their investors’ claims similar to the demand deposits of the traditional banking system (but without deposit insurance). Some of the funding provided by MMF went into securitized products through vehicles that issued asset-backed commercial paper (ABCP), while some went via repo to financial institutions that held securitized products and other securities on their balance sheets (see in Figure 1). SL are another cash-rich party that directed funds to the shadow banking system. As part of their business as custodians for large portfolios of bonds and equity, these institutions lend securities to investors who wish to establish short positions in bond or stock markets. The shorting investor will typically leave cash with the securities lender in an amount at least as high as the value of the borrowed securities. As a result, securities lenders come into possession of a large amount of cash that they seek to reinvest in the money markets. A significant share of this cash went into repos and ABCP. Repo transactions take two forms in the world: tri-party repos and bilateral repos. Repos between dealer banks, or between a dealer bank and a hedge fund are typically bilateral, while repos between dealer banks and MMF/SL are typically tri-party. These two contracts may have different terms in practice (repo rates and haircuts). In a triparty repo, a clearing bank stands as an agent between the borrower and the cash 9
lender. In the U.S., this role is performed either by JPMorgan Chase or Bank of New York Mellon. The clearing bank ensures that the repo is properly collateralized within the terms that cash lender and borrower agreed to in the repo (haircut, marking-tomarket, and type of securities). The motivation for this tri-party arrangement is to enable cash lenders like MMF that may not have the capability of handling collateral flows and assessing collateral valuations to participate in this market without running the risk that the counterparty might not adequately collateralize the repo.6 The risks for a cash lender in a repo are three-fold. First, and principally, the lender faces the risk that the borrower defaults and the lender does not have sufficient collateral to recover the lent amount. Second, for MMF, there is an additional concern that if the borrower defaults and the collateral is illiquid, the MMF will be stuck with the collateral for an extended period. U.S. Securities and Exchange Commission rules place limits on the amount of illiquid/long-term securities that an MMF can hold. Third, there is repo risk unique to the tri-party market that stems from the socalled daily “unwind.”7 Irrespective of the term of the repo, the clearing bank unwinds the repo every morning by depositing cash in the cash-lenders’ deposit account with the custodian and by extending an intraday overdraft and returning the collateral to the borrower for use in deliveries during the day. If the term of the repo has not expired, or if the lender and borrower agree, bilaterally, to renew the repo, a “rewind” takes place at the end of the business day, whereby securities are transferred from the borrower’s to the lender’s security accounts with the clearing bank, and cash is 6 Garbade (2006) discusses incidents prior to the development of the tri-party repo market in which borrowers had failed to properly collateralize loans. 7 We describe the practices in the tri-party repo market as they existed during our sample period. As discussed in Federal Reserve Bank of New York (2010), reforms implemented since then have changed some of these practices. In particular, concerns about the potential systemic risk created by the huge intraday overdrafts extended by the two tri-party custodian banks to broker/dealers have led to efforts to eliminate this “unwind.”
10
transferred from the cash lender’s to the borrower’s deposit accounts. Thus, the cash lender is a secured lender overnight, with the securities underlying the repo serving as collateral, but during the day the cash lender becomes an unsecured depositor in the tri-party custodian. The lender can protect against collateral risk by raising the haircut on the repo contract. Reducing the amount of repo lending can be a response to all three risks. The lender can also raise the repo rate to compensate for all three risks, although in practice this appears to be a less significant margin. Finally, during the sample period we study, there was considerable uncertainty about how a default of a repo borrower would play out in the tri-party repo market. According to the Tri-Party Repo Infrastructure Reform Task Force (see Federal Reserve Bank of New York (2010)), it was not clear to the cash investor if, when, and how a repo trade would be unwound and how the collateral liquidation process would be carried out. The ambiguity over these matters may also affect participation in the repo market.
II. Repo Data To examine the “run on repo” hypothesis, we now turn to data on the terms and quantities of repo lending by the ultimate cash lenders, namely MMF and SL, in the tri-party repo market. We first outline the data sources, and then we discuss the extent to which these data sources cover the universe of repo funding flows into the shadow banking system.
11
A. Data Sources Mutual funds file a portfolio holdings report every quarter on forms N-CSR, N-CSRS, and N-Q with the Securities and Exchange Commission (SEC). This filing requirement also extends to MMF. The typical report of an MMF lists their holdings of certificates of deposits, commercial paper, and repurchase agreements. For repos, the reports list each repurchase agreement with the notional amount, repo rate, initiation date, repurchase date, counterparty, the type of collateral, and, in most cases, the value of the collateral at the report date. The level of detail about the underlying collateral varies between funds. Some report fairly detailed categories, while others only report broad classes, such as “U.S. Treasury Bonds”, “Government Agency Obligations”, or “Corporate Bonds”, often with a maturity range. Typically a portfolio of securities serves as collateral, but only rarely are the value-weights of different classes of securities in the portfolio reported. In most cases, though, the collateral portfolio consists of securities of the same type (e.g., U.S. Treasury bonds of different maturities and vintages, rather than Treasury bonds mixed with corporate bonds or asset-backed securities). We collect the quarterly filings from the SEC website with filing dates between January 2007 and June 2010. We parse the filings electronically and extract the repurchase agreement information. We collect the data for the 20 biggest money market fund families at the end of 2006, identified from a ranking of money market fund families obtained from Cranedata (see Appendix A for a list of the families in the sample). This yields a data set of approximately 16,000 repos. As the market for money market funds is fairly concentrated, with the biggest 20 fund families accounting for more than 80% of total net assets, our data should give us a fairly complete picture of the repo market between MMF and dealer banks. In all of the computations below, we extrapolate the MMF data we have collected to the entire MMF sector by scaling it up to match the 12
total repo from the Flow of Funds accounts (FoF) each quarter. While we refer to the funds in our sample in general as MMF, some funds in the sample are enhanced cash funds that are, strictly speaking, not money market funds, as they do not adhere to the investment restrictions for money market funds in SEC rule 2a-7 and particularly do not aim for $1 NAV. Also, not necessarily all of the repos in our data are tri-party, but conversations with market participants confirmed that the vast majority of MMF repo are tri-party. Our observation frequency is essentially quarterly. MMF file SEC reports every three months, although not all funds file at the same month ends. The low observation frequency raises two concerns. First, we might miss a run that takes place within a month. Second, MMF might engage in some window dressing of their repo transactions around the SEC reporting dates. The comprehensive daily data set on tri-party repo analyzed in Copeland, Martin, and Walker (2011) provides a useful complementary perspective on these issues. Their data show that there are no drastic within-month changes in repo funding volumes, even around the most dramatic moments during the financial crisis such as the Lehman Brothers bankruptcy. There are further no substantial changes around month-end reporting dates, which alleviates the window-dressing concerns. Nevertheless, it is possible that some individual dealer banks experienced big shifts in repo funding conditions intra-month that left no trace in our low-frequency data, nor in daily aggregate data. To analyze securities lenders, the second main class of providers of short-term funding to shadow banks, we obtain data from the Risk Management Association (RMA). The RMA conducts a quarterly survey of major securities lenders and reports statistics on their aggregate portfolio of cash collateral reinvestments, including direct investments as well as repo agreements. Appendix B provides more detail on the data, 13
including a list of survey participants quarter-by-quarter. The RMA data combine repo with private-label ABS and corporate debt into one category. We impute the split between private-label ABS and corporate debt based on the assumption that their relative proportion is the same as the corresponding proportion in MMF repos.8
B. Coverage of Repo Funding Flows The main objective of our data collection is to capture the repo funding flows that enter the shadow banking system and their composition in terms of collateral. One concern that may arise is that our data on MMF and SL might miss other important repo lenders. If so, we would not have a full picture of the repo funding extended to shadow banks. In 2007Q4, our total coverage of repo from MMF and SL is $1.1tn. The FoF for 2007Q4 (December 2010 release) report that the other large repo lenders were State and Local Governments ($163bn),9 Government Sponsored Enterprises ($143bn), and Rest of the World ($338bn). The Treasury’s TIC data puts the repo lending of foreign central banks at between $100 and $200bn (these numbers are likely incorporated in the FoF Rest of the World entry). If these FoF estimates are correct, then our data 8
An alternative assumption that may be plausible, too, is that the ratio of SL private-label ABS repo to total SL repo with private sector assets (i.e., ABS plus corporate) is the same each period as the ratio of SL’s direct holdings of ABS to total SL holdings of private sector assets. We can measure the latter ratio directly in the RMA data. This alternative assumption would imply that SL’s willingness to be exposed to ABS collateral in repo (relative to their total exposure to private sector collateral) is relatively similar to their willingness to be exposed to ABS in direct holdings (relative to their total exposure to private sector securities). Under this assumption, we would impute a smaller contraction (by $38bn) in total MMF/SL private-label ABS repo than the one we report below. 9 Repos by state and local governments are typically backed by Treasury and Agency collateral, and are therefore not a likely funding source for private-label ABS. For example, California Government Code Section 53601 restricts repo collateral to government, agency, and municipal securities and prime commercial paper. In Illinois, the Deposit of State Moneys Act (15 ILCS 520/22.5) allows only repo collateralized by government securities.
14
covers more than 50% of the repo lending that flows into the shadow banking system. However, because data on the repo market is scant, there is uncertainty in these FoF estimates. For this reason, we did some further analysis of commercial banks and non-financial corporations as potential repo lenders. Commercial banks are not on our list of repo lenders above, because they are net repo borrowers according to the FoF. However, there could be important heterogeneity within the commercial bank universe. For example, it is possible that deposit-rich local banks are net repo lenders while big money center banks are net borrowers. To check this, we turned to the FDIC’s Call Reports for 2007Q4. Aggregating the net repo positions of all banks that are net lenders yields total net repo lending of $112bn (gross lending of $177bn). Thus, bank deposits appear to fund some repo lending to the shadow banking system. But the numbers are nevertheless relatively small compared with the repo lending of MMF and SL. Looking at some of the most cash-rich non-financial corporations, we did not find other significant sources of repo funding. According to its 2007 Annual report, Microsoft held $23.4bn cash and short-term investments. Of this amount, $3.0bn is in cash, and the remainder is in government, agency, and corporate bonds, MBS, municipal securities, mutual funds, commercial paper, and certificates of deposit. While some of Microsoft’s mutual fund investments might flow into repo markets through MMF, these institutional MMF are already covered in our MMF sample. Similarly, Apple reports $15.4bn cash and short-term investments in its 2007 annual report, of which $256m is held as cash and the rest is wholly invested in government, agency, and corporate securities, where corporate securities include commercial paper, certificates of deposit, and time deposits. Overall, our analysis has not turned up other major sources of repo funding. Our 15
MMF and SL data appears to cover more than half of the repo funding flows into the shadow banking system. This assessment is also consistent with the numbers reported in Copeland, Martin, and Walker (2011) on the size of the tri-party repo market. According to data from Bank of New York Mellon and J.P. Morgan, the total amount of tri-party repo was roughly $2.5 trillion at the end of 2007 (Federal Reserve Bank of New York (2010)), which compares with about $1.1 trillion of MMF and SL repo in our data. However, the Bank of New York Mellon and J.P. Morgan numbers also include GCF repo, which is a form of interdealer repo. Their data are therefore roughly consistent with the view that our MMF and SL data captures more than half of the repo funding provided to the shadow banking system. Moreover, some of the repo lenders not covered by our MMF/SL data (such as state and local governments and central banks) are unlikely sources of funding for private-label ABS collateral.
III. Quantity and Composition of Repo Funding We use the repo data to tackle the first and most basic question: What is the total amount of repo funding that MMF and SL extend to the shadow banking system? We then look at the composition of repo funding by type of collateral.
A. Quantity of Repo Funding Column (i) in Table I reports the aggregate amount of repos undertaken by MMF in our SEC filings data set. In 2006Q4 we have only partial coverage because we miss 2006Q4 reports filed before January 2007. For comparison, column (ii) shows the aggregate amount of MMF repo outstanding according to the FoF, and column (iii) shows the total amount of MMF assets, also from the FoF. Our data set covers roughly 80-90% 16
of oustanding MMF repo. Repos account for about 15-20% of total MMF assets. Column (iv) reports the total amount of repo oustanding in securities lenders’ cash collateral reinvestment portfolios. Until 2008Q2, this number is of comparable magnitude as the total amount of MMF repo, but it contracts more strongly in subsequent quarters. This is likely driven by the fact that the total amount of cash collateral available to SL for reinvestment contracted sharply around the peak of the crisis, as shown in column (v). In contrast, the amount of MMF repo did not shrink appreciably until 2009Q2. One factor driving the total size of MMF repo seems to be the flows in and out of MMF. MMF assets increased by about 50% from 2007Q1 to 2009Q2. Column (vi) shows the end-of-quarter amount of total Primary Dealer repos outstanding, as reported by the Federal Reserve Bank of New York. A comparison of these numbers with the total amount of MMF and SL repo shows an interesting and stark contrast: The Fed’s Primary Dealer repo numbers are about four times as high as the MMF and SL repos combined. This difference arises because the Primary Dealer statistics aggregate all repo transactions of Primary Dealers, including repos done between dealers and with hedge funds, while the MMF and SL repo covers only the funding raised from non-banks to shadow banks. Repos between shadow bank intermediaries are common and involve re-hypothecation of collateral along the intermediation chain. As an example, suppose dealer bank A lends $1 to a hedge fund via a repo (collateralized by $1.02 of Treasuries),10 and then borrows the $1 from dealer bank B via a repo (collateralized by the same $1.02 of Treasuries), who then borrows $1 from a MMF (collateralized by the same $1.02 of Treasuries). The MMF does not re-hypothecate collateral. This chain is typical in the repo market, as dealer banks both borrow and lend cash and rehypothecate collateral 10 From the perspective of the hedge fund, this is a repo, from the perspective of dealer bank A it is a reverse repo
17
Table I Quantity of Repo Funding Provided by Money Market Funds and Securities Lenders ($bn) The first three columns provide data on the total quantity of repo funding provided by MMF. Collected repo in column (i) is the sum of all the repo agreements from the quarterly SEC filings in our data set. In quarter 2006Q4 the coverage of our data set is incomplete, because we start our sample with reports filed in January 2007, and we miss 2006Q4 reports filed before that date. Column (ii) offers a comparison with the total MMF repo according to the Flow of Funds Accounts (FoF) from the Federal Reserve Board release Z.1. Column (iii) reports the total assets of MMF according to the Flow of Funds Accounts. Columns (iv) and (v) provide data on the total amount of repo funding provided by securities lenders and the total amount of cash collateral that they have available for reinvestment, respectively, as reported by the Risk Management Association (RMA). Column (vi) reports the total amount of primary dealer repo, as reported by the Federal Reserve Bank of New York Primary Dealer Statistics.
Quarter 2006Q4 2007Q1 2007Q2 2007Q3 2007Q4 2008Q1 2008Q2 2008Q3 2008Q4 2009Q1 2009Q2 2009Q3 2009Q4 2010Q1
Money Market Funds Collected Total Total Repo Repo Assets (SEC) (FoF) (FoF) (i) (ii) (iii) 243 324 331 412 483 501 466 433 479 546 507 495 472 427
395 387 426 528 606 592 518 592 542 562 488 495 480 440
2,312 2,372 2,466 2,780 3,033 3,383 3,318 3,355 3,757 3,739 3,585 3,363 3,259 2,931
Securities Lenders Total Cash Repo Collateral (RMA) (RMA) (iv) (v) 431 527 504 522 478 467 509 490 228 212 257 244 229 263
18
1,594 1,834 1,902 1,754 1,712 1,537 1,790 1,519 954 779 882 865 850 837
Primary Dealer Repo (NY Fed) (vi) 3,442 3,619 3,889 3,886 4,106 4,278 4,222 3,989 3,208 2,743 2,582 2,499 2,469 2,477
extensively (Singh and Aitken (2010)). Note that the sum of repo loans across these four institutions is $3. The Fed’s Primary Dealer statistics would report total repos of $2, i.e., the sum of the two repos that involve dealers as the party receiving funds. However, the amount of repo funding extended by non-banks to the shadow banking sector is only the $1 from the MMF to dealer bank B. Interdealer repos do not raise funding for the shadow banking system, but instead reallocate funds within the shadow banking system. Repos between shadow bank intermediaries and hedge funds also often involve simultaneous repo/reverse-repo trades in which a dealer obtains one security as collateral (say, a Treasury bond) from a hedge fund client in a reverse-repo transaction and at the same time delivers another one (say, a corporate bond) to the same hedge fund in a repo transaction. These transactions are effectively just an exchange of one security against another and hence do not provide net funding to dealer banks. The repo leg of these trades is included in the Fed’s Primary Dealer repo statistics.11 For these reasons, the amount of repo funding provided by non-banks to shadow banks, and the extent of its contraction, cannot be inferred from the Federal Reserve’s Primary Dealer repo statistics. Estimates of the total size of the repo market based on the Primary Dealer repo numbers, as in Adrian and Shin (2009) or Gorton and Metrick (2011), are difficult to interpret, because these estimates do not distinguish between length of intermediation chains within the shadow banking system from the 11 The substantial extent of these simultaneous repo/reverse repo transactions can be estimated from dealers’ off-balance sheet pledged collateral. FASB interpretation (FIN) 41 allows netting of the repo and reverse repo if they are both with the same counterparty and same maturity. For example, Goldman Sachs’ broker/dealer subsidiary reported, in its November 2006 FOCUS report filed with the SEC, a total of $489bn of collateral owned or received that was pledged, while the balance sheet only reports a total of $306bn repos, securities loaned, and financial instruments sold but not yet purchased. The difference of $183bn likely reflects repos netted with reverse repos, or similar transactions, that satisfied the requirements for netting of FIN 41. See King (2008) for similar calculations for several dealer banks in 2008.
19
repo funding raised from outside the system. The shortening of intermediation chains that is implied by the sharp contraction in Primary Dealer repo may be informative about other problems in the shadow banking system that are not our focus here. For example, dealers may have tried to reduce network exposures to vulnerable dealers, which made them more reluctant to lend to each other, and which inhibited the efficient allocation of liquidity within the shadow banking system.
B. Composition by Type of Collateral We next turn to evaluating the conjecture by Gorton and Metrick (2010a, 2010b, 2011) that private-label ABS played an important role as collateral in repo transactions. Figure 2 presents the share (by notional value) accounted for by different collateral categories, reported for each quarter. The “Agency” category includes both Agency bonds and Agency-backed MBS (many funds lump these together when reporting collateral, so we cannot distinguish them in most cases). The “Priv. ABS” category includes private-label ABS. The “Corporate” category refers to corporate debt, and the “Other” category is composed mainly of equities, whole loan repos, and some commercial paper, certificates of deposit, and municipal debt. The most striking fact in this figure is the relatively small role played by privatelabel ABS collateral. Treasury and Agency securities account for the majority of collateral in MMF repos. Private-label ABS make up less than 10% of MMF repo collateral prior to the crisis, which corresponds to about $31 billion in terms of value. For SL, Agency and Treasury securities account for roughly 50% of repo, with private label collateral making up a more significant portion of the porfolio. Private-label ABS disappears as collateral from MMF as the financial crisis reaches its peak in 2008. Corporate debt also disappears almost entirely. Thus, riskier and 20
1
Panel A: Money market funds
.9
Corporate
Other
.8
Priv. ABS
.4
Share .5 .6
.7
Agency
0
.1
.2
.3
U.S. Treasury
2007q1
2008q1
2009q1
2010q1
Quarter
1
Panel B: Securities lenders .9
Other
Share .5 .6
.7
.8
Corporate
.2
.3
.4
Priv. ABS
.1
Agency
0
U.S. Treasury 2007q1
2008q1
2009q1
2010q1
Quarter
Figure 2. Share of collateral types as a proportion of outstanding total notional value. The RMA data for securities lenders combines corporate and privatelabel ABS collateral. The split between these two categories shown in Panel B is imputed based on the assumption that the relative proportion of corporate and privatelabel ABS collateral is the same as for MMF (see our discussion in Section II.A). 21
less liquid collateral were not used for financing in the tri-party repo market at that time. For SL, we observe the same pattern of a reduction in the share of riskier and less liquid collateral during the crisis. The disappearance of private credit instruments as collateral is less extreme, though, than for MMF. The reduction of repo against private-label ABS reflects the “run on repo” that many have commented on and we will delve more into this run in the next sections.
IV. Short-term Funding of Private Sector Credit Instruments We next ask how repo compares as a funding source for private sector securitized assets to other forms of short-term funding. We focus particularly on the importance of ABCP vis-a-vis repo because both are proto-typical shadow banking transactions involving relatively safe short-term funding of a private sector asset.
A. Short-term Funding at the Onset of the Financial Crisis The first row of Table II presents data on the total outstanding U.S. private-label ABS in 2007Q2. The $5.213tn outstanding is the heart of what is commonly referred to as the shadow-banking sector; i.e., residential mortgages and other loans that are held in securitization pools or in SPVs. The main sub-categories in the $5.213tn are roughly $3tn private-label residential and commercial mortgage-backed securities (RMBS and CMBS) which include about $1.4tn subprime RMBS outstanding at the onset of the crisis (Greenlaw, Hatzius, Kashyap, and Shin (2008)). We also provide data on the outstanding corporate bonds as some of these securities (e.g., bonds used to finance
22
Table II Funding of Outstanding U.S. Private-Label ABS and Corporate Bonds in 2007Q2 ($bn) The first row reports the total outstanding amount of private-label asset-backed securities (ABS), as reported by the Securities Industry and Financial Markets Association (SIFMA) less the outstanding amount of CDO of ABS (estimated as in He, Khang, and Krishnamurthy (2010)), and corporate bonds, as reported by the Flow of Funds Accounts (FoF) from the Federal Reserve Board release Z.1, excluding bonds issued by foreigners and by ABS issuers. The data on outstanding asset-backed commercial paper (ABCP) is from the Federal Reserve Board. The data on direct holdings of private-label ABS and corporate bonds by securities lenders is from the Risk Management Association (RMA). The direct holdings of MMF are estimated from FoF data on the combined holdings of private-label ABS and corporate bonds under the assumption that the ratio of private-label ABS holdings to corporate bonds is the same for MMF as the ratio we observe for securities lenders. The repo funding provided by MMF with private-label ABS and corporate bonds as collateral are calculated from our SEC filings data, where the numbers are scaled up so that the total amount of repo funding of MMF (with all types of collateral) matches the total amount of MMF repo according to the FoF every quarter. The RMA data on repo funding provided by securities lenders combines repos with corporate and private-label ABS collateral. The repo estimate for securities lenders is based on the assumption that the ratio of repos with private-label ABS to repos with corporate debt securities collateral is the same for securities lenders as the one we observe for MMF.
Private-label ABS Amount % Total outstanding Short-term funding ABCP Direct holdings MMF Securities lenders Repo MMF Securities lenders Total short-term
5,213
100%
1,173
23%
243 502 31 120 2,069
23
Corporate Bonds Amount % 5,591
100%
5% 10%
179 369
3% 7%
1% 2% 40%
42 166 755
1% 3% 14%
LBOs, senior bank loans) also comprise the shadow banking sector. The outstanding amount of corporate debt, excluding commercial paper, was $5.591tn in 2007Q2. The table also details the amount of these securities ultimately financed by repo from MMF or SL. Total repo of private-label ABS is $151bn. Even if we include the repo extended against corporate bonds, the repo total is only $359bn. This is a small fraction of the outstanding assets of shadow banks. This observation underscores a principal finding of this study: repo was of far less importance in funding the shadowbanking sector than is commonly assumed. If repo was not the principal source of short-term funding, what was? The table details the direct holdings of these securities by MMF and SL. The direct holdings are substantial, totaling $745bn. It is likely that such holdings are high grade and short maturity tranches of securitization deals. The largest source of funding is ABCP of $1,173bn.12 The comparison between ABCP and repo shows that ABCP was probably more important as a stress-point for the shadow banking system.
B. Contraction in Short-term Funding During the Financial Crisis Table III documents the contraction in short-term funding of the shadow banking sector between 2007Q2 and 2009Q1. Total repo for private-label ABS goes to almost zero. However, as we have noted, the quantity of contraction is modest since repo was a 12 Acharya, Schnabl, and Suarez (2012) note that the assets in the SPVs financed by ABCP are a 50-50 mix of ABS and other loans (receivables or whole bank loans). As they point out, when an SPV contains loans rather than already-securitized assets, one can think of ABCP as the first layer of securitization (which may be temporary if loans are “warehoused” in the SPV until they are eventually permanently securitized). In this case, too, the shadow banking system funds long-term assets with short-term debt, and hence it makes sense to include the full amount of ABCP in our comparison here because this is one channel through which the shadow banking system funds long-term assets. One could therefore also add about 50% of ABCP as first-layer securitization to the headline amount of outstanding ABS/MBS, but this would not materially change the message of the table.
24
relatively small source of funding. The contraction in repo funding accounts for only about 10% of the total short-term funding contraction of roughly $1.4 trillion. A striking fact is that repo with private-label ABS collateral completely disappears. Thus, even though the total contraction is small, it seems possible that institutions that were entirely reliant on repo were particularly affected by the reduction in repo with private collateral. We return to this point later in the paper. For example, this observation may square with accounts of the failures of Bear Stearns and Lehman Brothers (see Duffie (2010)). For the entire shadow bank sector though, the more important contraction was in ABCP, which falls by $662bn. Direct holdings of ABS by MMF and SL also falls by $568bn. The bottom panel of the table documents the contraction in corporate bonds. The contraction is more modest, and this is likely driven by the fact that corporate bonds did not suffer from the same rise in perceived risk and illiquidity as ABS. Figure 3 illustrates the contraction in ABCP and repo graphically, quarter-byquarter. The figure compares the amount of repo with private-label ABS collateral with the amount of ABCP outstanding, net of the amount funded through the Federal Reserve’s Commercial Paper Funding Facility (see Adrian, Kimbrough, and Marchoni (2011)). The contraction in ABCP starts earlier than that of repo and continues steadily through the crisis. The repo contraction occurs in a small window around 2008 Q1, roughly corresponding to the failure Bear Stearns. The fact that the contraction in repo with private-label ABS starts later than ABCP indicates that the initial cracks in shadow bank funding appeared in ABCP, not in the repo market. The contraction in both repo and ABCP are consistent with the views of many commentators that a contraction in the short-term debt of shadow banks played an important role in the collapse of the shadow banking sector. While there are similarities 25
Table III Contraction in Short-term Funding ($bn) For an explanation of the data sources for this table, see the notes in Table II. In this table, we adjust the outstanding amount of asset-backed commercial paper (ABCP) in 2009Q1 by subtracting the amount of ABCP financed through the Federal Reserve’s Commercial Paper Funding Facility ($117bn in 2009Q1).
Private-label ABS ABCP Direct holdings MMF Securities lenders Repo MMF Securities lenders Total Corporate bonds Direct holdings MMF Securities lenders Repo MMF Securities lenders Total
2007Q2
2009Q1
Contraction
1,173
511
-662
243 502
59 116
-184 -386
31 120
0 2
-31 -118 -1,380
179 369
158 309
-21 -60
42 166
10 49
-32 -116 -229
between repo and ABCP, the observation that ABCP plays a more important role than repo in the short-term funding contraction is important for understanding the mechanisms behind the spill-over into the wider financial system. While both ABCP and repo are collateralized forms of short-term debt, ABCP typically receives liquidity support guarantees from a commercial bank while repos are typically broker/dealer liabilities. When the SPVs backed by ABCP could no longer roll over their short-term debt, their assets came back onto the balance sheets of sponsoring banks (Covitz, Liang, 26
200
1500
0
50 100 150 Repo w/ priv. ABS ($bn)
ABCP outstanding ($bn) 300 600 900 1200 2007q1
2008q1
2009q1
2010q1
Quarter ABCP outstanding
Repo w/ priv. ABS
Figure 3. Comparison of private-label ABS repo with ABCP outstanding. The amount of ABCP outstanding shown is net of ABCP financed through the Federal Reserve’s Commercial Paper Funding Facility. and Suarez (2012), He, Khang, and Krishnamurthy (2010)), spreading the problem to the regulated banking system. The liquidity problems created by this loss of funding was relatively contained because commercial banks had direct access to funding from the Federal Reserve. The problem that commercial banks faced as a consequence was less one of funding liquidity than the problem that supposedly off-balance sheet assets of dubious value migrated back onto their balance sheets depleting their capital. The relative importance of ABCP in funding private-label ABS also sheds some light on potential drivers of the run-up in short-term debt financing prior to the crisis. The fact that the run-up and crash was concentrated in a part of the shadow banking system that operated with implicit and explicit (but off-balance sheet) support from regulated banks supports the regulatory arbitrage arguments of Acharya, Schnabl, and Suarez (2012). The extensive involvement of European commercial banks in the 27
ABCP business further points towards the global imbalances argument of Caballero and Krishnamurthy (2009) and the global banking glut theory of Shin (2011).
C. Demand or Supply? One thorny issue to sort out from this data is whether or not the contraction in outstanding volumes was driven by supply forces or demand forces. That is, one interpretation of this data is that cash investors including MMF and SL change their portfolios to avoid private-label ABS repo and ABCP (“repo supply”). It is also possible, though, that hedge funds and dealer banks, motivated by the increased risk and uncertainty in asset markets, chose to reduce their holdings of securities and hence no longer needed funding from the repo markets (“repo demand”). The quantity data is suggestive of a supply contraction (we discuss the price data in the next section). First, the outstanding amount of securities in SPVs backing ABCP was essentially fixed over this period. That is, banks sponsored the SPVs, filled them with loans and securities, and issued ABCP and other claims against them, letting them wind down as the loans and securities matured. The banks were not taking an active decision to increase or decrease the loans/securities in the SPVs. Thus, at least for ABCP, it is likely that all of the action is driven by loan supply forces. Since ABCP and repo are close substitutes for an MMF or SL, it is likely that the desire to not own ABCP is mirrored in a desire to not own repo. Thus, it is likely that the contraction in repo is also driven by supply forces. Second, the fact that repo quantity goes to zero also suggests that supply was at work. While dealer banks and hedge funds reduce their holdings of private-label ABS over this period (see He, Khang, and Krishnamurthy (2010)), they did not reduce their holdings to zero, and so a financing need still existed. 28
Last, flows into money market funds provide another indication that the contraction was driven by supply-side effects. From September to December 2008, taxable government money market funds received inflows of $489 billion while taxable nongovernment money market funds experienced outflows of $234 billion (data from the Investment Company Institute). Thus, part of the reduction in repo of non-goverment securities, and the increase in repo with government securities during the later stages of the crisis may have been driven by investors’ reallocation between money market funds that invest only in government securities and other money market funds.
V. Repo Terms During the Financial Crisis This section presents data on the evolution of the terms of repo contracts, including repo rates, haircuts, and repo maturities. The analysis is based on the MMF repo data, and so the analysis here is based on data with a less comprehensive coverage of the tri-party repo market than the analysis of repo lending volumes in the previous section. The data we present suggests that the “price” of repo borrowing rose over the crisis. In conjunction with the quantity evidence, the result further suggests that a central factor driving repo market dynamics in the crisis was the desire of cash lenders to avoid lending against private-label ABS collateral. The data on the change of contract terms also suggest that it is a combination of risk-aversion and illiquidity aversion that drives cash lender behavior.
A. Maturity Compression Maturities get compressed with the onset of the financial crisis. Figure 4 illustrates the shortening in the maturity structure of repos during the crisis. In 2007, the 99th 29
250 Maturity (business days) 100 150 200 50 0 2006q3
2007q3 99th
2008q3 Quarter 98th
2009q3 95th
2010q3 90th
Figure 4. Percentiles of repo maturities (weighted by notional value). percentile of maturity (weighted by notional amount) reached 250 business days, but it subsequently shrank to 60 business days in 2008. The reduction in maturity is consistent with an increased demand for liquidity from cash-investors, since shorter maturity repo is de-facto more liquid than longer maturity repo. Krishnamurthy (2010) provides evidence of investors’ increased desire for liquidity over the crisis, as reflected in a number of different asset markets. That is, the data in Figure 4 is reflective of a more general phenomenon that played out over the crisis. However, as the figure shows, the vast majority of repos is generally of short maturity, even before the financial crisis: about 90 percent of repos are overnight or with a maturity of only a few days.
B. Haircuts Figure 5 plots value-weighted average haircuts for different categories of collateral over the sample period. Since MMF file SEC reports at different month-ends throughout 30
each quarter, we can calculate these averages at a monthly frequency. The line for private-label ABS has a gap from late 2008 to late 2009, as this type of collateral completely disappeared during this period (see Figure 2). It is apparent that haircuts for private-sector collateral increased significantly from 2007 to 2010 from around 34% to about 5-7% for corporate debt and private-label ABS. The similarity of haircut time series for private-label ABS and for corporate bonds until the collapse of Lehman Brothers in September 2008 suggest that, at least until that point in time, the problem was more generalized and not specific to securitized assets. All of these patterns are suggestive of cash investors’ desire to avoid risk/illiquidity in their repo loans. An important observation from this data is that the patterns in haircuts that we observe in the tri-party repo market appear different from the bilateral interdealer repo haircuts reported in Gorton and Metrick (2011). First, in Gorton and Metrick’s data average haircuts are frequently zero in 2007 for corporate debt and securitized products, while the MMF repos in our data always have average haircuts of at least 2%, even for Treasuries and Agency debt. Second, although our value-weighted averages (which is the most relevant measure of aggregate funding conditions) are difficult to compare with the equal-weighted averages in finer categories reported in Gorton and Metrick (2011), an informal comparison suggests that haircuts in tri-party repos of MMF increased much less than the haircuts in their interdealer repo data (Gorton and Metrick report average haircuts in excess of 50% for several categories of corporate debt and securitized products).13 Taken together with our findings of the relatively small amounts of MMF repos against private-label ABS collateral, these observations suggest that the “run on repo” may have had a more modest effect on aggregate funding conditions for the shadow 13 In a different data set, Copeland, Martin, and Walker (2011) find similarly moderate haircuts in tri-party repo.
31
7 6 Percent 4 5 3 2 2006m7
2007m7
2008m7 Month U.S. Treasury Priv. ABS
2009m7
2010m7
Agency Corporate
Figure 5. Haircuts by Collateral Type (weighted by notional value) banking system than what one may guess from the enormous increase in haircuts for securitized products in the bilateral interdealer repo market as reported by Gorton and Metrick (2011). Finally, there are some surprising patterns in this data. First, the increase in haircuts does not revert following the peak of the financial crisis in 2008. Haircut levels in 2010 are still as high, or even higher than at the end of 2008. Second, average haircuts for Agency collateral remained the same as those for Treasury obligations, despite the troubles of Fannie Mae and Freddie Mac during the summer of 2008.
32
C. Repo Rates Figure 6 presents time-series of value-weighted average overnight repo rates (weighted by notional amounts). As a benchmark for comparison, we use the Federal Funds rate as a default-free rate proxy.14 As shown in Panel A, the average overnight repo rate for Treasury collateral typically tracks the Fed Funds rate quite closely, but there are some striking deviations. Starting in 2007, the repo rate on Treasuries drops below the Fed Funds rate. This wedge reaches a maximum of almost 100bps in 2008Q1. It is apparent that Treasuries as a class represented preferred collateral, and as Treasury collateral was scarce, the repo rates on this collateral fell substantially below other risk-free benchmarks. Note that the repo rate here is the general collateral repo rate and not the “special” collateral repo rate as discussed in Duffie (1996). Indeed, this evidence is more consistent with Krishnamurthy and Vissing-Jorgensen (2012) who argue that Treasuries as a class command a collateral/liquidity premium. Fleming, Hrung, and Keane (2010) investigate the low Treasury repo rate phenomenon in detail and show that the implementation of the Term Securities Lending Facility (TSLF) in March 2008, in which the Federal Reserve lent Treasury securities against non-Treasury collateral, helped to reduce the repo premium on Treasuries. There is substantial variation in the repo rate by category of collateral, as evidenced in Panel B. The spread between the Fed funds rate and the repo rate for Agency debt, corporate debt, and private-label ABS increased from close to zero in 2007 to almost 200bps in 2008Q1. The higher rates are consistent with cash investors’ desire to avoid lending against risky/illiquid collateral and scarcity of Treasury collateral around the time of the Bear Stearns collapse. The spread drops after the introduction of the TSLF 14
The Federal Funds rate is an overnight rate and as such almost free of default risk.
33
0
2
Percent
4
6
Panel A: Average Overnight Treasury Repo Rate and Fed Funds Rate
2006m7
2007m7
2008m7 Month
Fed Funds Rate
2009m7
2010m7
Treasury Repo Rate
0
1
2
Percent 3
4
5
Panel B: Average Overnight Repo Rate in Excess of Fed Funds Rate
2006m7
2007m7
2008m7 Month
Agency
Priv. ABS
2009m7
2010m7
Corporate
Figure 6. Average Repo Rates (weighted by notional value)
34
in March 2008, but it spikes again in September 2008 following the collapse of Lehman Brothers. Private-label ABS collateral was almost absent at that time, but a small volume of repo transactions took place at an average repo rate spread to Treasury collateral of around 500bps. Corporate debt collateral commanded a similar spread. In contrast, repo rates for Agency debt did not increase. A final observation is that unlike haircuts in Figure 5, these repo rate spreads have reverted to near pre-crisis levels as financial markets normalized in 2009 and 2010. It is noteworthy that quantities and haircuts on some asset classes have continued to reflect stress conditions. A possible explanation is that market participants’ assessment of the risks of private debt instruments was permanently changed by the financial crisis.
VI. Cross-sectional Patterns by Repo Counterparty We now turn to evaluating another channel through which the repo contraction may have contributed to the crisis. While the contraction in repo with private sector collateral was relatively insignificant for shadow bank funding in aggregate, its effects may have been amplified if the contraction disproportionately affected key institutions. This section presents data that is supportive of this channel. It is also possible that some dealer banks may have been perceived as more prone to default than others, which may have led cash lenders to run on repo of these banks, irrespective of the type of collateral offered. To shed light on these issues, we examine how the contraction in repo funding with private collateral played out in the cross-section of counterparties, and whether different counterparties faced different repo terms (haircuts, repo rates) around the peak of the financial crisis. Since we only have cross-sectional data by counterparty for MMF repos, but not for SL repos, a caveat is that the following analysis only captures
35
a partial picture of the total repo funding flows from non-banks to dealer banks.
A. Changes in Repo Quantities by Counterparty Dealer banks that were most reliant on repo with private sector collateral in the precrisis period could have been more exposed to problems in this part of the repo market. To measure their pre-crisis reliance on private collateral repo funding we focus on the period prior to the rescue of Bear Stearns in March 2008 as this was the time just before repo volumes with private collateral started to contract. Since each MMF files holdings reports only every three months, we sum up the repo funding amounts per counterparty over three month windows.15 For each counterparty, we calculate the pre-Bear Stearns (BSC) amounts of repo with different collateral types by summing MMF repos over the three months from December 2007 to February 2008. The latter date is when repo funding with private collateral starts to contract (see Figure 3). We then compare these numbers with the repo funding post-Lehman (LEH) (September 2008 to November 2008). Figure 7 shows how repo funding contracted or expanded for each repo counterparty in our data from the pre-BSC period to the post-LEH period, where the change is expressed as a fraction of each counterparty’s total repo funding from MMF in the pre-BSC period. Bear Stearns and Lehman Brothers are not included in this plot, as we cannot compute their post-LEH repo funding, but further below we will show data on their private collateral shares in the pre-BSC period. Panel A plots the change in total repo funding against the pre-BSC private collateral share. There was substantial het15
Otherwise one would run into the problem that a counterparty might finance Treasuries with one MMF that files the holdings, say, at the end of February and private-label MBS with a different MMF that files holdings at the end of January. Looking at the repo funding amounts in February would yield a misleading picture in this case.
36
Panel A: Total repo Change Pre−BSC to Post−LEH −.5 0 .5 1 1.5
mfg bcs jpm bnpqy hbc bac scgly drb rbs
ing
ms
db cs ubs
mer c gs wb
0
.1 .2 .3 .4 .5 .6 .7 .8 Private Collateral Share Pre−BSC
.9
Panel B: Repo with Treasury and Agency collateral Change Pre−BSC to Post−LEH −.5 0 .5 1 1.5
mfg
bcs jpm hbc bnpqy bac scgly ing rbs
0
ms
drb db cs ubs
mer
c gs
wb
.1 .2 .3 .4 .5 .6 .7 .8 Private Collateral Share Pre−BSC
.9
Contraction Pre−BSC to Post−LEH −.5 0 .5 1 1.5
Panel C: Repo with private-sector collateral
bcs bnpqy mfg scgly rbs ing hbc jpmdb bac cs ubs drb
ms mer cgs wb
0
.1 .2 .3 .4 .5 .6 .7 .8 Private Collateral Share Pre−BSC
.9
Figure 7. Contraction/expansion in money market fund repo from pre-Bear Stearns (Dec. 07 to Feb. 08) to post-Lehman (Sep. 08 to Nov. 08). The contraction/expansion is expressed as share of total outstanding money market fund repo in the pre-Bear Stearns period (Dec. 07 to Feb. 08). Counterparty identifiers are provided in Appendix C. 37
erogeneity in reliance on private debt instruments as repo collateral. Mizhuo (MFG), Royal Bank of Scotland (RBS), Societe Generale (SCGLY), Barclays (BCS) have private collateral shares of close to zero, while Merrill Lynch (ML), Morgan Stanley (MS), Goldman Sachs (GS), and Citigroup (C) have private collateral shares of almost 50%. Wachovia (WB) is an outlier with a private collateral share above 80%. The change in total repo funding from the pre-BSC to the post-LEH period is negatively correlated with the private collateral share in the pre-BSC period. Total repo funding expanded for most counterparties, but it contracted for many of those that had relatively high private collateral shares before the financial crisis reached its peak. Panels B and C break the change in total repo funding into the change in repo funding with Treasury and Agency collateral and with private collateral, respectively. It is apparent that the change in total repo funding has two drivers: (a) repo funding with Treasury and Agency collateral expands for most counterparties, except those with high pre-BSC private collateral shares; (b) repo with private collateral disappears almost completely for all counterparties (which leads to a regression slope of approximately -1.0 in Panel C). Figure 8 shows that the counterparties with the highest private collateral shares in the pre-BSC period are also more likely to be among those that had the highest perceived default risk around the peak of the financial crisis, as measured by each counterparty’s maximum 5-year CDS rate in the time period following the bankruptcy of Lehman until the end of 2008. To illustrate where Lehman and Bear Stearns are located in terms of their private collateral share, the plot also includes these two counterparties with their CDS rate set to the maximum value attained at any time prior to the rescue or bankruptcy. Even though the counterparties with the highest pre-BSC private collateral shares 38
1500
wb
Maximum 5−yr Senior CDS Rate 500 1000
ms
bsc leh
hbc gs mer rbs
ubs bcs bac cs ing jpm db drb bnpqy
0
scgly
c
0
.2
.4 .6 Private Collateral Share Pre−BSC
.8
Figure 8. Maximum CDS rates after the Lehman Brothers bankruptcy plotted against private collateral share in repo funding from money market funds during the three months prior to the Bear Stearns rescue (December 2007 to February 2008). For each institution, the figure plots the maximum CDS rate on 5-year senior debt (in basis points) between the day of Lehman Brothers bankruptcy (September 15, 2008) and end of year 2008. Bear Stearns’ and Lehman Brothers’ CDS rates in this plot are the maximum CDS rates prior to rescue/failure. The regression line has a slope of 1445 with t-statistic 4.57. Counterparty identifiers are provided in Appendix C. were perceived as most at risk to default, Figure 7 shows that these counterparties did not generally reduce the amount of repo with Treasury and Agency collateral. Morgan Stanley, the counterparty with the second highest perceived default risk at the end of September 2008 and the third highest private collateral share in the pre-BSC period, even increased its amount of repo funding with Treasury and Agency collateral substantially. While these findings are subject to the caveat that we only observe MMF repos, and not repos with SL and other cash providers, they are suggestive that repo
39
funding with high-quality collateral remained available even for dealer banks with high perceived default risk. Some accounts of the failure of Bear Stearns and Lehman suggest that these dealer banks did indeed experience difficulty in rolling over repo on all forms of collateral, but only in the last days before failure. This is not captured in our low-frequency MMF repo data. Copeland, Martin, and Walker (2011) present daily data on Lehman’s tri-party repo book in September 2008 and document that the total amount of repo funding started to contract substantially only a few days prior to Lehman’s bankruptcy filing. They show that the contraction affected all collateral categories, including Treasury collateral.
B. Repo Terms by Counterparty on September 30, 2008 Funding difficulties of dealer banks with high perceived default risk, even if not apparent in repo quantities, could also manifest themselves as a worsening of the price-terms of repo agreements. For this reason, we also examine cross-sectional variation in haircuts and repo rates of different counterparties and find that most of the variation is due to the type of collateral rather than the credit risk of counterparties. This finding further reinforces our conclusion that funding problems at some dealer banks are driven by a lack of high-quality collateral (and a contraction of repo loan supply for low-quality collateral) rather than a general reluctance of repo lenders to extend credit to high-risk counterparties. We again focus our analysis on the end of September 2008, the time when dealer banks faced the most adverse funding conditions. For the purpose of this analysis, we refine our categorization of collateral to deal with some ambiguity in classification of Treasury and Agency collateral. We create an additional mixed Treasury/Agency category for cases in which we cannot cleanly 40
1
2
Haircut 3
4
5
Panel A: Haircuts
0
200
400 600 5−yr Senior CDS Rate 9/30/2008 Treasury Agency
800
1000
800
1000
Treasury/Agency Private
0
2
Repo Rate 4
6
8
Panel B: Repo rates
0
200
400 600 5−yr Senior CDS Rate 9/30/2008 Treasury Agency
Treasury/Agency Private
Figure 9. Overnight repo rates and haircuts on September 30, 2008. Each point in this scatterplot shows the combination of average haircut (Panel A) or average repo rate (Panel B) of a money market fund repo counterparty and the counterparty’s 5-year senior CDS rate at the end of September 2008. Haircuts and repo rates are weighted by the notional amount of each contract and separated by collateral category. Cases in which collateral is a mixed pool of Treasury and Agency securities that cannot be further divided are shown as a separate category. Private-sector securities (privatelabel ABS and corporate debt) are combined into one category. 41
classify the collateral as Treasury or Agency securities. This includes cases, for example, in which the collateral is a portfolio of Treasury and Agency securities. In these cases, we had so far assigned the collateral type that has the highest number of counts in the list of securities comprising the collateral portfolio. But this means that some variation in repo rates within a category could be driven by collateral portfolio composition rather than the characteristics of the repo counterparty. This ambiguity is not significant when Agency and Treasury collateral commands very similar terms in repos, but on September 30, 2008 it could be significant. We further put all non-Treasury, nonAgency collateral into a private collateral group. On September 30, 2008, this group includes almost exclusively corporate bonds or corporate equities. Panel A in Figure 9 plots the (value-weighted) average haircuts of each counterparty, against the CDS rate for 5-year senior debt on September 30, 2008. It is apparent from these figures that average haircuts vary by collateral type, but within collateral categories, they are virtually identical for different counterparties, irrespective of the CDS rate. Panel B plots the (value-weighted) repo rate against the CDS rate. While there is some variation in repo rates within collateral categories, this variation is not correlated with the CDS rate of the counterparty.
VII. Federal Reserve Programs Any evaluation of repo quantities during the financial crisis also must take into account that the the Federal Reserve initiated a series of funding programs, beginning in 2008Q1, that partly replaced private-sector repo lending. While these programs were intended to offset the reduction in private sector funding of the shadow banking sector, it is also possible that these programs attracted some repo borrowers that would have
42
been able to access private markets. We are not able to establish the counterfactual, i.e., the hypothetical amount of repo lending that would have taken place in private markets in the absence of the Fed’s programs, but we can shed light on the extent to which these programs did in fact offset the private contraction in aggregate, and the level of individual dealer banks. We also compare the terms of the Fed facilities versus market terms.
A. Quantity of Fed Funding We focus on three principal programs: 1. PDCF (Primary Dealer Credit Facility), March 2008: Loan facility that provided funding to primary dealers in exchange for any tri-party-eligible collateral.16 Loans were overnight, and made at the primary credit discount rate. 2. TSLF (Term Securities Lending Facility), March 2008: Facility to loan Treasuries from the Fed’s portfolio in exchange for investment-grade collateral.17 Loans were 28-day, and rates were set in an auction. 3. Maiden Lane I and III, various dates: Fed made loans to SPVs that held privatelabel ABS. Facilities were set up in conjunction with interventions in Bear Stearns and AIG. We omit Maiden Lane II, because this SPV acquired assets from AIG’s securities lending business that were, prior to the crisis, funded with cash collateral that AIG obtained in securities lending transactions, which means that these assets were not 16
Before September 14, 2008, the collateral was restricted to investment grade securities (Adrian, Burke, and McAndrews (2009)) 17 Before September 17, 2008 the range of eligible collateral was more restricted (Fleming, Hrung, and Keane (2009))
43
funded with repo prior to the crisis. Maiden Lane III, in contrast, purchased ABS not from AIG, but from dealer banks to whom AIG had sold credit protection on these ABS. These dealer banks may have financed these ABS holdings with repo, and so we include Maiden Lane III. Panel A in Figure 10 aggregates the private-label ABS repos of MMF and SL along with the funding on these securities that came from the Fed through PDCF, TSLF, and Maiden Lane I and III.18 The figure shows that Fed programs offset a considerable portion of the contraction in repo funding starting in 2008Q1. As a result, total funding smoothly decreases during the subsequent quarters. Panel B presents the same data for corporate bond repos. The Fed programs were used much less in this case. But, the private sector funding contraction is also not as severe.
B. Fed Program Participation, by Dealer Bank Where did the dealers with high pre-BSC private collateral shares turn for financing? Column (ii) in Table IV shows that part of the answer is that the Fed provided the funding through the TSLF. In schedule 2 TSLF auctions, dealer banks could bid with investment-grade securities as collateral to obtain Treasury securities on loan against a fee. The dependent variable in column (ii) measures the extent to which a dealer bank utilized the maximum amount that it was allowed to borrow under schedule 2 in the two schedule 2 auctions just before and after 9/30/08 (9/25/08 and 10/1/08). For each auction, we take the ratio of the loan amount awarded to a dealer bank to the maximum possible award, and we average this ratio across the two auctions. We regress this dependent variable on the agency collateral share and the private collateral 18
The split of SL repo between corporate debt securities and private-label ABS is calculated under the assumption that the split (in terms of percentage) is the same as for MMF repos.
44
Amount ($bn.) 100
150
200
Panel A: Private-label ABS
PDCF
50
TSLF
Repo 0
Maiden Lane 2007q1
2008q1
2009q1
2010q1
Quarter
250
300
Panel B: Corporate debt
Amount ($bn.) 100 150 200
PDCF
Repo
50
TSLF
2007q1
2008q1
2009q1
2010q1
Quarter
Figure 10. Repo and Federal Reserve funding of private sector assets.
45
share prior to the Bear Stearns rescue (pre-BSC, December 2007 to February 2008). As the regression results show, dealer banks with a high private collateral share tend to max out their borrowing capacity under schedule 2. The regressions in columns (i) and (ii) also show that dealer banks with a high Agency collateral repo share in the pre-BSC period are more likely to max out their borrowing capacity under both schedules in the TSLF. Moreover, column (iii) shows that the total amount of borrowing under the TSLF on 9/30/08 is positively related to both Agency and private collateral shares in the pre-BSC period. Thus, only dealer banks with high pre-BSC Treasury collateral shares do not resort much to the TSLF (which is sensible, as the purpose of the TSLF was to exchange non-Treasury collateral against Treasuries).
C. Fed versus Market, Program Terms The TSLF terms appears cheaper than market terms. For example, the schedule 2 auction on 10/1/08 yielded a (uniform) loan fee of 1.51%. As the TSLF exchanges non-Treasury collateral against Treasuries, the relevant comparison here is the spread between Treasury repo rates and repo rates for non-Treasury collateral. Figure 9 shows that the spread for private collateral on 9/30/08 was approximately 7%.19 Thus, the TSLF rate of 1.51% appears subsidized relative to market conditions at the time. For Agency collateral, the comparison between the schedule 2 auction and the private market rates is less clear-cut. The spread of Agency repo rates to Treasury repo rates in Figure 9 is often below 1.51%. However, there is a more clear-cut distinction when comparing the schedule 1 auction, which accepted Agency but not private collateral, to 19
Private collateral on this date included a substantial amount of corporate equities, which was not eligible as TSLF collateral. However, the average repo rates for corporate debt and corporate equities were virtually identical on this date.
46
Table IV Fed Program Utilization by Primary Dealers in September 2008 For each dealer bank, we have two explanatory variables: Agency share pre-BSC is the proportion of MMF repos with Agency collateral in the three-month period prior to the rescue of Bear Stearns (December 2007 to February 2008). Private share pre-BSC is the share of corporate debt, private-label ABS, and other non-Treasury, private-label collateral in the pre-BSC period. Dependent variables are defined as follows: For the TSLF, maxout1 denotes average utilization of maximum available borrowing under TSLF schedule 1 (Treasury and Agency collateral) in the two schedule 1 auctions closest to 9/30/08 (9/18/08 and 10/2/08), maxout2 is defined accordingly as the average utilization in schedule 2 auctions (9/25/08 and 10/1/08), while Total refers to the total notional amount of Treasury securities borrowed from the TSLF (in $bn) on 9/30/08. PDCF Total is the total amount borrowed from the PDCF (in $bn) on 9/30/08. We report t-statistics in parentheses.
maxout1 (i)
TSLF maxout2 (ii)
Total (iii)
PDCF Total (iv)
Agency Share pre-BSC
1.43 (2.21)
0.77 (1.58)
46.16 (2.31)
9.34 (0.62)
Private Share pre-BSC
-0.36 (-0.48)
1.10 (1.92)
39.33 (1.66)
57.85 (3.26)
15 0.17
15 0.28
15 0.36
15 0.42
Observations Adjusted R2
the private repo market. The schedule 1 auction on 10/2/08 yielded a (uniform) loan fee of 0.42%, which is lower than most of the Agency repo spreads in Figure 9. How can we understand the differences in these Fed and market terms, especially where the Fed terms are set in a competitive auction? It is possible that the differences are due to measurement problems and not comparing repo terms on exactly identical assets. However, it is also possible that these differences are reflective of a stigma attached to TSLF borrowing. Indeed, as we discuss next, it is fairly clear cut that the PDCF carried such a stigma. Some dealers with a high pre-BSC private collateral share maxed out their funding 47
under TSLF. Where did they fund their excess private collateral? As we know from Figure 7, they did not obtain further repo funding from MMF with this type of collateral. Column (iv) of Table IV provides the answer: They turned to the PDCF. The amount borrowed from the PDCF is strongly positively correlated with the pre-BSC private collateral share. Unlike the TSLF, dealer banks with high Agency collateral shares however avoided the PDCF even though funding rates were attractive for private collateral (2.25% on 9/30/08), and all collateral eligible for tri-party repo funding was also eligible for borrowing under the PDCF. This is consistent with the view that borrowing from the PDCF was viewed as carrying a stigma similar to the stigma associated with discount-window borrowing from the Fed (on which the PDCF was modeled). Borrowing from the PDCF seems to be viewed as a last resort that dealer banks try to avoid at possibly high cost. For example, Lehman Brothers did not access the PDCF in the week prior to its bankruptcy filing (Valukas (2010)). Overall, these findings reinforce the conclusion that the problem of repo was one of funding private collateral. Any heterogeneity in funding conditions among dealer banks was driven by the type of collateral held by the banks. The dealers with high private collateral shares found themselves in difficulty not because of a run on a counterparty per se, but because getting repo financing with private collateral became expensive. To avoid high financing costs in the repo market, dealer banks with high private collateral shares turned to the TSLF and PDCF. Dealer banks with low private collateral shares, in contrast, avoided the PDCF, despite the attractively low rates charged in the PDCF relative to market rates at the time, which was likely due to a discount window stigma.
48
VIII. Conclusion We examine data on the repo lending by money market funds and securities lenders to understand the role of repo in the demise of the shadow banking system, and as a factor in the financial crisis. Money market funds and securities lenders provide the majority of repo funding to the shadow banking system. During the financial crisis, repo funding collateralized by private-label securitized assets contracted sharply. This aspect of the data is consistent with the “run on repo” that has been prominently emphasized by Gorton and Metrick (2010a, 2011, 2010b). However, repo accounts for only a small fraction of the short-term funding of securitized assets in the shadow banking system prior to the crisis. This finding does not support the broadbrush picture painted by Gorton and Metrick that the expansion of repo drove the growth of the shadow-banking system and the subsequent run on repo caused its collapse. The short-term funding of securitized assets through ABCP and direct investments by money market investors is an order of magnitude larger than repo funding, and the contraction in ABCP is an order of magnitude larger than the run on repo. Short-term debt played an important role in the expansion and collapse of the shadow banking sector, but, in aggregate, borrowing via repo from non-bank cash lenders was a sideshow relative to ABCP. While small in aggregate, the run on repo may have contributed to the crisis through an alternative channel: Troubles in funding securitized assets with repo may have been a major source of problems for some systemically important dealer banks that were most heavily exposed to these assets. We find that dealers with a high share of private securities in repo collateral were the most vulnerable, and most likely to access emergency programs of the Federal Reserve. The troubles of dealer banks also provide a potential explanation for the divergence between the terms of the MMF-to-dealer
49
repo in our data (in which haircuts rise only moderately), and the interdealer repo in Gorton and Metrick’s data (which show dramatically rising haircuts): Raising haircuts can be a response by balance-sheet constrained dealers to their own lack of capital and liquidity. Overall, the problems in the repo market during the crisis look less like the analogue of a traditional bank run by depositors and more like a credit-crunch in which dealer banks tightened the terms for their borrowers. Our findings also underscore that it is important to distinguish between non-bank to dealer repo lending (which is a source of net funding for the shadow banking system) and interdealer repo (which reallocates liquidity within the shadow banking system). More research is needed to better understand the role of interdealer repo markets in the dynamics of shadow banking.
50
References Acharya, Viral, Philipp Schnabl, and Gustavo Suarez, 2012, Securitization Without Risk Transfer, Journal of Financial Economics, forthcoming. Adrian, Tobias, Christopher R. Burke, and James J. McAndrews, 2009FRBNY Current Issues in Economics and Finance 15, 1–10. Adrian, Tobias, Karin Kimbrough, and Dina Marchoni, 2011FRBNY Economic Policy Review 17, 25–39. Adrian, Tobias, and Hyun Song Shin, 2009, Money, Liquidity and Monetary Policy, American Economic Review 99, 600–605. Bernanke, Ben S., 1983, Nonmonetary Effects of the Financial Crisis in the Propagation of the Great DepressionThe American Economic Review 73, 257–276. Caballero, Ricardo, and Arvind Krishnamurthy, 2009, Global Imbalances and Financial Fragility, American Economic Review 99, 584–88. Calomiris, Charles W., 1994, Is the Discount Window Necessary? A Penn Central PerspectiveFederal Reserve Bank of St. Louis Review , 31–55. Cole, Harold L., and Timothy J. Kehoe, 1996, A Self-Fulfilling Model of Mexico’s 1994-1995 Debt CrisisJournal of International Economics 41, 309–330. Cole, Harold L., and Timothy J. Kehoe, 2000, Self-Fulfilling Debt CrisesThe Review of Economic Studies 67, pp. 91–116. Copeland, Adam, Antoine Martin, and Michael Walker, 2011, Repo Runs: Evidence from the Tri-Party Repo Market, Working Paper, Federal Reserve Bank of New York. Covitz, Daniel M., Nellie Liang, and Gustavo Suarez, 2012, The Evolution of a Financial Crisis: Collapse of the Asset-Backed Commercial Paper Market, Journal of Finance, forthcoming. Diamond, Douglas W., and Philip H. Dybvig, 1983, Bank Runs, Deposit Insurance, and LiquidityThe Journal of Political Economy 91, 401–419. Diamond, Douglas W., and Raghuram G. Rajan, 2001, Banks, short-term debt and financial crises: theory, policy implications and applicationsCarnegie-Rochester Conference Series on Public Policy 54, 37 – 71. Duffie, Darrell, 1996, Special Repo Rates, Journal of Finance 51, 493–526. Duffie, Darrell, 2010. How Big Banks Fail and What to Do about It. Princeton, NJ: Princeton University Press. Federal Reserve Bank of New York, 2010, Tri-Party Repo Infrastructure Reform. White paper. 51
Fleming, Michael J., Warren B. Hrung, and Frank M. Keane, 2009, The Term Securities Lending Facility: Origin, Design and EffectsFRBNY Current Issues in Economics and Finance 15, 1–10. Fleming, Michael J., Warren B. Hrung, and Frank M. Keane, 2010, Repo Market Effects of the Term Securities Lending Facility, American Economic Review: Papers & Proceedings, 591–596. Garbade, Kenneth D., 2006, The Evolution of Repo Contracting Conventions in the 1980s, FRBNY Policy Review , 27–42. May. Gorton, Gary, 1988, Banking Panics and Business CyclesOxford Economic Papers 40, 751–781. Gorton, Gary, and Andrew Metrick, 2010a, Haircuts, Federal Reserve Bank of St. Louis Review 92, 507–519. Gorton, Gary, and Andrew Metrick, 2010b, Regulating the Shadow Banking SystemBrookings Papers on Economic Activity, 261–297. Gorton, Gary, and Andrew Metrick, 2011, Securitized Banking and the Run on Repo, Journal of Financial Economics, forthcoming. Greenlaw, David, Jan Hatzius, Anil K. Kashyap, and Hyun Song Shin, 2008, Leveraged Losses: Lessons from the Mortgage Market Meltdown, Proceedings of the U.S. Monetary Policy Forum. He, Zhiguo, In Gu Khang, and Arvind Krishnamurthy, 2010, Balance Sheet Adjustments during the 2008 Crisis, IMF Economic Review 1, 118–156. He, Zhiguo, and Wei Xiong, 2012, Dynamic Debt RunsReview of Financial Studies 25, 1799–1843. King, Matt, 2008, Are the Brokers Broken? Report, Citigroup European Quantitative Credit Strategy and Analysis. Krishnamurthy, Arvind, 2010, How Debt Markets Have Malfunctioned in the Crisis, Journal of Economic Perspectives 24, 3–28. Krishnamurthy, Arvind, and Vissing-Jorgensen, 2012, The Aggregate Demand for Treasury Debt, Journal of Political Economy, forthcoming. Martin, Antoine, David Skeie, and Ernst-Ludwig von Thadden, 2012, Repo Runs, Working Paper, Federal Reserve Bank of New York. Pozsar, Zoltan, Tobias Adrian, Adam Ashcraft, and Hayley Boesky, 2010, Shadow Banking, Working Paper, Federal Reserve Bank of New York. Shin, Hyun Song, 2011, Global Banking Glut and Loan Risk Premium, Working Paper, Princeton University.
52
Singh, Manmohan, and James Aitken, 2010, The (Sizable) Role of Rehypothecation in the Shadow Banking System, Working Paper, IMF. Valukas, Anton R., 2010. United States Bankrupty Court, Southern District of New York.
53
Appendix A. Money Market Mutual Fund SEC Filings Data Table A.I lists the fund families for which we have collected repo data as of the time of this writing, along with the CIK numbers under which their portfolio holdings reports are filed with the SEC. Often the reports of many or all money market funds of a family are filed under the same CIK number. In other cases (e.g., Dreyfus), the reports are filed under different CIK numbers. The most difficult part of the data collection is the classification of collateral. Typically, the holdings reports provide a brief description of the collateral underlying the repo agreement, such as ”U.S. Treasury Securities”, or a list of specific securities (in terms of maturity, coupon rate, and issuer). In some cases, the portfolio of securities underlying a repo agreement can be a mix of different types of securities. The most common case of mixed collateral involves Treasury securities mixed with Agency bonds or Agency-backed MBS. private-label backed ABS or corporate bonds are only very rarely mixed with Treasuries and Agency securities. Except in rare cases, the filings do not report the portfolio weights. To approximate the portfolio weights, we count the number of securities in the list of securities in the portfolio, and we assign portfolio weights based on the relative number of times a collateral type is mentioned in this list. For quantity calculations, we split the notional value of a repo agreement with a portfolio of collateral based on these portfolio weights. For calculations involving repo terms by collateral, we assign the collateral type that has the highest number of counts in the list of securities. Some fund families (e.g. Goldman Sachs and Fidelity) have the funds in their family pool much of their repo investments in a joint account. For these joint accounts, the filings report a list of counterparties to the repos in this joint account, but only one repo rate for the whole account, and only the total collateral amount for the whole joint account, while notional values are listed by counterparty. We assign the single repo rate and the same haircuts to all counterparties to the repos in this joint account.
B. Risk Management Association Securities Lender Data Some securities lenders do not participate in the RMA survey in some quarters (see table A.II. Participants are marked with “x”). The biggest worry in this regard is about the non-participation of State Street in some of the surveys. State Street’s cash collateral reinvestments amount to more than $0.5 trillion, and so omission of State Street would substantially understate the role of securities lenders. For this reason, we 54
Table A.ISample of Money Market Fund Families
Fund family
CIK numbers
AIM/Invesco Blackrock Columbia Dreyfus
842790, 828806, 205007 97098 1097519, 751200, 1477434 1171061, 819940, 717341, 871967, 312564, 885409, 831363, 878092, 863471, 814236, 865440, 779128, 885408, 30158, 30160, 846421, 759667, 820482, 740766, 878092, 315783, 1038520, 1423799, 315668, 871967, 863510, 1449014, 867955, 312564, 831363, 814236, 878734, 863558, 779128, 740123, 796251, 843781 353447, 858372, 862157, 55189, 703642, 88047, 863209 820636, 1046233 856517, 852495 278001, 35315, 276516, 356173, 704207, 917286 356134 822977 1217286, 763852 1227155, 93285, 859037, 356409 916620, 710124 836423, 312538, 1358587, 74673 83335 857156 225732, 780403, 1060517, 868055, 930007, 703876, 703875, 944684, 1403166 106830, 891190, 783401, 821404, 788599, 862341, 788606 1081400 747576, 889512, 850628
DWS Evergreen Federated Fidelity First American Goldman Sachs JP Morgan Morgan Stanley Northern Oppenheimer Reserve Schwab UBS Vanguard Wells Fargo Western
55
56
AIG Global Investment Corp Mellon Fin. Corp./Bank of New York Mellon Barclays Global Investors Boston Global Adv./Goldman Sachs Agcy. Lend. Brown Brothers Harriman & Co. Citibank, N.A. Comerica Bank Credit Suisse Dresdner Kleinwort Frost National Bank Investors Bank & Trust Company JPMorgan Chase & Co. M & I Global Securities Lending MetLife Insurance Company The Northern Trust Company PFPC Trust Co./PNC Global Inv. Serv. State Street U. S. Bank, N.A. Union Bank of California, N.A. The Vanguard Group, Inc. Wachovia Global Securities Lending Wells Fargo Institutional Investments e x x x x x
x
x x x x x x
2006 Q4 x x x x x x
x x x x x x x e x x x x x
Q1 x x x x x x
x x x x
e
x x e x x x x x
x x
x x x
x
x
2007 Q2 Q3 x x x x x x x x x x x x x x x
e x x x x x
x
x x
x
Q4 x x x x x x x x
x x x x
e
x
x x
x
x x x x x
Q1 x x
x x x x x x x x
x x
x x e x x x x x
x x
2008 Q2 Q3 x x x x x x x x x x x x x x x x x
x x x x x x x x
x x
x
x x
x x x
Q4
x x x x x x x x
x x
x
x x x x
x
Q1
x x x x x x x x
x x
x
x x x x x x
x x x x x x x x
x x
x
x x x x x x
2009 Q2 Q3
x x x x x x x
x x
x
x x x x x x
Q4
Entries labeled “e” indicate quarters in which State Street did not participate in the RMA survey, and in which we obtain the total amount of cash collateral from State Street’s 10-K/10-Q filings, and we estimate State Street’s allocation of this cash collateral to different assets under the assumption that the allocation is the same as the allocation reported in the RMA for survey participants. For Investors Bank & Trust Company the series ends because the company was acquired by State Street.
Table A.IIRMA Survey Participants
x x x x x x x
x x
x
x x x x x x
2010 Q1
impute State Streets’ cash collateral reinvestment position (marked with “e” in Table A.II). We collect the total cash collateral reinvestment amount from State Street’s 10-K and 10-Q filings, and we assume that State Streets cash collateral is invested in the same way as the aggregate cash collateral portfolio of the securities lenders that participate in the RMA survey in a given quarter. A comparison of the portfolio allocations in adjacent quarters in which State Street does and does not participate does not reveal any substantial shifts in allocations. This indicates that State Streets portfolio allocation is unlikely to be very different from the allocation of other securities lenders.
C. Counterparty Identifiers The counterparty identifiers in Figure 7 refer to the following institutions • bac = Bank of America • bcs = Barclays • bsc = Bear Stearns • bnpqy = BNP Paribas • c = Citigroup • cfc = Countrywide • cs = Credit Suisse • db = Deutsche Bank • drb = Dresdner Kleinwort • gs = Goldman Sachs • hbc = HSBC • ing = ING • jpm = JPMorgan • leh = Lehman Brothers • mer = Merill Lynch • mfg = Mizuho • ms = Morgan Stanley • rbs = Royal Bank of Scotland • scgly = Societe Generale • ubs = UBS • wb = Wachovia 57