Support Vector Machine Fusion of Multisensor Imagery in Tropical Ecosystems Robin Pouteau, Benoît Stoll and Sébastien Chabrier ;
South Pacific Geosciences (GePaSud) Laboratory --- University of French Polynesia (UPF) BP 6570 --- 98702 FAA’A --- French Polynesia E-mail:
[email protected],
[email protected],
[email protected] ;
Abstract------One of the major stakeholders of image fusion is being able to process the most complex images at the finest possible integration level and with the most reliable accuracy. The use of support vector machine (SVM) fusion for the classification of multisensors images representing a complex tropical ecosystem is investigated. First, SVM are trained individually on a set of complementary sources: multispectral, synthetic aperture radar (SAR) images and a digital elevation model (DEM). Then a SVM-based decision fusion is performed on the three sources. SVM fusion outperforms all monosource classifications outputting results with the same accuracy as the majority of other comparable studies on cultural landscapes. SVM-based hybrid consensus classification does not only balance successful and misclassified results, it also uses misclassification patterns as information. Such a successful approach is partially due to the integration of DEM-extracted indices which are relevant to land cover mapping in non-cultural and topographically complex landscapes. Keywords------Support vector machines (SVM), Image fusion, Land cover mapping, Multispectral image, Synthetic aperture radar (SAR) image, Digital elevation model (DEM). I. INTRODUCTION
In recent years, multisource data fusion has received significant attention for both military and civilian applications as well as in robotics, medical diagnostics or remote sensing. The latter is the observation of objects and features without contact and includes mapping and digital image processing techniques using aerial photography and satellite imagery. Today, there is a range of many satellite and airborne sensors providing various spectral and spatial resolutions imagery. With the increasing development of Geographical Information Systems (GIS), additive geographic data are becoming widely available. Data fusion of remote sensing and geographic data sources is a very challenging problem. Remote sensing and GIS provide a unique tool for effective collection of explicit spatial data which are needed to understand landscape-level ecological processes [1]. These tools are also critical for biodiversity science and conservation [2]. Land cover discrimination is a first critical step for understanding ecosystems [3] and one of the most common applications in the field of remote sensing [4]. Several works show that the combined use of multisource remote sensed data improves accuracy of land cover classification [5]-[9]. Using different fusion algorithms, these studies combine different couple of sources including multispectral, Synthetic Aperture Radar (SAR) and Digital Elevation Model (DEM)extracted data, but never the three. Waske and al. [4] compare the most popular algorithms (namely neural networks, decision trees, boosted decision trees and Support Vector Machines (SVM)) and come to the conclusion that SVM give the best performance in their case study. The majority of the above presented papers [4]-[9] focus on cultural area i.e. structurally simple systems. In this paper, we aim to investigate the contribution of SVM fusion of multisource imagery in processing structurally complex
systems such as tropical ecosystem of high volcanic islands at a fine scale. The remainder of this paper is organized as follow. SVM methods are first introduced. The following part is dedicated to the framework of the study and the remote sensed data we used. Then results involving monosource and multisource classifications are presented. Part V discusses these results while last one gives our main conclusions. II. SVM METHODS
SVM is a relevant statistical tool for our case study because it is adapted to numerous and heterogeneous data and mixtures of qualitative and quantitative variables and need a small training set [10]. Its complete mathematical formulation can be found in [11] and [12]. We only give here a brief description of the algorithm. Originally introduced as a binary classifier [13], SVM uses two classes training samples within a multi-dimensional feature space to fit an optimal separating hyperplane. In this way, it tries to maximize the margin which is the distance between the closest training samples (or support vectors) and the hyperplane itself. Lets consider N available training samples represented by the pair (yi, xi), i = {1..N}with yi = ±1 being the class label. A hyperplane in feature space is defined by the equation w.x+b = 0, where x is a point lying on the hyperplane, w is a normal to the hyperplane and b is a bias parameter. The maximization of the margin with support vector hyperplanes equations leads to the following optimization problem: 1 min w ² 2 (1)
where yi( w.xi + b) − 1 ≥ 0 If the problem is not linearly solvable, a regularization parameter C and an error variable i are added to deal with outlier vectors [11], [12]. With the addition of the so-called penalty term, the optimization problem becomes: N " %1 min # w ² + C & ξi (2) #$ 2 i =1 ! where yi( w.xi + b) − 1 + ξi ≥ 0 and ξi ≥ 0 So, C controls the trade-off between maximisation of the margin and penalization of the training samples located on the incorrect side of the hyperplane. When no hyperplane can be found in the input space, training vectors are projected into a higher dimension space to help the fitting of the hyperplane. That extensive computationally transformation process is reduced by using a positive definite function k(x, xi), called kernel function. The classification function ℑ is then: ,N ) ℑ( x ) = sign * & αi yik ( x , xi) + b ' * ' + i =1 (
(3)
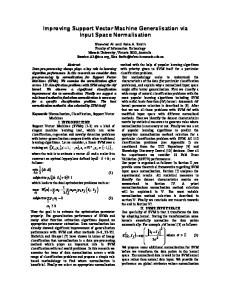
1207 m
0m Fig. 1. DEM of the Moorea island.
This optimization is performed through the Lagrangian formalism; !i denotes the Lagrange multipliers. Following [14] and many other authors, we retain the Gaussian radial basis function as kernel: k ( x , xi) = exp − γ x − xi ² (4) where γ is a kernel parameter The principle of SVM has been designed for two class problems but most of the problems in remote sensing science deal with multiple classes. Several multiclass extensions have been developed [15]. Among them, the “one against all” algorithm split the problem into p(p-1)/2 subproblems by separating each pair of classes (p is the number of classes). We choose to use this extension, by far the most popular. Dealing with SVM fusion, several approaches have been investigated by Waske and al. [4]. These studies show that the decision fusion presented hereinafter gives good performances: (i) SVM is trained on the different bands of the different sources outputting a monosource classification image for each source; (ii) a posteriori, these outputted images are inputted in an additive SVM being in use as decision fusion to predict the final class membership of each sample. In addition to the performance of SVM in monosource, the architecture of this system profits from their ability to deal with mixtures of qualitative and quantitative variables. In our case study, 2 ha per class are used for training (N) and 2 ha are used for validation. These samples are collected in the field TM with a Trimble® GeoXH GPS. To avoid possible class over/under-representation problems, balanced datasets are thus systematically used [16].
(
)
III. STUDY SITE AND DATA
Moorea is a French Polynesian island, an overseas country in the South Pacific Ocean. Located between 17°30’-17°35’S and 149°45’-149°55’W, Moorea is a 132 km² area culminating at 1207 m a.s.l. (mont Tohiea) (Fig. 1). The present work is performed within the framework of the Moorea Biocode Project. The latter aims to create the first comprehensive inventory of all nonmicrobial life in a complex tropical ecosystem (see http://www.mooreabiocode.org/ for more information). Land cover map is a preliminary but essential stage to understand the functioning of such an entire ecosystem. To our knowledge, this paper is the first to apply SVM fusion on the three following multisensor data. The architecture of the decision fusion we used is presented in Figure 2.
Fig. 2. Schematic diagram of the SVM-based decision fusion
First, a three waveband (from green to near infrared (NIR) channels) multispectral SPOT scene of the test site acquired on 20 April 2001 was used for processing purposes. This image as well as the following ones is orthorectified and registred to WGS 84 – UTM 6 South coordinate system. Secondly, we use SAR data which allow extracting various polarimetric indices characterizing the vegetation backscatter (see [17] for an application in French Polynesia). Analyses are computed on a scene from the NASA PACRIM II JPL-AirSAR mission of 2000 which had flied over Moorea and provided 5mresolution airborne SAR data in 2 bands: PolSAR L (" =23 cm) in full polarimetry and TopSAR C (" =5.7 cm) in the single vv polarimetry. This active sensor imagery is of particular interest over tropical areas due to the cloudy condition usually persistent. Its main drawback for application in high volcanic islands is the steep orography generating frequent shadows. Multispectral and SAR data are in this way complementary. The full polarimetry Lband is delivered as multilook complex format consisting in compressed Stokes matrix [18]. SVM are trained on linear intensities Cvv, Lhh, Lhv and Lvv. Digital speckle is filtered with a Frost filter (damping factor=1; window size=5x5 pixels) showing good results in preserving edges information [19], [20] which is crucial for the future use of the map. Land cover classification has been hugely applied on multispectral and SAR data in the past. According to [2], the remote sensing of certain environmental parameters can be used as an indirect method for discerning patterns of species distribution, among them habitat structure and topography. A few research works show that topography could actually be efficiently used to perform land cover classification processed with neural network [21] and SVM [7]. Climatic factor such as rainfall, moisture and temperature are typically variable in mountainous areas, affecting vegetation distribution patterns by controlling key ecological processes [22], [23]. Relevant topographical indices can thus be efficiently used as a proxy of the environmental situation. In consequence a 5 m-resolution DEM is used as a third source to extract three indices, namely elevation (meters a.s.l.), slope steepness (degrees) and aspect (dimensionless i.e. north, east, south or west) quantifying solar radiation and exposition to the trade winds. IV. RESULTS
The resulting SVM-based decision fusion outputs the land cover map presented in Figure 3. For classification assessment terminology, see [24]. In particular, Kappa coefficient expresses whether correctly assigned pixels may have been assigned by chance or not based on the classification decision rule. A value of 1 indicates perfect agreement and 0 indicates a pattern arising by chance. Moreover, producer’s accuracy (PA) represents the number
Table 1. Classification accuracies in function of inputted source(s). Data Optical + NIR SAR DEM SVM fusion
OA (%) 67 74 66 94
Kappa 0.62 0.71 0.61 0.93
Table 2. Classifications confusion matrices according to input source(s): multispectral (a), SAR (b), DEM (c) data lonely and the three merged by means of a SVM-based decision fusion (d). See Figure 3 for classes abbreviations. Percentage of successfully classified pixels is given by the colour set hereinafter:
<10
1020
a)
of correctly assigned pixels for a class divided by the actual number of ground truth pixels for that class. Classification applied on monosource multispectral imagery has an overall accuracy (OA) of 67% and a Kappa coefficient of 0.62 (Table 1). Major confusions are explained by the inability of the classifier to segment response from the hygrophilous serie, the fernlands, the fields and the urban areas essentially (Table 2). Classification trained on monosource multispectral imagery is suitable to discriminate land covers standing out by their colour (passive absorption spectra). Thanks to the NIR wavelength, coniferous and deciduous trees are easily discriminated. According to [25], this disparity is caused by a proportion difference of leaf parenchyma between the two taxa. SAR imagery-based classification gives the best monosource results with an OA of 74% and a Kappa coefficient of 0.71 (Table 1). However, these results are penalized by a marked confusion between fernlands and the mesophilous serie and between urban and marshes. From pattern of successful classification and misclassification, we deduce that the success of SAR data-based classification comes from interaction mechanisms between the scattered signal and the structural or architectural characteristics of the upper layer of the target (the canopy in the case of a tree cover). Scores from the DEM-based classification prove the fact that the orophilous serie (PA = 100%) and the fernlands (PA = 90.2%) have a specific ecological niche, the orophilous serie being typical of high elevations while fernlands are generally found on ridges, where slope is nil and elevation high (Table 2). Conversely, misclassified classes have a wider ecological spectrum. In this way, the DEM-based classification gives satisfactorily an OA of 66% in monosource (Table 1). Finally, SVM fusion leads to fairly good results with an OA of 94% (Table 1), each class having a PA superior to 87%. Multiplication of data sources, both structural - using complementary sensors - and functional outperforms accuracies of other classifications. V. DISCUSSION
2030
3040
4050
5060
6070
7080
8090
OS
HS
MS
FL
M
F
BL
U
OS
HS
MS
FL
M
F
BL
U
OS
HS
MS
FL
M
F
BL
U
OS
HS
MS
FL
M
F
BL
U
>90
OS HS MS FL M F BL U
b) OS HS MS FL M F BL U
c) OS HS MS FL M F BL U
d) OS HS
We assess the ability of SVM to integrate multiple sources, consisting of multispectral, SAR and DEM-extracted data, for land cover classification. We outline in particular the performance improvements that can be achieved by integrating terrain attributes into land cover classification. In this sense, our study corroborates the observations of [21], [3] and [7] which should be considered as a generality in complex terrain. SVM fusion is based on a separate training of the SVM and a subsequent fusion of the preclassified outputs by another SVM. Our results demonstrate that such a SVM fusion is able to integrate the complementary and synergistic information of each monosource classification. The imagery from different sensors may not be equally reliable. We face (i) complementary information: some image features appear in one source but not in the other; (ii) common but contrast reversal information: there are various regions that occur in some image but with opposite contrast; (iii) discrepancies between
MS FL M F BL U
sensors: input images come from different types of sensors which have different dynamic ranges and different resolutions. As a result, the accuracy of land cover classes, which is critical in monosource, is significantly increased. Analysing Table 2, we can notice that SVM-based hybrid consensus classification does not only balance successful and misclassified monosource results, but
it also uses patterns of misclassification of each couple of classes to separate them optimally.
A future work based on Quickbird and TerraSAR-X additive imagery will aim to assess the lowest integration level we can reach using SVM fusion of multisensor very high resolution imagery. Another research perspective will investigate further SVM-based decision fusion. VI CONCLUSION
Most of papers studying remote sensed data fusion are related to cultural area. This paper focuses on a non-cultural tropical ecosystem where the spatial complexity reaches its maximum. We point out that the development of remote sensing imagery and processing techniques together enable mapping a complex ecosystem with a fairly reliable accuracy and at a fine scale. One of the major stakeholders and benefits of fusion for image classification is being able to process the most complex possible systems at the finest possible integration level and with the same accuracy as the majority of other comparable studies on simpler study cases. AKNOLEDGEMENTS Orophilous serie (OS)
Marsh (M)
Hygrophilous serie (HS)
Field (pineapple above all) (F)
Mésophilous serie (MS)
Bare land and lake (BL)
Fernland (FL)
Urban (U)
Fig. 3: Moorea land cover map obtained by means of multisource SVM fusion.
As an example, 62% of the pixels of the urban class are well classified and 19% are mistaken with fields in Table 2.a. Likewise, 62% are well classified and 23% are mistaken with marshes in Table 2.b. 68% are well classified and 22% are mistaken with bare lands and lakes in Table 2.c. We argue that SVM-based decision fusion method, as it is applied in this paper, is capable of recognizing that a pixel classified in the field class on multispectral imagery, in the marsh class on SAR imagery and in the bare land and lake class on the DEM probably belongs to the urban class. This phenomenon is due to the sequential decision fusion we used. Without this sequentiality i.e. using a single SVM trained on the whole multisource data set for example, integrating misclassification information will be impossible. As exposed by [26], class definition is often source specific. OS, HS, MS and FL classes may have been fused in the assembling class “natural vegetation” for the SAR data-based classification. Nevertheless, by its ability to deal with patterns of misclassification of each couple of classes, the presented decision fusion integrates the inter-class similarities and thus forms necessary joint inference without modifying classes label. That is another deciding argument in favour of the presented method. New available statistical tools like SVM are highly suitable for the integration of various spatialized data. Remote sensed data has the advantage to overcome the inherent limitations of analytical mechanics in ecosystems by studying the emergent properties of aggregates of large numbers of interacting objects [27]. Complementary data allows integrating emergent properties at multiple scales corresponding to image resolutions. They also outshine distinct properties of the target according to its interaction with sensed wavelength. In our paper, these properties are ecological, architectural, physiological and anatomical thanks to the use of DEM, SAR, optical and NIR data respectively.
The authors are grateful to the Government of French Polynesia and its Urbanism Department for the provision of the SPOT, the AirSAR and the DEM data. REFERENCES
[1] S. P. S. Kushwaha, V. K. Dadhwal and S. J. van Bloem. Remote sensing of tropical environment. Tropical Ecology, 51(1): 1-2, 2010. [2] W. Turner, S. Spector, N. Gardiner, M. Fladeland, E. Sterling and M. Steininger. Remote sensing for biodiversity science and conservation. Ecology and Evolution, 18(6), 2003. [3] Y. Xie, Z. Sha and M. Yu. Remote sensing imagery in vegetation mapping: a review. Plant Ecology, 1(1): 9-23, 2008. [4] B. Waske and J. A. Benediktsson, Fusion of Support Vector Machines for ClassiÞcation of Multisensor Data. IEEE Trans. Geosci. Remote Sens., 45(12): 3858-3866, 2007. [5] J. A. Benediktsson and I. Kanellopoulos. Classification of multisource and hyperspectral data based on decision fusion. IEEE Trans. Geosci. Remote Sens., 37(3) 1367-1377, 1999. [6] D. B. Michelson, B. M. Liljeberg and P. Pilesjo. Comparison of algorithms for classifying Swedish landcover using Landsat TM and ERS-1 SAR data. Remote Sens. Environ., 71(1): 1-15, 2000. [7] J. H. Halldorsson J. A. Benediktsson and J. R. Sveinsson. Support vector machines in multisource classification. IEEE International Geosci. Remote Sens. Symposium, 3: 2054-2056, 2003. [8] G. Chust, D. Ducrot and J. L. Pretus. Land cover discrimination potential of radar multitemporal series and optical multispectral images in a Mediterranean cultural landscape, Int. J. Remote Sens. 25(17): 540-552, 1990. [9] X. Blaes, L. Vanhalle and P. Defourny. Efficiency of crop identification based on optical and SAR image time series, Remote Sens. Environ., 96(3): 352-365, 2005. [10] G. M. Foody and A. Mathur. The use of small training sets containing mixed pixels for accurate hard image classification: training on mixed spectral responses for classification by a SVM. Remote Sens. Environ., 103: 179-189, 2006. [11] V. Vapnik, A. Chervonenkis. The necessary and sufficient conditions for consistency in the empirical risk minimization method. Pattern recognition and Image Analysis, 1(3): 283-305, 1991. [12] C. J. Burges. A tutorial on support vector machines for pattern recognition. In Data mining knowledge discovery, Norwell, MA: Kluwer, 1998.
[13] V. Vapnik and A. Chervonenkis. Statistical learning theory. In Support vector machines for pattern recognition. New York: John Wiley & Sons, 1998. [14] C. W. Hsu, C. C. Chang and C. J. Lin. A practical guide to support vector classification. Technical report, Department of Computer Science and Information Engineering, National Taiwan Univ., Taiwan, 2009. [15] B. Scholkopf and A. J. Smola. Learning with kernels, support vector machines, regularization, optimization and beyond. Cambridge: MIT Press, 2002. [16] B. Waske, J. A. Benediktsson and J. R. Sveinsson. Classifying remote sensing data with support vector machines and imbalanced training data. In Multiple Classifiers Systems. Heidelberg: Springer Berlin, 2009. [17] C. Lardeux, P. L. Frison, C. Tison, J. C. Souyris, B. Stoll, B. Fruneau and J. P. Rudant. Support vector machine for multifrequency SAR polarimetric data classification. IEEE Trans. Geosci. Remote Sens., 47(12): 4143-4152, 2009. [18] J. J. van Zyl and A. Chu. AIRSAR integrated processor documentation, data formats. 2003. Available online at http://airsar.jpl.nasa.gov/data/data_format.pdf [19] Z. Shi and K. B. Fung. A comparison of digital speckle filters. IEEE International Geosci. Remote Sens. Symposium: 2129-2133, 1994.
[20] M. R. de Leeuw and L. M. Tavares de Carvalho. Performance evaluation of several adaptative filters for SAR imaging. XIV Brasilian Remote Sensing Symposium (Natal): 7299-7305, 2009. [21] J. A. Benediktsson, P. H. Swain and O. K. Ersoy. Neural network approaches versus statistical methods in classification of multisource remote sensing data. IEEE Trans. Geosci. Remote Sens., 28(4): 540-552, 1990. [22] J. Chen, S. C. Saunders, T. R. Crow, R. J. Naiman, K. D. Brosofske, G. D. Mroz, B. L. Brookshire and J. F. Franklin. Microclimate in forest ecosystem and landscape ecology. Bioscience 49: 288-297, 1999. [23] L. Nagy, G. Grabherr, C. Körner and D. B. A. Thompson. Alpine biodiversity in Europe. Berlin: Springer Verlag, 2003. [24] G.C. Russell and G. Kass. Assessing the Accuracy of Remotely Sensed Data: Principles and Practices, Boca Raton, FL: CRC Press, 2009. [25] J. G. Boureau. Manuel d’interprétation des photographies aériennes infrarouges Application aux milieux forestiers et naturels. Nogent-sur-Vernisson: IFN, 2008. [26] J. A. Richards. Analysis of remotely sensed data : the formative decades and the future. IEEE Trans. Geosci. Remote Sens., 43(3): 422-432, 2005. [27] T. J. Hatton, G. D. Salvucci and H. I. Wu. Eagleson’s optimality theory of an ecohydrological equilibrium: quo vadis? Functional Ecology, 11: 665-674, 1997.