The Private Equity Premium Puzzle Revisited∗ Katya Kartashova University of Minnesota and Federal Reserve Bank of Minneapolis
This Version: July 23, 2009
Abstract In this paper, I extend the results of Moskowitz and Vissing-Jørgensen (AER, 2002) on the returns to entrepreneurial investments in the United States. First, I replicate the original set of findings from the Survey of Consumer Finances (SCF) for the period of 19891998 following the authors’ methodology. I then extend the period under consideration using data from subsequently released waves of SCF 2001, 2004 and 2007 and assess the robustness of their results to this extension. I find that the ”private equity premium puzzle” is not a robust feature of the data and does not survive beyond the period of high public equity returns in the 1990s. Returns to entrepreneurial equity remain largely unaffected when public equity returns plunge between 1999 and 2001. I validate this result using private equity industry returns. JEL Classification: G11 Keywords: Entrepreneurship, equity premium, private equity
∗
I am grateful to my advisor Narayana Kocherlakota for his continued guidance and encouragement throughout this project. I am very thankful to Brian Bucks for sharing his expertise on SCF, and to Gerhard Fries for answering data inquiries on SCF. I thank Dick Todd for his help at the early stages of this project. I thank Martin Schneider for very helpful discussions at the start of the project. I also thank Laurence Ales, Frederico Belo, Nick Guo, and Annette Vissing-Jørgensen for helpful suggestions. I acknowledge and thank Mallory Leung for her contribution at the early stages of this project. I am grateful to the staff of the Thomson Reuters (then Thomson Financial) Helpdesk, who worked tirelessly on my inquiries regarding SDC Platinum database, and the members of the Data Team, who helped resolve discrepancies in the data. I thank Joan Gieseke for excellent editorial assistance. All remaining errors are mine. Contact:
[email protected]
1
1
Introduction
In this paper, I extend the results of Moskowitz and Vissing-Jørgensen (2002) (henceforth MVJ) on the returns to entrepreneurial investments in the United States. First, I replicate the original set of findings in Moskowitz and Vissing-Jørgensen (2002) using the authors’ methodology and data from the four Surveys of Consumer Finances available for the period from 1989 to 1998. I then incorporate into analysis subsequently released waves of SCF 2001, 2004 and 2007 and assess the robustness of the findings to this extension. I focus on the results regarding the composition of entrepreneurial portfolios and relative returns to private equity. In the extended period, I find an equally high concentration and poor diversification in entrepreneurial portfolios documented in MVJ.1 When comparing returns to the indices of entrepreneurial and publicly traded equity (given by both CRSP market index and S&P 500 index return), I also find that entrepreneurial equity significantly outperformed public equity in the later period. In particular, in 1999-2001 the average public equity returns fell dramatically to non-positive values reflecting the poor performance of public equity markets, while returns to entrepreneurial equity remained largely unaffected. This is in sharp contrast to the original finding of Moskowitz and Vissing-Jørgensen (2002) that over the period from 1989 to 1998 private equity returns were no higher than returns to public equity. From an accounting perspective, this result is due to the continued loss in the value of outstanding public equity between 1999 and 2002. The value of private equity over the same period, if anything, has grown. This raises the question of the accuracy of owners’ valuations of non-traded private equity in the absence of active markets as in the case of public equity. To address this issue, I validate my findings using returns of investors in private equity industry. The original finding by Moskowitz and Vissing-Jørgensen seemed to suggest a ”far worse risk-return trade-off in the privately held firms of entrepreneurs relative to public equity” and has been termed the ”private equity premium puzzle.” This ”puzzle” is not a robust feature of the data and does not survive beyond the 1990s, a period of extraordinarily high public equity returns. The paper is organized as follows. Section 2 provides an update from SCF 2001, 2004 and 2007 on the basic facts regarding the relative size of public and private equity, as well as the concentration of entrepreneurial portfolios in the United States, and presents extended series of returns to public and private equity for the period from 1989 to 2007. Section 4 1
See Table 6 for a comparison of statistics on the concentration of entrepreneurial investments in their firms and public equity ownership concentration for SCF 1995, 2004 and 2007.
2
validates the results using different measures of investment returns in private equity industry. Section 5 provides the discussion of the assumptions behind the original MVJ methodology and their alternatives. It also reports on the robustness of the results to them. Section 6 concludes.
2
Performance of Private and Public Equity Beyond 1989-1998
In this section, I report extended series for the statistics pertinent to the household’s sector aggregate public and private equity holdings and their investment performance in the aftermath of the 1990s.
2.1
Aggregate Values of Private and Public Equity
The private equity refers to owner’s capital in non-traded unincorporated businesses such as sole proprietorships, general and limited liability partnerships, limited liability limited partnerships, limited liability companies, and non-traded shareholders’ equity in incorporated businesses such as subchapter S & C corporations. In turn, the public equity refers to direct and indirect share holdings in publicly traded companies. Table 1 reports the total values of private2 and public equities owned by households in SCF, as well as the value of public equity from CRSP between 1989 and 2007. Public equity had grown substantially over this time period gradually overtaking private equity. Since 1998 some of these gains had been reversed, however. The series in Table 3 show that from 1999 to 2002 public equity had been losing in value every year. With its value in 2001 only slightly above that in 1998, the average annual growth rate of public equity over this period was well below its 1989-1998 average. On the contrary, as reported in Table 1 the value of private equity has been growing at a fairly constant rate throughout. These changes in the aggregate values are important in accounting for the relative performance of the public and private equity over the extended period. The benchmark results in the paper use values of public equity from CRSP. Estimates from SCF are reported for reference. The public equity holdings in the latter exclude a number of categories included in CRSP, which explains the systematic downward bias in their 2
With respect to the value of private equity, the precise formulation of the question included in the SCF codebook is as follows: For how much could you sell your (share of) business?
3
values in Table 1.3 An additional source of discrepancies between CRSP and SCF comes from the reporting of indirectly held equities in mutual, defined contribution retirement plans, and trusts, etc. These often combine bonds and stocks investments, and the split reported in SCF may not be entirely accurate. In terms of the time series behavior, the SCF value of public equity appears to diverge substantially from CRSP between 1998 and 2004. The household sector’s public equity holdings in CRSP are obtained by multiplying its total value by 0.7, which is its average share that has remained rather stable over time. Given this, the value of public equity in household’s sector would follow closely its total. In CRSP, the market value of public equity increased slightly between 1998 and 2001 and then more dramatically between 2001 and 2004. In SCF, on the contrary, the value of public equity experienced significant growth between 1998 and 2001 and then declined somewhat between 2001 and 2004. Given this inconsistency, I include in Table 1 the alternative series for the public equity series from SCF, which use the information on the behavior of total public equity from CRSP. For the value of public equity in 2001 they use the weighted average of SCF values in 1998 and 2004 with the weights reflecting the percentage of the equity growth from 1998 to 2004 that occurred between 1998 and 2001 in CRSP.4 The other statistics reported in Table 1 include various measures of profits and labor compensation of privately held businesses and the dividend distributions of the publicly traded companies used in the construction of returns to public and private equity in Section 2.2.
2.2
Aggregate Returns to Private and Public Equity
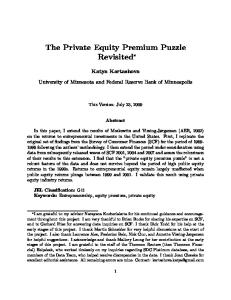
I follow MVJ methodology to replicate returns to an index of private equity for the period 1989-1998 and to extend the series to 2007. The SCF is a cross-sectional survey and is carried out triennially. Figure 1 shows data that are available for the construction of returns over any three-year period between the two surveys, e.g., SCF 1989 and 1992. The values of equity are concurrent with the year of the survey, and the values of profits (net income) correspond to the preceding year. 3
Excluded from SCF holdings are public equities owned by defined benefit retirement plans, including state and local government retirement plans, or by nonprofit organizations, insurance companies, and foreigners. More systematically, comparison of SCF with other sources of aggregate statistics is addressed in Antoniewicz (2000). 4 This is similar to the imputation used by MVJ with respect to the 1995 value of profits of proprietorships and partnerships.
4
Net income (NI) 1988
1988
Market value (MV) 1989
Net income (NI) 1991
1989
Market value (MV) 1992
1991
1992
Time, t
Return for 1989-1992 Figure 4. Time line for computing returns
Figure 1: Time line for computing returns The private equity return R over the period 1989-1992 is computed as the geometric average of returns R1 and R2 , where: R1 = (
MV1992 + 3 · NI1988 13 ) MV1989
(1)
R2 = (
MV1992 + 3 · NI1991 13 ) MV1989
(2)
p R = ( R1 · R2 − 1) · 100%
(3)
The raw returns to an index of all private equity and to indices of corporate and noncorporate private equity constructed using (1)-(2) are reported in lines 1-3 in Table 2. In the remainder of Table 2, I report raw returns with adjustments in stages for (i) the profit tax; (ii) retained earnings; (iii) labor income of entrepreneurs managing their own businesses; (iv) firm birth and new equity investment; and (v) the exit of firms through IPO, mergers and acquisitions, and liquidation. These adjustments apply both to the market value of equity (MV) and to net income (NI) in (1)-(2). Lines 7-24 of Table 2, provide comparison of replicated and original returns for the period 1989-1998 after each stage of adjustment. The originals are reported in parentheses, and replicated returns for all private equity and corporate/noncorporate equity mirror them very closely.5 The final returns to all private equity are reported in lines 23 and 24 (the originals) of Table 2. For the benchmark comparison, I use CRSP market index return reported in line 30 5
It would be impossible to replicate these results exactly, since the SCF is edited periodically and the old versions of the survey data are replaced by the new ones. For a list of all changes to the data, see http://www.federalreserve.gov/PUBS/oss/oss2/changes.html.
5
of Table 2. This is a value-weighted portfolio return for all available stocks in the trading period.6 The number reported for each three-year period is the geometric average of the annual returns aggregated from the monthly returns computed in CRSP. In the original period 1989-1998, returns to aggregate private equity and to an index of public equity appear to co-move closely. The returns to aggregate private equity are also not higher than returns to public equity. Consequently, with the extension of the period under consideration into 2000s the close co-movement of the returns weakens and private equity displays a substantial premium over public equity. Over this period, the public equity returns plunge to near zero values reflecting the poor performance of public equity markets, whereas returns to private equity remain largely unaffected. Line 2 of Table 3 reports annual returns to CRSP index. In the period from 1999 to 2001, two of the three returns are highly negative, driving the average net return close to zero. Relatively low returns from 2002 to 2004 are also aided by negative returns in 2002. As noted above the returns to public equity index are driven by unfavorable changes in the value of equity over this period. These are reported in line 1 of Table 3. The large negative capital gains appear to be only partly offset by the dividend distributions of publicly traded corporations. Together these lead to an overall poor performance of public equity and its unfavorable comparison with private equity. Alternative measures of public equity performance used for comparison include the CRSP S&P holding return, and Shiller’s S&P 500 index return as reported in lines 327 and 33 respectively. They deliver qualitatively similar comparison with private equity returns. I also use public equity returns from SCF reported in line 35 of Table 2, that are constructed in the same way as their private equity counterparts. At the household level, ”equity” variable from the SCF public extract is used for the value of household public equity holdings8 and the ”dividend income” variable from the full dataset - for the value of dividends distributed to the household.9 The aggregate values for public equity and the dividend distributions are computed by summing up the values for each household multiplied by the SCF non-response adjusted sample weights. As in the case of private equity, I report the geometric average of the two returns (R1 and R2) computed using two alternative values of aggregate dividend 6
The weights applied to the individual stock returns are given by the market value of the individual stock outstanding at the end of the previous trading period in the total value of the stock. 7 As well as in line 3 of Table 3. 8 As mentioned previously, the household public equity holdings include direct holdings of stocks, mutual funds, defined contribution retirement plans, trusts and annuities. 9 The question corresponding to this variable in SCF is: ”In total, what was your (family’s) annual income from dividends in ... (year), before deductions for taxes and anything else?”. The hint provided to respondents refers to the values reported on the IRS form 1040 line number 9a, which includes only the dividends of publicly traded companies.
6
income. The returns to public equity in SCF are somewhat higher than the returns obtained in CRSP, but display the same large negative premium relative to private equity returns.
2.3
SCF 2007 Returns to Private Equity
SCF 2007 does not appear to have captured the onset of economic slow-down in August 2007. The returns to all private equity and its components (PP and SC) for the period 2004-2007 compare rather favorably to previous periods. As with public equity returns, they can be mechanically accounted for by the behavior of equity values and profits. Table 1 reports a large increase in the total value of private equity from 2004 to 2007, largely due to an almost two-fold increase in the value of unincorporated equity. This category includes sole proprietorships, general partnerships, limited partnerships, and limited liability companies10 following the the Flow of Funds definition of non-corporate sector based on the type of tax return filed.11 Non-corporate profits experienced a similarly large increase contributing to the capital gain part of non-corporate equity returns. The rate of growth of corporate equity and corporate returns at the same time remained largely unchanged. Therefore, the total equity returns reported for 2005-2007 in Line 25 of Table 2 reflect the changes in the aggregate and corporate/noncorporate values and profits.12 To partially validate these results, the same Table 2 reports equity returns using data from FFA/NIPA with the average non-corporate return for 2005-2007 of 20%. The value of equity in non-corporate sector includes both market and non-market components computed as the sum of tangible assets (real estate at estimated market value, equipment, software, and inventories all at replacement/current), financial assets minus liabilities. It does not include the value of intangible assets, and therefore the FFA/NIPA P&P return may be an underestimate of the return computed in SCF. The FFA/NIPA report the aggregate statistics for the unincorporated sector as a whole, without the breakdown by business type, in particular for the LLP/LLC which weigh most heavily in the value of non-corporate equity in SCF, and thus account for the large part 10
The limited liability companies and limited liability partnerships are grouped together for the public dataset. The LLC business type combines the corporate characteristic of limited liability for all owners with the pass-through tax treatment of partnerships, and offers more organizational flexibility than S-corporations. 11 In particular, partnerships (general and limited) and limited liability companies file the IRS 1065 form, sole proprietorships file IRS schedule C or Schedule C-EZ. Non-corporate equity for the purposes of this paper excludes individual owned equity in rental residential properties, which is part of the FFA/NIPA definition. The owners of these properties file IRS schedule E. 12 The values of corporate and non-corporate equities relative to the value of total private equity serve as weights in the computation of the overall private equity return.
7
of its returns. Since the original source of data for unincorporated sector in FFA/NIPA is the individual tax returns filed with the Internal Revenue Service (IRS), some measure of investment returns can be alternatively constructed using IRS’s Statistics of Income (SOI). It reports aggregate net income, business receipts, and the balance sheet value of total assets of the LLP/LLC.13 Since total assets is the only balance sheet item available, I use returns on assets (rather than equity) constructed as the change in the value of total assets plus the net income normalized by the initial value of total assets.14 I then compare them with the equity returns from SCF. Table 4 reports returns on assets computed from the SOI for the time periods available for all partnerships and separately for the limited liability companies.
3
Historical Comparison of Private and Public Equity Returns
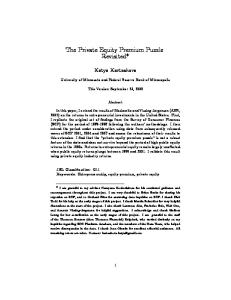
Table 9 and Figure 2 compare returns to unincorporated equity (PP) and returns to valueweighted CRSP market equity index over a longer time period from 1953 (1963) to 2007 than is available in SCF.15 Table 9 reports geometric and arithmetic average returns, as well as their standard deviations. In the table unincorporated equity returns from FFA has both a higher mean and a lower standard deviation. This higher volatility can be eye-balled in Figure 2 as well. Figures 3 and 4 compare FFA/NIPA non-corporate returns with the total equity and non-corporate equity returns from SCF over the period from 1989 to 2007 for which they are available. The two return series from SCF and FFA/NIPA unincorporated equity returns track each other closely suggesting that the latter could be used in place of 13
In particular, I use SOI publication of ”Partnership statistics by sector or industry” which covers all partnerships, incl. LLC which file the partnership return form 1065, for the years 1993-2006. I also look separately at the ”Limited Liability Company” statistics for 1999-2006, since the largest growth in the value of unincorporared equity over the period 2004-2007 has occurred for this particular type of business. 14 Given that statistics on net income come from tax returns, there is potentially a problem of tax income underreporting. To deal with this bias as in the case of unincorporated returns from FFA/NIPA, I adjust the SOI net income for misreporting using 1.75 ratio (this means that for each 1$ of net income reported to the IRS, the adjusted net income used in the computation is 1.75$). I also apply the labor income adjustment of 6.5%. FFA/NIPA value of total assets used in the computation of returns does not include any adjustment, and so the total value of assets reported on the tax returns will remain unadjusted as well. 15 Table 9 also reports returns for the 1953-1999 (1963-1999) period under consideration in MVJ. The replicated market equity returns from CRSP are the same as originally reported. However, due to regular revisions in FFA/NIPA (usually every quarter) it is absolutely impossible to obtain time series reported in MVJ either from the printed or electronic sources. This the FFA/NIPA returns differ somewhat. The COMPUSTAT data on publicly traded companies are also subject to revisions and corrections, unlike for example CRSP, which leads to similar departures from the originally reported returns.
8
SCF private equity returns in the long-term comparison with public equity returns from CRSP.
3.1
Mergers and Acquisitions
MVJ report their most accurate estimates of private equity returns with the mergers and acquisitions adjustment, which is an important channel for movements in and out of private equity in addition to firm births and deaths through liquidations and bankruptcies. Recomputed returns after M&A adjustment together with the originally reported are included in lines 25 and 26 of table 2. The data for M&A adjustment come from the SDC Platinum database of Thomson Reuters. It is a commercial use database which is regularly updated as additional information for past transactions becomes available, in particular, for missing deal values.16 MVJ report about 50% of transactions with missing deal values, and address this issue by using regression method to impute these values. For large part of these transactions the missing deal values were updated over the number of years. Thus the discrepancy in returns may reflect systematic upward or downward bias created by the imputation procedure. Comparison of returns from Table 2 reported for the same period likely points to the downward bias in MVJ procedure, as recomputed returns are higher than the original ones. Another source of discrepancy is associated with classification of transactions by sources of financing. For the purpose of M&A adjustment, the relevant division is into transactions financed with debt, including internal funds, and equity. While some transactions can be classified as debt or equity only, others are financed from both sources. The discrepancies in the numbers of transactions reported in Table 5 of MVJ and Table 8 suggest that for these mixed transactions all of the deal value may have been assigned to either debt or equity category and not split up accordingly. An additional source of discrepancies might be associated with pure input errors. For example, some of the acquirors/targets in SDC have been mistakenly coded as both private and public.17 That returns in lines 25 and 26 are substantially different can therefore be attributed to the increased coverage of transactions, reclassification, and other changes to the database. The returns reported in line 25 are significantly higher for all subperiods of 1989-1998, but in particular for 1995-1998. Mergers 16
The database contains a special variable which records the date when the transaction was updated last. Many transactions continue being updated many years after their effective date and the date of the original posting in the database. In particular, often updated fields include the total value of the deal, sources of financing (debt or equity or both) and their values. Thomson Reuters, which owns the database, collects its data from many different sources, including prospectuses, newspapers, experts, etc., so the information may become available in parts and find its way into database over time. 17 These discrepancies and inaccuracies were established with the help of Thomson’s Help Desk.
9
and acquisitions also produce an upward adjustment to the total private equity returns from 1999 to 2007 period and contribute positively to the premium of private over public equity over this period.
4
Private Equity Industry Returns
One way to validate results presented in Section 2.2 is to compare returns to a index of all entrepreneurial equity with private equity industry returns. The industry is largely composed of venture capital funds and buyout funds. Venture capital funds undertake investments in companies that have undeveloped or developing products. The different stages of venture financing refer to seed, start-up, expansion, and capital replacement. Buyout funds typically target mature companies and primarily finance changes of ownership in these companies. The bulk of the investments of the venture and buyout funds falls into the high-tech, consumer, communications and other service sectors.18 All of the results below are reported for the private equity industry as a whole, and for the venture capital and buyout funds separately.19 The private equity industry is organized primarily through partnerships, which involve multiple actors - limited partners (investors), general partners (managers), and entrepreneurs (scientists and executives). Thus it is important to specify whose returns are used in the comparison and why. The general partners and entrepreneurs in the partnership are the suppliers of human capital, who earn return on their human capital investment.20 The entrepreneurs provide the original idea and ”an intensive flow of new thinking and problemsolving as the company develops”21 , while the general partners perform a large range of services related to the management of the portfolio companies. The limited partners in turn are the investors, who supply all of the capital and earn financial returns. The average entrepreneur in SCF combines the functions performed by distinct parties in the venture and buyout partnerships as large share of total private equity is associated with 18
Thomson Financial reports show that in 1998 76% of all private equity industry investments were attracted by these sectors. For comparison, the share of these three sectors in private equity of US households reported in SCF constitutes a somewhat smaller but comparable number of 66%, so that there do not appear compositional biases in the results reported. 19 One possible reason for separating these two types of private equity funds is the different structure of financing, with buyout firms very highly leveraged, which may affect the computation of the IRR-based measure of private equity industry performance. Another reason is the differences in the valuation of portfolio investments in venture capital and buyout funds as described below. 20 Human capital here refers to the present discounted value of the labor input - time adjusted for effort of entrepreneur. 21 Hall and Woodward (2007) p. 16
10
businesses that (i) have been started and are being managed by entrepreneurs22 , and (ii) have high entrepreneurial ownership stakes resulting from their own equity investments.23 The raw returns reported in Table 2 therefore include both the return to financial investment of entrepreneurs and payment for hours spent working in (managing) the business. The adjustment in Lines 13-18 in Table 2 removes this labor component, so that the remaining part isolates the return to financial investment of entrepreneur.24 This return has been used in the comparison with public equity investment returns, and its private equity industry counterpart is the return of limited partners-investors (rather than entrepreneurs-scientists) in the private equity partnership.25 The venture capital and buyout funds represent a rather small but growing part of the total private equity. The level of activity in the industry is measured by total resources (commitments) raised from investors by general partners and disbursements (investments) from the funds to their portfolio companies. Table 5 summarizes aggregate statistics for the US private equity industry from Thomson Reuters’ VentureXpert database26 which had indeed experienced substantial growth over the period from 1989 to 2007. These statistics reflect traditional valuation practices adopted by the industry. Venture capital financing takes place in rounds, and investments are valued at the last round of financing.27 The values in non-venture or buyout funds are set at the purchase of portfolio companies and do not change subsequently until the fund exit. These investments represent cash outflows, 22
Rather than acquired, inherited, etc. These reflect the human capital investment of entrepreneur. This reflects financial investment of entrepreneur, as additional investments are accompanied with increases in the share of the company owned. 24 After additional adjustments for survivorship and other biases. 25 Hall and Woodward (2009) provide estimates of the rewards to both venture entrepreneurs and limited partners. They use data from Sand Hill Econometrics on the venture-supported investments which record their outcomes. This allows them to overcome the common problem of survivorship bias in other data sources on all entrepreneurial businesses, which leads to the estimation of the conditional distribution of their returns. Hall and Woodward (2009) estimate the unconditional distribution of human capital returns of entrepreneurs in their venture-backed start-ups. Unlike Hall and Woodward (2009), MVJ and this paper deal with entrepreneurial investments more broadly and by using the index they are able to overcome this survivorship bias as well. However, unlike Hall and Woodward (2009) this approach allows them to estimate only the mean of the unconditional distribution of returns without being able to characterize it further. This would require data on exiting as well as surviving entrepreneurial businesses. The index of equity can be viewed as the diversified portfolio of investments held by a single entrepreneur, and together with the public equity index it is subject only to the aggregate systemic risk. 26 As reported by Thomson Reuters, these data are collected from quarterly surveys of private equity firms, government filings, public news releases, etc. And Kaplan, Steven N., and Antoinette Schoar (2005) provide an estimate from VentureXpert that 70% of the overall private equity market is covered by the database. 27 Hall et al. (2008) discuss endogeneity of these financing events, and propose the correction to returns of investors that would take this endogeneity into account. They propose to use linear interpolation to impute values in between rounds of financing over the regular valuation intervals. 23
11
and receipts from companies’ exits - cash inflows, which enter the computation of returns in private equity industry. The standard measure of the industry’s performance has been the pooled internal rate of return28 of the limited partners (investors) produced by the VentureXpert of Thomson Reuters.29 This return is net of the management fees and the carry interest of the general partners as well as cash payments to entrepreneurs according to their share of company’s ownership.30 In its construction all funds are pooled together to form a single ”fund”, similar to the index of all private equity in MVJ.31 More specifically, the IRR is calculated as an annualized effective compounded rate of return using cash flows to and from investors together with the residual value of the fund which is treated as a terminal cash flow to investors. This residual value is net of the current liabilities, and includes cash, shortterm investments, long-term equity investments, outstanding loans, and other assets.32 For the purpose of comparison with returns to entrepreneurial equity in SCF and public equity returns, Line 3 in Table 5 reports average pooled IRR for the 3-year intervals. An alternative measure of returns is included in line 4 of Table 5. It is the average one-year performance horizon IRR. The return in each period uses the fund’s net asset value (i.e. the value of the 28
Internal rate of return is defined as return at which net present value of investment becomes 0. In particular, the returns from VentureXpert have been used by Kaplan, Steven N., and Antoinette Schoar (2005) as the aggregate measures of private equity industry performance in the 1980s and 1990s. Hall and Woodward (2007) do not use venture index returns produced by VentureXpert, but compute their own measures from alternative data sources and compare them with VentureXpert. Their data are from Sandhill Econometrics. The unit of observation in these data is a venture-supported investment (companyround) rather than venture fund in VentureXpert database. Hall and Woodward (2009) compute venture index returns using two methods. First, they construct returns using company-level flows and the share of ownership of the limited investors adjusting for preferences, dilution and GP charges. Second, they calculate returns using the net amounts directly received by limited partners. They find that the two measures move ”reasonable close” with each other, and with the VentureXpert reported returns. The findings in Hall and Woodward (2007) and previous studies justify using readily available index returns from VentureXpert. I will use the return to an index of all private equity, incl. both venture and buyout funds, and for the two types of private equity separately. 30 The management fees of the general partners are paid annually for the duration of the life of the fund as a fixed percent of the commitments or investments under their management still in the fund. So they may be inversely related to the performance of the fund - with poor performance portfolio companies may require longer to exit, and as long as they remain in the fund, the partners would receive their management fee. The carry interest constitutes a fixed percent (usually about 20%) of the difference between the initial investment of the limited partners and the exit value of the investment (i.e. the net cash flow generated by the investment). The carry interest constitutes the performance-based part of the general partner’s compensation and accrues on the fund as a whole rather than on successful exits. 31 Recall, its construction involves the total values of privately held equity and net income. 32 The advantage of this measure is that it does take the scale and timing of cash flows of large and small scale funds into consideration. The disadvantage is that larger cash flows will be given more weight given by the value of the investment, so that in a composite portfolio of small early stage funds and large later stage or buyouts funds the larger funds will have more influence on the performance than the smaller funds. 29
12
fund’s investments) at the beginning of the horizon period as an initial cash outflow, residual value at the end of the period as the terminal cash flow, and the value of any cash flows from and to investors during the horizon period. These returns are then averaged over the three-year intervals. The two IRR returns thus largely differ in how much of the underlying values are actual values obtained at exit vs. book values on the fudns’ balance sheets. In the case of venture capital funds, investments are revalued at new financing rounds when the price per share and ownership of shares are negotiated between the entrepreneurs and venture partners. Then the performance horizon return which relies on these balance sheet values of the portfolio companies, likely underestimates the actual returns of the investors. Thus I use pooled IRR as the benchmark return for comparison. The two series of returns to private equity reported in lines 23 of Table 2 and line 3 of Table 5 follow each other closely. I also report on what can be thought of as the SCF counterpart of private equity industry returns. The limited partners of the venture partnerships are the owners of their portfolio companies but do not have a say in either their management or day-to-day operations. The SCF assigns these limited partners in the category of owners of non-actively managed businesses, i.e. owners who do not have an active management role in their businesses. It also includes angel investors, and other wealthy individuals with equity in non-publicly traded companies, but no active management role. In the absence of active management role the returns to passive owners constitute pure financial investment returns. These returns are computed from the values of the non-actively managed equity and associated profits using the formula in Section 2.2. While the labor income adjustment does not apply to these returns, several other adjustments are not possible due to less detailed coverage in SCF of this equity category.33 Consequently, the final returns are net of the tax and retained earnings adjustments only. Lines 27 and 28 of Table 2 report returns to passive investors with and without any other active investments respectively.34 Different measures of private equity industry returns reported in Table 5 therefore appear to support the earlier conclusion that the private equity premium puzzle is not a robust feature of the data and does not survive beyond the period of high public equity returns in the 1990s. As a last consideration, the Capital Asset Pricing Model provides a natural framework for the analysis of incentives to invest of an average entrepreneur choosing between fully diversi33
As before, non-actively managed businesses include both corporate and non-corporate ones, with respondents self-reporting the values of their equity holdings. 34 I.e. some of these passive investors also report owner’s interest in the businesses where they do have an active management rile. The returns to an index of all private equity previously reported in Section 2.2 include both actively and non-actively managed equity.
13
fied portfolios of public and private equity given by the CRSP and SCF indices respectively. However, data limitations make the formal analysis in this framework quite difficult, as the SCF is conducted only every three years and the sample of private equity returns is very short. Hall and Woodward (2007) focus on venture capital, which constitutes a fraction of the total entrepreneurial equity, and apply CAPM to the times series from 1989 to 2005 of monthly venture index and public equity index returns. The construction of monthly returns creates investment performance measures for the venture index at regular fixed intervals, thus eliminating the problem of using CAPM with endogenous holding period returns directly available in the data.35 . CAPM regressions in Hall and Woodward (2007) deliver a positive estimate of alpha which measures the excess return of investments into venture index over public equity index over the years taken together. This result for venture equity which represents a fraction of the total entrepreneurial equity may provide some support for the main finding in this paper as well.
5
Robustness Checks: Alternative Assumptions
In this section, I describe an alternative set of assumptions for the computation of returns compared to that originally proposed by MVJ. Retained earnings adjustment. The purpose of the retained earnings adjustment is to exclude from computation of returns any part of net income retained in the business. As passthrough entities, partnerships, proprietorships and S corporations do not have undistributed income. The total owners’ equity in these businesses can be increased only through new equity investment. Thus, the application of the retained earnings adjustment in MVJ for partnerships, proprietorships, and S corporations is unnecessary and leads to a downward bias in returns. It is possible, however, for the part of the distributed net income of an S-corporation to be reinvested in it later. The reinvested amount of net income would be added to equity and would be taken into account when computing equity returns for the corresponding period. This is similar to the way returns to venture capital investments are computed. Venture capital financing is carried out in rounds, and so new investments are added to the equity holdings of venture and would be reflected in equity returns for the period investment is undertaken. The final returns without the retained earning adjustment 35
Hall and Woodward (2007) use interpolation technique to obtain values of the venture investments between the periods for which actual valuations are available. The returns are constructed as a proportional change in the value of venture positions over the month, which is analogous to the standard stock-market index returns.
14
for the non-corporate sector are reported in line 3 of Table 10. Labor income adjustment. The purpose of the labor income adjustment is to separate the investment returns of entrepreneurs from returns to their human capital. To do that, MVJ assume that (i) net income of the business is distributed pro rata the ownership share; (ii) reported wages represent a fair remuneration for the services performed;36 (iii) there is no double counting of the reported wages in the net income. Assumption (i) is very restrictive; however, one cannot do better due to data limitations in the SCF.37 It can lead to both upward and downward biases in returns, and the net effect cannot be readily determined. The alternative versions of assumptions (ii) and (iii) in the data can be formulated as follows. When asking about the net income of the business, the SCF questionnaire specifically refers to IRS tax returns filed by individual business owners. Given that owners of unincorporated businesses cannot pay themselves salary, the net income reported on these forms would also include any amounts that might be due as labor compensation. Thus for the entrepreneurs who do report wages in the employment section of SCF, the amount of net income reported would not necessarily be exclusive of wages. Thus in the labor adjustment for unincorporated businesses it may be necessary to take out both paid and unpaid wages of entrepreneurs reported for PP in Table 1. This would in turn lower the returns to unincorporated equity. To deal with a potential problem of underreporting in (ii), wages of all owners of unincorporated equity and owners of S corporations may need to be imputed using the regression approach. The results for this adjustment alone are reported in line 6 of Table 10. Labor income adjustment: imputation regression. In the regression model used to impute unreported wages, only observed demographic characteristics were included as regressors. In the estimation, the decision to become self-employed was treated as exogenous. The same regression model instead can be estimated on the sample of active business owners, who report paid employment outside of their business as their main occupation. This may give a more accurate prediction of the opportunity cost of self-employment. The final returns obtained with the alternative samples for imputation regressions are presented in lines 4 and 5 of Table 10. The results for the joint labor income (imputation regression and non-corporate sector labor income) and retained earnings adjustments are presented in lines 7-9 of Table 10. 36
In the case of the owners who provide services in their businesses organized as S corporations, for example, the law requires them to be paid fair market wages. So it is assumed that the wages reported represent the market value of the services provided and need not be adjusted. 37 E.g. in the partnership, the ownership shares and distribution shares do not have to coincide.
15
6
Conclusions
In this paper, I have constructed an extended series of returns to the private equity index for the period 1989-2007 using the original methodology of Moskowitz and Vissing-Jørgensen. I find that the ”private equity premium puzzle” is not a robust feature of the data and does not survive beyond the period of high public equity returns in the 1990s. In particular, the returns to entrepreneurial equity index remain largely unaffected when public equity returns plunge between 1999 and 2001. This result is validated using different measures of the private equity industry returns and against other studies in the literature. These findings suggest that private equity as an asset class might serve as a hedge against public equity.
References Antoniewicz, R. L. (2000): “A Comparison of the Household Sector from the Flow of Funds Accounts and the Survey of Consumer Financess,” Working Paper 96-26, Board of Governors of the Federal Reserve System. Hall, R. E., and S. E. Woodward (2007): “The Incentives to Start New Companies: Evidence from Venture Capital,” Working papers, Hoover Institution, Stanford University. (2009): “The Burden of the Nondiversifiable Risk of Entrepreneurship,” American Economic Review, 99(6). Kaplan, Steven N., and Antoinette Schoar (2005): “Private Equity Performance: Returns, Persistence, and Capital Flows,” Journal of Finance, 60, 1791–1823. Moskowitz, T. J., and A. Vissing-Jørgensen (2002): “The Returns to Entrepreneurial Investment: A Private Equity Premium Puzzle?,” American Economic Review, 92, 745– 778.
16
Table 1: The Size of Private and Public Equity (1989-2007), $ bln. Survey year
1989
1992
1995
1998
2001
2004
2007
3, 680 (525) 2, 020 (397) 1, 660 (242)
3, 740 (298) 1, 980 (143) 1, 770 (223)
4, 290 (277) 1, 990 (174) 2, 300 (241)
5, 710 (427) 2, 510 (208) 3, 200 (348)
7, 830 (484) 3, 570 (272) 4, 260 (358)
9, 650 (521) 4, 310 (299) 5, 350 (411)
14, 700 (859) 8, 260 (626) 6, 460 (560)
1, 770 1, 770
2, 230 2, 230
3, 640 3, 640
7, 430 7, 430
11, 400 8, 010
10, 800 10, 800
13, 700 13, 700
2.08
1.67
1.18
0.77
0.98
0.89
1.08
335 266 268 175
433 287 347 194
460 341 368 246
543 489 434 351
787 677 629 479
842 696 673 530
1, 480 863 1, 180 641
141 152 27
191 148 36
246 181 24
292 172 53
331 214 54
336 245 56
419 334 53
Equity in noncorporate business 2, 966 Minus Value of 1-4 family rental 916 properties Equals Proprietors and partnerships 2, 050 (market value)
2, 980 982
3, 487 1, 109
4, 121 1, 235
4, 821 1, 441
6, 359 1, 756
8, 347 1, 991
1, 998
2, 377
2, 886
3, 380
4, 602
6, 356
S and C corporations (market value) 1, 412 (estate multiplier=2) [4]
1, 622
1, 921
2, 540
2, 098
2, 535
-
S and C corporations (market value) 2, 117 (estate multiplier=3)
2, 433
2, 887
3, 811
3, 147
3, 803
-
Statistics from SCF Private Equity Values
Total equity [1] Equity in PP Equity in SC Public Equity Values
Original series Revised series[2] Equities ratio Profits
Pretax profits PP After tax profits SC Profits - RE PP [3] After tax profits - RE SC Labor income
Total paid wages Unpaid wages PP Unpaid wages SC FFA/NIPA Private Equity Values
17
Table 1: The Size of Private and Public Equity (1989-2007), $ bln. (continued) Survey year
1989
1992
1995
1998
2001
2004
2007
363.3 187.7
427.6 216.3
492.1 283.3
627.8 514.6
771.9 514.7
911.6 557.3
1056.2 678.1
Adjusted proprietors’ income-RE Dividends, S and C private 165.2 corporations [6]
177.2
249.0
387.6
406.4
466.0
−
Dividend income, public corp. 66.4
69.2
100
98.3
108
107
148
4, 396 (4, 376) 3, 078
6, 785 (6, 734) 4, 750
13, 288 (13, 217) 9, 301
13, 829
16, 458
19, 851
9, 681
11, 521
13, 896
1992
1995
1998
2001
2004
2007
284.4
441.6
846.2
1, 162
1, 061
1, 941
FFA/NIPA Income and dividends
Proprietors’ income [5]
Statistics from CRSP
Public equity in CRSP [7,8]
3, 306 (3, 292) 2, 314
Public equity in CRSP x 0.7 [9]
SDC M&A equity adjustment [10] Note 1: For private equity statistics, included in parentheses are standard errors. Note 2: This revision as described in the text. Note 3: RE refers to retained earnings adjustment. Note 4: The market values for CRSP are obtained from WRDS version of CRSP from Monthly Stock Market Indices database and correspond to the variable ”Total Market Value”. It reports monthly total market value for a given market for all non-ADR securities with valid prices. The values reported are those for the end of calendar year. Note 5: Numbers reported here refer to the value of closely held equity at date of death, and the year refers to the year of death of decedents. MVJ originally reported numbers from tax returns for the year of filing. Given that the majority of returns are filed a year after the decedent’s death, appropriate adjustment for the year must be made. Note 6: Proprietors’ income as reported in NIPA with the inventory valuation (IVA) and capital consumption adjustment (CCAdj). Note 7: Dividend distributions of publicly traded corporations include include only distributions carried out from the current net income and do not include liquidating and other distributions. Note 8: The values in brackets are those originally reported in MVJ. Note 9: CRSP value multiplied by 0.7 corresponds to the total value of public equity held by households, as they are reported to own about 70% of total publicly traded equity. Note 10: M&A adjustment is reported as the aggregate values for periods 1990-92, 1993-95, 1996-98, 1999-2001, 2002-04, 2005-07.
18
Table 2: The Returns to Private Equity (1989-2007) 90 − 92
93 − 95
96 − 98
99 − 01
02 − 04
05 − 07
Line
17.4 15.7 19.5
21.9 19.0 25.0
26.4 26.3 26.5
27.7 30.3 25.5
22.7 23.7 21.8
29.0 39.5 19.1
1 2 3
15.8 15.7 16.0
20.7 19.0 22.5
25.4 26.3 24.5
26.5 30.3 23.38
21.8 23.7 20.2
28.5 39.5 18.1
4 5 6
12.3 (12.3) 12.8 (12.6) 11.7 (12.0)
17.2 (17.0) 15.7 (15.6) 18.7 (18.5)
22.1 (22.2) 23.1 (23.0) 21.1 (21.4)
23.1
18.9
25.8
27.1
20.6
36.7
19.8
17.2
15.4
7 8 9 10 11 12
8.2 (8.2) 6.5 (6.4) 10.2 (10.9)
13.3 (12.7) 9.2 (9.4) 17.5 (16.9)
18.6 (18.4) 16.9 (15.9) 20.0 (20.6)
20.2
16.2
23.5
22.1
16.0
33.0
18.6
16.3
14.6
7.0 (7.5) 5.3 9.2
11.8 (11.6) 7.5 16.3
16.1 (16.4) 13.8 18.0
18.2
14.5
17.4
20.4 16.4
13.9 15.0
26.3 9.0
7.4 (7.8)
12.3 (12.1)
16.7 (17.0)
18.8
14.7
17.6
Total Private equity in SCF Unadjusted returns All
PP SC Income taxes All
PP SC Retained earnings All
PP SC Labor income All
PP SC Firm birth All
PP SC IPO [1] All
19
13 14 15 16 17 18 19 20 21 22 23 24
Table 2: The Returns to Private Equity (1989-2007) (continued) 90 − 92
93 − 95
96 − 98
99 − 01
02 − 04
05 − 07
Line
9.6 (8.2)
15.4 (13.0)
21.4 (19.4)
23.5
18.0
22.3
25 26
37.5 36.0
10.5 21.7
26.8 40.2
15.1 13.3
15.4 5.54
22.7 36.8
27 28
5.4
13.2
17.3
16.9
19.6
19.5
29
11.0
14.5
24.5
−0.4
6.0
10.2
30
(11.0) 7.2
(14.6) 11.2
(24.7) 25.9
−2.3
1.8
6.6
31 32
7.9
12.1
26.1
−4.2
0.1
11.2 11.2
20.4 20.4
28.5 28.5
16.4 3.8
−0.8 11.5
Total Private equity in SCF M&A All
Non-actively managed private equity in SCF [2] All owners Non-active owners
Private equity FFA/NIPA
in
PP
Public equity in CRSP CRSP value-wgtd index updated [3]
CRSP S&P index holding return
33
S&P index, Shiller [4]
Public equity in SCF Index Index, revised
9.2 9.2
Note 1: For the IPO adjustment I use values for the aggregate proceeds of IPOs by year reported by Jay Ritter at the following link: http://bear.cba.ufl.edu/ritter/Moneybyyear.pdf Note 2: ”All owners” refers to entrepreneurs with and without other actively managed closely held businesses; ”Non-active owners” refers to entrepreneurs who do not have interest in businesses where they have an active management role. Note 3: For the CRSP value-weighted index returns in brackets are those originally reported in MVJ. Note 4: S&P index return for the period 2004-2007 is unavailable on the Shiller’s web-site and is left blank.
20
34 35
Table 3: Public Equity Market Values and Returns (1998-2007) Year CRSP market value, bln.
$
CRSP index return, % CRSP S&P return, %
Year CRSP market value, bln.
$
CRSP index return, % CRSP S&P return, %
1998
1999
2000
2001
2002
Line
13, 288 22.3 26.7
17, 009 25.3 19.5
13, 829 −11.1 −10.1
11, 034 −11.3 −13.0
14, 585 −20.8 −23.4
1 2 3
2003
2004
2005
2006
2007
Line
16, 458 33.1 26.4
17, 384 13.0 9.0
19, 548 7.3 3.0
19, 851 16.2 13.6
11, 697 7.3 3.5
1 2 3
Table 4: Unincorporated Asset Returns from Statistics of Income (All Partnerships and Limited Liability Companies)
Year
1996 − 98
PP returns, % Unadjusted returns 28.5 Tax misreporting and labor income 31.6 adjustment LLC returns, % Unadjusted returns Tax misreporting and labor income adjustment
21
1999 − 01
2002 − 04
2005 − 07
Line
22.4 25.2
14.8 17.0
26.3 29.4
1 2
27.5 29.1
27.9 30.4
3 4
Table 5: Private Equity Industry Characteristics and Returns, 1989-2007 90 − 92
93 − 95
96 − 98
99 − 01
Aggregates, mln. $ Total resources 61, 841 13, 461 Total investments
137, 174 22, 789
362, 162 67, 812
802, 647 446, 440 1, 390, 315 287, 907 120, 923 165, 859
13.57 9.3
14.90 23.6
16.67 25.4
18.03 14.7
14.2 6.9
14.1 13.0
3 4
9.76
12.03
14.93
19.23
16.43
15.90
5
21.32
19.63
19.80
17.25
12.50
13.27
6
Year
02 − 04
05 − 07
Line
1 2
Returns, % All Private Equity
Pooled IRR 1-yr hrz IRR Venture Capital
Pooled IRR Buyout Funds
Pooled IRR
22
Table 6: Private Equity (PE) and Own-Company Stock Ownership Measure
1995
2004
2007
93.3 77.1 50.6
92.4 73.7 41.9
93.5 79.0 51.4
36.9 45.7
37.5 41.4
37.6 46.0
82.5 73.9
85.4 73.8
85.3 72.2
11.0 6.5 3.1
9.9 4.6 1.2
12.6 6.7 2.7
11.1 10.4
9.0 8.3
8.9 11.4
70.1 48.4
69.7 47.0
73.3 57.4
Private Equity (PE) Ownership % of total PE owned by households with:
more than 25% of net worth in PE more than 50% of net worth in PE more than 75% of net worth in PE Mean % of net worth invested in PE for households with positive private equity and net worth:
SCF weights only net worth weights Mean % of PE held in one actively managed firm for households with positive PE:
SCF weights only private equity weights Own Company Stock Ownership in Public Firms % of total public equity owned by households with:
more than 25% of public equity in own company more than 50% of public equity in own company more than 75% of public equity in own company Mean % of net worth invested in own-company stock for households with positive own-company stock and net worth:
SCF weights only net worth weights Mean % of directly held public equity in own-company stock for households with positive own-company stock:
SCF weights only directly held public equity weights
23
Table 6: Private Equity (PE) and Own-Company Stock Ownership (continued) Measure
1995
2004
2007
44.2 29.4
32.2 20.9
35.3 29.1
Own Company Stock Ownership in Public Firms Mean % of total public equity held in own-company stock for households with positive own-company stock:
SCF weights only total public equity held weights
Note: This table is an analogue of Table 2 in MVJ (p. 751). For comparison purposes, I only report the statistics for years 1995 (included in MVJ), 2004 and 2007.
Table 7: Summary Statistics on Entrepreneurs from the Survey of Consumer Finances Section A Characteristic
Percentile Mean
Std. dev.
10th
25th
Median
75th
90th
46.5
12.6
31
37
45
54
65
11.9 289, 256
11.6 1, 664, 984
2 0
4 5, 000
8 30, 000
16 129, 000
26 481, 000
6, 994, 702 94, 173 774, 471 86.45
217, 000, 000 1, 646, 680 3, 365, 676 26.42
0 0 32, 000 100
4, 200 520 80, 600 100
30, 000 6, 500 182, 000 100
130, 000 29, 000 489, 550 100
700, 000 80, 000 1, 377, 660 100
12.1
123.8
1
1
2
4
12
49.4
11.9
34
41
49
58
65
12.7 751, 893
10.6 4, 592, 438
2 0
4 11, 000
10 80, 000
18 350, 000
28 1, 200, 000
6, 521, 583 147, 231 2, 066, 981 82.9
101, 000, 000 994, 537 8, 291, 575 29.2
1, 200 0 64, 030 33
15, 000 3, 000 178, 300 50
70, 000 20, 000 515, 820 100
373, 000 75, 000 1, 519, 000 100
1, 500, 000 200, 000 4, 647, 790 100
28.5
272.9
1
1
2
6
15
SCF 1995
Entrepreneur age Firm age Market equity Sales Profits Net worth Share owned, % Employees [1] SCF 2007
Entrepreneur age Firm age Market equity Sales Profits Net worth Share owned, % Employees [1]
24
Table 7: Summary Statistics on Entrepreneurs from the Survey of Consumer Finances (continued)
Section B SCF 2007
% PE 10.2 17.5 6.5 13.7 14.7 37.4
Industry
Agriculture [2] Construction/mining [3] Manufacturing [4] Retail, wholesale [5] FIRE/communications [6] Services [7]
Note 1: The numbers reported include entrepreneur working in the business. Note 2: Agriculture, forestry, fishing, hunting, veterinary and landscaping services; Note 3: Oil and gas extraction, coal mining, quarrying, supporting services for mining, and construction; Note 4: Manufacturing, newspaper and other publishing, independent artists, spectator sports; Note 5: Wholesale and retail trade, restaurants and food service; Note 6: Finance and insurance, real estate, automotive rental and leasing, software publishing, data processing, hosting and related, automotive repair and maintenance; Note 7: Commercial, industrial and other intangible assets rental and leasing; employment and business support services; broadcasting and telecommunications; other administrative and support services; health, education and social services; arts, and entertainment services; recreation, accommodation and food services; personal services, etc.
25
Table 8: Merger and Acquisition Activity in Private and Public Firms (1989-2007), $ bln. Survey year Acquiror: Target:
1990 − 1992 Pub Priv Priv Priv Priv Pub
1993 − 1995 Pub Priv Priv Priv Priv Pub
All acquirors, all targets Value Number of deals
220.6 4, 715
363.8 7, 746
All acquirors, domestic targets Value Number of deals
94.3 2, 209
Domestic acquirors, domestic targets debt or cash funded Value Number of deals
192.9 3, 701
69.7 528
84.4 626
247.2 4, 911
201.4 4, 313
1996 − 1998 Pub Priv Priv Priv Priv Pub
756.5 11, 794
219.9 1, 026
424.9 6, 417
69.9 1, 208
101.9 1, 615
157.1 2, 107
Foreign acquirors, domestic targets Value Number of deals
13 143
9.3 95
16 167
Domestic acquirors, foreign targets equity funded Value Number of deals
0.7 5
0.6 12
2.1 14
Domestic acquirors, all targets equity funded Value Number of deals Total change
2.7 21
6.9 12
284.5
441.7
26
446.1 7, 093
24.8 37 846.2
Table 8: Merger and Acquisition Activity in Private and Public Firms (1989-2007), $ bln. (continued)
Survey year Acquiror: Target:
1990 − 1992 Pub Priv Priv Priv Priv Pub
All acquirors, all targets Value Number of deals
1, 126 11, 588
All acquirors, domestic targets Value Number of deals
534.1 4, 670
Domestic acquirors, domestic targets debt or internally funded Value Number of deals
400.9 1, 590
635.4 8, 133
1993 − 1995 Pub Priv Priv Priv Priv Pub
723.6 9, 025
287.3 1, 253
470 7, 592
330.1 3, 056
1996 − 1998 Pub Priv Priv Priv Priv Pub
1, 241 12, 765
1, 327 1, 606
497.4 3, 866
181 1, 966
230.8 1, 959
457.7 2, 308
Foreign acquirors, domestic targets Value Number of deals
22.4 222
18.7 150
82.2 265
Domestic acquirors, foreign targets equity funded Value Number of deals
0.4 19
2.8 11
2 8
Domestic acquirors, all targets equity funded Value Number of deals Total change
7.9 33
9.3 14
1, 162
1, 061
27
1, 488 9, 670
45.1 10 1, 941
Table 9: The Returns to Private Equity (1953-2007) Arithm. Std. average dev.
Annualized Returns
A. Private Equity Returns (from the FFA/NIPA) Proprietors and partnerships, equity returns: 14.6 1953-1999 Proprietors and partnerships, equity returns: 14.8 1963-1999 Proprietors and partnerships, equity returns: 15.2 1953-2007 Proprietors and partnerships, equity returns: 15.5 1963-2007 B. Public Equity Returns Value-weighted index, CRSP market equity returns:14.0 1953-1999 Value-weighted index, CRSP market equity returns:13.7 1963-1999 Value-weighted index, CRSP market equity returns:12.6 1953-2007 Value-weighted index, CRSP market equity returns:12.0 1963-2007 Value-weighted index, Compustat book returns [1]: 16.1 1964-2007 Value-weighted index, Compustat book returns: 17.0 1964-1999
Geom. average
Line
6.0
14.4
1
6.4
14.6
2
6.2
15.0
3
6.7
15.3
4
17.0
12.7
5
16.0
12.5
6
17.0
11.2
7
16.0
10.8
8
8.0
15.8
9
7.3
16.8
10
Note 1: As in MVJ the book equity construction follows Fama and French, which define it as the book of value of stock holders’ equity, plus balance sheet deferred taxes and investment tax credit, minus the book value of preferred stock. In the reported results preferred stock is at its redemption value. The dividend distributions are those paid to common equity holders. The results for preferred stock using liquidation and par values differ only in decimals, and so are not reported here.
28
1963 1964 1965 1966 1967 1968 1969 1970 1971 1972 1973 1974 1975 1976 1977 1978 1979 1980 1981 1982 1983 1984 1985 1986 1987 1988 1989 1990 1991 1992 1993 1994 1995 1996 1997 1998 1999 2000 2001 2002 2003 2004 2005 2006 2007
Annuall Return
Figure 2: The Returns to Private and Public Equity (1963-2007)
1.40
1.30
1.20
1.10
1.00
0.90
0.80
0.70
0.60
FFA P&P return Public equity market returns (CRSP)
29
Figure 3: The Average Annualized Returns to All Private and Public Equity (1963-2007) The Returns to Private and Public Equity (1963‐2007) 30.00
25.00
20.00
15.00
10 00 10.00
5.00
0.00 63‐65
66‐68
69‐71
72‐74
75‐77
78‐80
81‐83
84‐86
87‐89
90‐92
93‐95
96‐98
99‐01
‐5.00
‐10.00
‐15.00 Average FFA non‐corporate return
Average CRSP return
30
SCF aggregate entrepreneurial returns
02‐04
05‐07
Figure 4: The Average Annualized Returns to Unincorporate Private and Public Equity (1963-2007) 30.00
25.00
20.00
15.00
10.00
5.00
0.00 63‐65
66‐68
69‐71
72‐74
75‐77
78‐80
81‐83
84‐86
87‐89
90‐92
93‐95
96‐98
99‐01
‐5.00
‐10.00
‐15.00 Average FFA non‐corporate return
Average CRSP return
31
SCF unincorporated equity returns
02‐04
05‐07
Table 10: Robustness Checks for the Private Equity Returns (1989-2007) 90 − 92
93 − 95
96 − 98
99 − 01
02 − 04
05 − 07
Line
9.6 (8.2)
15.4 (13.0)
21.4 (19.4)
23.5
18.0
22.3
1 2
10.4
16.3
22.1
24.1
18.8
22.9
3
All, Regression 1 [2] All, Regression 2 [3]
8.6 8.3
14.5 14.4
20.3 20.5
22.5 22.7
17.4 17.3
21.7 21.6
4 5
Non-corporate Labor Income All [4]
8.7
14.5
20.4
22.6
17.5
21.7
6
9.5 9.1
15.4 15.4
21.1 21.3
23.2 23.4
18.1 18.0
22.3 22.3
7 8
9.6
15.5
21.2
23.3
18.2
22.4
9
Total Private equity in SCF MVJ Assumptions All Alternative Assumptions Retained Earnings All [1] Labor Income
Imputation Regression
Labor Income & RE
Imputation Regression All, Regression 1 All, Regression 2
Non-corporate Labor Income All
Note 1: This calculation eliminates the 20% retained earnings adjustment for the noncorporate sector. Note 2: The imputation regression here uses the sample of respondents who own a business and have an active management role in this business, report being self-employed and receive positive wages. Note 3: The imputation regression here uses the sample of entrepreneurs with active management role in their business who at the same time report working for some-one else and receive positive wages associated with this employment. Note 4: This calculation subtracts from the non-corporate sector net income the total of paid and imputed unpaid wages.
32