The Private Equity Premium Puzzle Revisited* Katya Kartashova University of Minnesota and Federal Reserve Bank of Minneapolis This Version: September 23, 2009
Abstract In this paper, I extend the results of Moskowitz and Vissing-Jørgensen (AER, 2002) on the returns to entrepreneurial investments in the United States. First, I replicate the original set of …ndings from the Survey of Consumer Finances (SCF) for the period of 1989-1998 following the authors’methodology. I then extend the period under consideration using data from subsequently released waves of SCF 2001, 2004 and 2007 and assess the robustness of their results to this extension. I …nd that the "private equity premium puzzle" is not a robust feature of the data and does not survive beyond the period of high public equity returns in the 1990s. Returns to entrepreneurial equity remain largely una¤ected when public equity returns plunge between 1999 and 2001. I validate this result using private equity industry returns.
JEL Classi…cation: G11 Keywords: Entrepreneurship, equity premium, private equity
* I am grateful to my advisor Narayana Kocherlakota for his continued guidance and encouragement throughout this project. I am very thankful to Brian Bucks for sharing his expertise on SCF, and to Gerhard Fries for answering data inquiries on SCF. I thank Dick Todd for his help at the early stages of this project. I thank Martin Schneider for very helpful discussions at the start of the project. I also thank Laurence Ales, Frederico Belo, Nick Guo, and Annette Vissing-Jørgensen for helpful suggestions. I acknowledge and thank Mallory Leung for her contribution at the early stages of this project. I am grateful to the sta¤ of the Thomson Reuters (then Thomson Financial) Helpdesk, who worked tirelessly on my inquiries regarding SDC Platinum database, and the members of the Data Team, who helped resolve discrepancies in the data. I thank Joan Gieseke for excellent editorial assistance. All remaining errors are mine. Contact:
[email protected]
1
1
Introduction
In this paper, I extend the results of Moskowitz and Vissing-Jørgensen (2002) (henceforth MVJ) on the returns to entrepreneurial investments in the United States. First, I replicate the original set of …ndings in Moskowitz and VissingJørgensen (2002) using the authors’methodology and data from the four Surveys of Consumer Finances available for the period from 1989 to 1998. I then incorporate into analysis subsequently released waves of SCF 2001, 2004 and 2007 and assess the robustness of the …ndings to this extension. I focus on the results regarding the composition of entrepreneurial portfolios and relative returns to private equity. In the period following the 1990s, I …nd an equally high concentration and poor diversi…cation in entrepreneurial portfolios documented in MVJ.1 When comparing returns to the indices of entrepreneurial and publicly traded equity (given by both CRSP market index and S&P 500 index return) over the same time period, I also …nd that entrepreneurial equity signi…cantly outperformed public equity. In particular, in 1999-2001 the average annualized public equity returns fell dramatically to near zero values re‡ecting the poor performance of public equity markets, while returns to entrepreneurial equity remained largely una¤ected. Public equity returns also remained substantially below their private equity counterparts in the period from 2002 to 2004. This is in sharp contrast to the original …nding of Moskowitz and VissingJørgensen (2002) that over the period from 1989 to 1998 private equity returns were no higher than returns to public equity. From an accounting perspective, the large negative capital gains in the value of equity of publicly traded companies - only partly o¤set by their dividend distributions - largely explain the poor performance of public equity and its unfavorable comparison to private equity, whose values of equity and pro…ts have both increased at the same time. To validate the results, I provide alternative measures of private equity returns in the data - in particular, the private equity industry returns and the returns to non-actively managed equity in SCF - and relate them to the …ndings of similar studies in the literature. The result that "over the period of 1990s the private equity returns were not higher than public equity returns" originally established by Moskowitz and Vissing-Jørgensen (2002) has been termed the "private equity premium puzzle." Using additional data, this paper argues that the "puzzle" is not a robust feature of the data and does not survive beyond the 1990s, a period of extraordinarily high public equity returns. The paper is organized as follows. Sections 2.1 and 2.2 report the extended series for the returns to public and private equity and the underlying aggregate statistics used in their construction for the period from 1989 to 2007, with particular focus on the aftermath of the 1990s. Section 2.3 includes brief discussion of the outlook for the relative performance of public and private equity in the current recession. Section 3 discusses several approaches to validating reported results, and section 4 concludes. 1 See Table 6 for a comparison of statistics on the concentration of entrepreneurial investments in their …rms and public equity ownership concentration for SCF 1995, 2004 and 2007.
2
2
Performance of Private and Public Equity Beyond 1989-1998
In this section, I report the extended series for the returns to public and private equity and the underlying aggregate statistics used in their construction focusing on the period after the 1990s.
2.1
Aggregate Values of Private and Public Equity
The private equity refers to non-traded owner’s capital and shareholders’equity. This is the equity held both in non-traded unincorporated businesses such as sole proprietorships, general and limited partnerships, incl. limited liability and limited liability limited partnerships, and limited liability companies, and in incorporated businesses such as subchapter S and C corporations.2 In turn, the public equity refers to direct and indirect share holdings in publicly traded companies.3 Table 1 reports the aggregate values of private and public equity owned by households in SCF4 , as well as the value of public equity from CRSP over the three-year intervals between 1989 and 2007. Both SCF and CRSP document that over the entire period public equity has grown substantially, but its average growth rate in the 1990s was well above that in the 2000s with their large negative capital gains.5 On the contrary, as reported in Table 1 the value of private equity has been growing at a fairly constant rate throughout. These di¤erences in the behavior of aggregate public and private equity values in the 1990s and 2000s are important in accounting for their relative performance over the extended period from 1989 to 2007. With di¤erent values of household sector’s public equity holdings reported in the two sources,6 the benchmark results in the paper use public equity values 2 Note that some of the businesses in the …rst category while technically not being corporate entities may be treated as such for tax purposes. E.g. limited partnerships and limited liability companies may make an election to be treated as corporations on their tax returns. In this respect classi…cation into corporate and non-corporate business sector in SCF is di¤erent from NIPA/FFA, which is based on the tax return …led by the business. 3 In this de…nition interests in an entity are considered to be publicly traded if they are (i) traded on the established securities markets, and (ii) readily tradeable on the secondary markets (or equivalent of thereof). Not all of the publicly traded businesses are technically established as corporations, but are most likely to be treated as corporate entities for tax purposes. In particular, publicly traded partnerships are automatically treated as corporations for tax purposes while remaining partnerships in their legal form of organization. 4 Since SCF is a survey, the values of both private and public equity holdings are selfreported by households. Private business owners in SCF are asked: "For how much could you sell your (share of) business?". Similarly, stock holders report the value of their stock ownership by answering questions like "What is the total market value of this stock?" for direct stock holdings and "What is the total market value of all of the stock (combination, other) mutual funds that you have?" for the indirect stock holdings. 5 In particular, the annual series on public equity values from CRSP in Table 3 show that from 1999 to 2001 public equity had been losing in value every year. Note, that SCF is a tri-annual survey and thus annual information from this source is not available, only from CSRP. 6 The household sector’s public equity holdings in CRSP are obtained by multiplying total
3
from CRSP with estimates from SCF presented for reference only. The public equity values in SCF, in particular, exclude some categories of indirect share holdings reported in CRSP leading to a systematic downward bias in Table 1.7 An additional source of discrepancies between CRSP and SCF comes from the reporting of indirectly held equities in pooled investment funds and tax-deferred retirement accounts.8 These are often invested jointly in bonds and stocks, and the split reported in SCF may not be entirely accurate. In terms of the time series behavior, unlike in the 1990s, in the period from 1999 to 2004 the series of public equity values in SCF reported over the threeyear intervals appear to diverge substantially from their CRSP counterpart.9 More speci…cally, the value of public equity in CRSP increased slightly between 1999 and 2001 and then more dramatically between 2001 and 2004. In SCF, on the contrary, the value of public equity experienced signi…cant growth between 1999 and 2001 and then declined somewhat between 2001 and 2004. Given these di¤erences in the behavior of aggregate public equity values in the two sources and the fact that CRSP is the most accurate source of public equity values, I include in Table 1 the alternative series for the public equity values from SCF, which use the information on the behavior of total public equity from CRSP. For the value of public equity in 2001 they use the weighted average of SCF values in 1999 and 2004 with the weights re‡ecting the percentage of the equity growth from 1999 to 2004 that occurred between 1999 and 2001 in CRSP.10 These alternative series are used in the computation of revised returns from SCF reported for reference in Table 2 along with the original series of SCF returns. The other statistics reported in Table 1 include various measures of aggregate pro…ts and labor compensation of privately held businesses and dividend distributions of the publicly traded companies used in the construction of public and private equity returns in Section 2.2.
2.2
Aggregate Returns to Private and Public Equity
I follow MVJ methodology to replicate returns to an index of private equity for the period 1989-1998 and to extend the series to 2007. The SCF is a crossvalue of public equity by 0.7. This is the average share of household sector. Given this, the value of public equity in household’s sector would follow closely the total for public equity. 7 Excluded from SCF are public equities owned by de…ned bene…t retirement plans, including state and local government retirement plans, or by nonpro…t organizations, insurance companies, etc., which constitute indirect holdings of the households. More systematically, comparison of SCF with other sources of aggregate statistics in terms of their coverage is addressed in Antoniewicz (2000). 8 These include combination, stock, and other mutual funds in the pooled investment funds, and IRAs, Keogh, and certain employer-sponsored accounts in the tax-deferred retirement accounts. 9 The series in CRSP referred to here are also those reported over the three-year intervals. 1 0 This is similar to the imputation used by MVJ with respect to the 1995 value of pro…ts of proprietorships and partnerships.
4
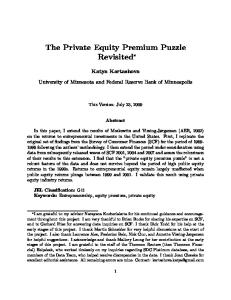
Figure 1: Time line for computing returns
sectional survey and is carried out triennially.11 Figure 1 shows data used in the construction of average annualized returns over the three-year intervals between two consequent surveys using the example of 1989 and 1992 SCFs for concreteness. The aggregate equity values are reported for the year of the survey, and the values of pro…ts (net income) correspond to the year preceding it. The average annualized return R over the period 1989-1992 is computed as the geometric average of returns R1 and R2 , where: R1 = (
MV1992 + 3 NI1988 13 ) MV1989
(1)
R2 = (
MV1992 + 3 NI1991 13 ) MV1989
(2)
R=(
p
R1 R2
1) 100%
(3)
Here the values of market equity and net income may include all of the businesses in the index of private equity, as well as incorporated and non-incorporated businesses separately. The raw returns to an index of all private equity and to indices of corporate and non-corporate private equity constructed using (1)-(2) are reported in lines 1-3 in Table 2. In the remainder of Table 2, I report raw returns with adjustments in stages for (i) the pro…t tax; (ii) retained earnings; (iii) labor income of entrepreneurs managing their own businesses;12 (iv) …rm birth and new equity investment; and (v) the exit of …rms through IPO, mergers and acquisitions, and liquidation. These adjustments apply both to the market value of equity (MV) and to net income (NI) in (1)-(2). Lines 7-24 of Table 2, provide comparison of replicated and original returns for the period 19891998 after each stage of adjustment. The originals are reported in parentheses, 1 1 The years in which SCF was carried out and for which data are publicly available are 1989, 1992, 1995, 1998, 2001, 2004, and 2007. 1 2 Appendix C discusses the assumptions underlying the labor income adjustment in MVJ and an important alternative to its implementation.
5
and replicated returns for all private equity and corporate/noncorporate equity mirror them very closely.13 The …nal returns to all private equity are reported in lines 25 and 26 (the originals) of Table 2.14 For the benchmark comparison, I use CRSP market index return reported in line 30 of Table 2. This is a value-weighted portfolio return for all available stocks in the trading period.15 The number reported for each three-year period is the geometric average of the annual returns aggregated from the monthly returns computed in CRSP. In the original period 1989-1998, returns to aggregate private equity and to an index of public equity appear to co-move closely. The returns to aggregate private equity are also not higher than returns to public equity. However, with the extension of the period under consideration into 2000s the close co-movement of the returns weakens and private equity displays a substantial premium over public equity, in particular, due to low returns in 1999-2001. Over this period, the average annualized public equity returns plunge to near zero values re‡ecting the poor performance of public equity markets, whereas returns to private equity remain largely una¤ected. To see how this average is obtained, line 2 of Table 3 reports annual returns to CRSP index. In the period from 1999 to 2001, two of the three returns are highly negative, which drives the average net return close to zero. Relatively low returns from 2002 to 2004 are also aided by negative returns in 2002. As noted above the returns to public equity index are driven by unfavorable changes in the value of equity over this period. These are reported in line 1 of Table 3. The large negative capital gains appear to be only partly o¤set by the dividend distributions of publicly traded corporations. Together these lead to an overall poor performance of public equity and its unfavorable comparison with private equity, whose equity and pro…t values had been growing at the same time. Alternative measures of public equity performance used for comparison include the CRSP S&P holding return, and Shiller’s S&P 500 index return as reported in lines 3216 and 33 respectively. They deliver qualitatively similar comparison with private equity returns. I also use public equity returns from SCF reported in line 35 of Table 2, that are constructed in the same way as their private equity counterparts. At the household level, "equity" variable from the 1 3 It would be impossible to replicate these results exactly, since the SCF is edited periodically and the old versions of the survey data are replaced by the new ones. For a list of all changes to the data, see http://www.federalreserve.gov/PUBS/oss/oss2/changes.html. 1 4 While in lines 7-24 the replicates and the original returns are quite close to each other, the di¤erence between the two is more sizeable in lines 25 and 26, which take into account the mergers and acquisitions adjustment. The sources of this discrepancy is discussed in detail in the Appendix. Over the period 1989-2007 the contribution of the mergers and acquisitions adjustment to private equity returns has always been positive leading to an increase in the private equity returns. However, the main result of the paper remains unchanged when instead the public equity returns are compared to returns in line 24 before the …nal adjustment for mergers and acquisitions. 1 5 The weights applied to the individual stock returns are given by the market value of the individual stock outstanding at the end of the previous trading period in the total value of the stock. 1 6 As well as in line 3 of Table 3.
6
SCF public extract is used for the value of household public equity holdings17 and the "dividend income" variable from the full dataset - for the value of income associated with equity owned by the household.18 The aggregate values for public equity and the dividend distributions are computed by summing up the values of equity and dividend income for each household multiplied by the SCF non-response adjusted sample weights. As in the case of private equity, I report the geometric average of the two returns (R1 and R2) computed using two alternative values of aggregate dividend income. The returns to public equity using the revised equity series in SCF are somewhat higher than the returns obtained in CRSP, but display large negative premium relative to private equity returns in 1999-2001 and 2002-2004.
2.3
The Current Recession and Equity Returns
This paper extends the results of MVJ through the end of 2007, the year of the latest available Survey of Consumer Finances used in construction of returns to the various indices of private equity. The start of the current economic crisis also dates back to the late 2007. While this is the case, the main developments of the crisis associated with declines in the stock markets and the economic activity in the real sector have taken place after the data collection for the latest SCF and other accounts of the US economy for 2007 have been completed. Thus, not surprisingly, the aggregate equity returns reported in Table 2 and Table 3 for 2004-2007 do not re‡ect these later adverse developments.19 The returns to public equity fell sharply after 2007 to signi…cantly negative values as documented in CRSP. To measure accurately the e¤ects of the current crisis on private equity returns more data, e.g. as collected in the Survey of Consumer Finances, are required. Given that the next SCF would have taken place in 2010 in the aftermath of the crisis, in July 2009 the Federal Reserve Board launched a follow-up survey of the respondents interviewed in 2007 to create a short panel, which would accurately document the e¤ects of the crisis on the households, including the owners of privately held businesses, and their …nances. These data would be publicly available in the late 2010 when an estimate of the return to private equity can also be obtained. In the meantime, for the relative performance of the public and pirvate equity one could refer to the extended series of returns from SCF reported in Section 2.2. These data have shown that over the period of 1999-2001 which included the recessionary year of 2001 the private equity substantially outperformed public equity. The SCF 2009 then should provide the estimate of the size of the private equity premium. 1 7 As mentioned previously, the household public equity holdings include direct holdings of stocks, mutual funds, de…ned contribution retirement plans, trusts and annuities. 1 8 The question corresponding to this variable in SCF is: "In total, what was your (family’s) annual income from dividends in ... (year), before deductions for taxes and anything else?". The hint provided to respondents refers to the values reported on the IRS form 1040 line number 9a, which includes only the dividends of publicly traded companies. 1 9 Appendix B provides a more detailed discussion of the aggregate statistics for private and public equity in SCF 2007 and their comparison with the aggregates in FFA/NIPA.
7
3 3.1
Validating the Results Private Equity Industry Returns
One way to validate results presented in Section 2.2 is to compare returns to an index of all entrepreneurial equity with private equity industry returns. The industry is largely composed of venture capital and buyout funds. The di¤erent stages of venture …nancing refer to seed, start-up, expansion, and capital replacement …nancing of privately held companies, with a bulk of investments directed towards start-up companies with undeveloped or developing projects. Buyout funds typically target mature companies and primarily …nance changes of ownership in these companies. The investments of the venture and buyout funds are concentrated in high-tech, consumer, communications and other service sectors.20 All of the results below are reported for the private equity industry as a whole, and for the venture capital and buyout funds separately.21 The private equity industry involves cooperation between entrepreneurs, …nancial organizers, and investors. The …nancial organizers are the general partners and the investors are the limited partners of the private equity limited partnerships, which sign contracts with entrepreneurs in their role of scientists and executives. With the multiple actors involved, for the purpose of comparison it is important to specify whose returns are used as a measure of industry performance and why. The general partners and entrepreneurs are the suppliers of human capital, who earn return on their human capital investment.22 The entrepreneurs provide the original idea and "an intensive ‡ow of new thinking and problem-solving as the company develops"23 , while the general partners perform a large range of services related to the management of the portfolio companies. The limited partners in turn are the suppliers of the …nancial capital and earn …nancial returns. The average entrepreneur in SCF combines the functions performed by distinct parties in the private equity industry as large share of total private equity is associated with businesses that (i) have been started and are being managed by entrepreneurs24 , and (ii) have high entrepreneurial ownership stakes resulting from their own equity investments.25 The raw returns reported in Table 2 therefore include both the return to …nancial investment of entrepreneurs and 2 0 Thomson Financial reports show that in 1998 these sectors attracted 76% of all private equity industry investments. Their respective share in private equity holdings of the US household sector in SCF was of a similar order of 66%. 2 1 One reason for separating these two types of private equity funds is the di¤erent structure of …nancing. Buyout …rms are typically highly leveraged, which may a¤ect the computation of the IRR-based performance measures. Another reason is the di¤erences in the valuation of portfolio investments in venture capital and buyout funds as described below. 2 2 For entrepreneurs and general partners the …nancial investment constitutes only a small part of their total investment and is taken into account. The human capital here refers to the present discounted value of the labor input - time adjusted for e¤ort. 2 3 Hall and Woodward (2007) p. 16 2 4 Rather than acquired, inherited, etc. These re‡ect the human capital investment of entrepreneur. 2 5 This re‡ects …nancial investment of entrepreneur, as additional investments are accompanied with increases in the share of the company owned.
8
payment for hours spent working in (managing) the business. The adjustment in Lines 13-18 in Table 2 removes this labor component, so that the remaining part isolates the return to …nancial investment of entrepreneur and provides an "apple-to-apple" comparison with the public equity returns reported in section 2.2.26 With the distinct roles played by di¤erent parties in the private equity industry, the appropriate measure of its performance for comparison with public equity returns is given by the return of limited partners-investors (rather than entrepreneurs-scientists). The venture capital and buyout funds represent a rather small but growing part of the total private equity. The level of activity in the industry is measured by total resources (commitments) raised from investors by general partners and disbursements (investments) from the funds to their portfolio companies. Table 4 summarizes aggregate statistics for the US private equity industry from Thomson Reuters’VentureXpert database.27 These statistics re‡ect traditional valuation practices adopted by the industry. In particular, with the venture capital …nancing taking place in rounds, the value of the investments is reported as of the most recent round of …nancing.28 In turn, the values for non-venture or buyout funds are those set at the purchase of portfolio companies and do not change until the fund exit. The investments represent cash out‡ows, and receipts from companies’exits29 - cash in‡ows, which enter the computation of returns in private equity industry. The pooled internal rate of return30 of the limited partners (investors) computed by the VentureXpert of Thomson Reuters has become the standard measure of the industry’s performance.31 This return is net of the management fees 2 6 After
additional adjustments for survivorship and other biases. reported by Thomson Reuters, these data are collected from quarterly surveys of private equity …rms, government …lings, public news releases, etc. And Kaplan and Schoar (2005) provide an estimate from VentureXpert that 70% of the overall private equity market is covered by the database. 2 8 Hall and Woodward (2009) discuss endogeneity of these …nancing events, and propose the correction to returns of investors that would take this endogeneity into account. They propose to use linear interpolation to impute values in between rounds of …nancing over the regular valuation intervals. 2 9 The company exits take place through IPOs, acquisitions by third parties, and liquidations. 3 0 Internal rate of return is de…ned as return at which net present value of investment becomes 0. 3 1 In particular, the returns from VentureXpert have been used by Kaplan and Schoar (2005) as the aggregate measures of private equity industry performance in the 1980s and 1990s. Hall and Woodward (2007) do not use venture index returns produced by VentureXpert, but compute their own measures from alternative data sources and compare them with VentureXpert. Their data are from Sandhill Econometrics. Hall and Woodward (2007) compute venture index returns using two methods. First, they construct returns using company-level ‡ows and the share of ownership of the limited investors adjusting for preferences, dilution and GP charges. Second, they calculate returns using the net amounts directly received by limited partners. They …nd that the two measures move "reasonable close" with each other, and with the VentureXpert reported returns. The …ndings in Hall and Woodward (2007) and previous studies justify using readily available index returns from VentureXpert. I will use the VentureXpert supplied return to an index of all private equity, incl. both venture and buyout funds, and for the two types of private equity separately. 2 7 As
9
and the carry interest of the general partners as well as of the cash payments to entrepreneurs according to their share of company’s ownership.32 In its construction all funds are pooled together to form a single "fund", similar to the index of all private equity in MVJ.33 More speci…cally, the IRR is calculated as an annualized e¤ective compounded rate of return using cash ‡ows to and from investors together with the residual value of the fund which is treated as a terminal cash ‡ow to investors. This residual value is net of the current liabilities, and includes cash, short-term investments, long-term equity investments, outstanding loans, and other assets. For the purpose of comparison with returns to entrepreneurial equity in SCF and public equity returns, Line 3 in Table 4 reports average pooled IRR over the 3-year intervals. An alternative measure of industry returns is included in line 4 of Table 4. It is the average one-year performance horizon IRR. It is constructed using the fund’s net asset value (i.e. the value of the fund’s investments) at the beginning of the horizon period as an initial cash out‡ow, residual value at the end of the period as the terminal cash ‡ow, and the value of any cash ‡ows from and to investors during the horizon period. The returns for each year are then averaged over the three-year intervals. The two IRR returns thus largely di¤er in how much of the underlying values are actual values obtained at exit vs. book values on the funds’balance sheets. The performance horizon return which relies on the balance sheet values of the portfolio companies, likely underestimates the actual returns of the investors. I use pooled IRR with its greater reliance on the actual exit values of the investments as the benchmark return for comparison. Reported in line 3 of Table 4 these series comove closely with the return series from SCF in line 25 of Table 2 and yield same qualitative comparison to public equity returns.
3.2
Non-actively Managed Equity in SCF
The SCF can also be used as the source of data for the returns of a broader category of passive investors. In particular, the limited partners in the private equity industry limited partnerships interviewed in the survey would be included into the category of businesses owners with no active management role in their businesses. It also includes angel investors and other wealthy individuals with equity ownership in non-publicly traded companies. Their investment returns can be computed as in section 2.2 using values of equity owned and pro…ts. While the labor income adjustment does not apply to these returns,34 several 3 2 The management fees of the general partners are paid annually for the duration of the life of the fund as a …xed percent of the commitments or investments under their management still in the fund. As a result, they may be inversely related to the performance of the fund - with poor performance portfolio companies may require longer to exit, and as long as they remain in the fund, the partners would receive their management fee. The carry interest constitutes a …xed percent (usually about 20%) of the di¤erence between the initial investment of the limited partners and the exit value of the investment (i.e. the net cash ‡ow generated by the investment). The carry interest constitutes the performance-based part of the general partner’s compensation and accrues on the fund as a whole rather than on successful exits. 3 3 Recall, its construction involves the total values of privately held equity and net income. 3 4 These are pure …nancial investment returns since investors do not have any say over the day-to-day operations of the business and do not supply their human capital.
10
other adjustments are not possible due to less detailed coverage in SCF of this equity category. The …nal returns reported are net of the tax and retained earnings adjustments. Lines 27 and 28 of Table 2 provide returns to two groups of passive investors - those with and without any other active investments respectively.35 These passive investment returns also compare favorably to the public equity returns.
3.3
Other Approaches in the Literature
The Capital Asset Pricing Model provides a natural framework for the analysis of investment incentives of an average entrepreneur-investor choosing between fully diversi…ed portfolios of public and private equity given by the CRSP and SCF indices respectively. In practice, however, the known data limitations make the formal analysis in this framework quite di¢ cult, as the sample of private equity returns in SCF is very short. Venture capital constitutes a fraction of the total private equity and for venture capital investors public equity represents a natural investment alternative. Hall and Woodward (2009) focus on the startup companies to analyze incentive of the venture capital investors overcoming the data limitations mentioned above. They construct monthly venture index returns from 1989 to 2005 using the data from SandHill Econometrics and apply the CAPM to the series of venture and public equity index returns.36 . Standard CAPM regressions deliver a positive estimate of alpha as a measure of the excess return of investments into venture index over the years taken together. These higher returns to venture capital investments may be viewed as providing some additional support for the earlier …ndings and the main result in this paper.
4
Conclusions
In this paper, I have constructed an extended series of returns to the private equity index for the period 1989-2007 using the original methodology of Moskowitz and Vissing-Jørgensen. I …nd that the "private equity premium puzzle" is not a robust feature of the data and does not survive beyond the period of high public equity returns in the 1990s. In particular, the returns to entrepreneurial equity index remain largely una¤ected when public equity returns plunge between 1999 and 2001. This result is validated using di¤erent measures of the private equity industry returns and against other studies in the literature. These …ndings may 3 5 I.e. some of these passive investors also report owner’s interest in the businesses where they do have an active management role. The returns to an index of all private equity previously reported in Section 2.2 include both actively and non-actively managed equity. 3 6 Constructed series of monthly venture index returns represent investment performance measures at regular …xed intervals, thus eliminating the problem of using CAPM with endogenous holding period returns directly available in the data. Hall and Woodward (2009) use interpolation technique to obtain values of the venture investments between the periods for which actual valuations are available. The returns are imputed as a proportional change in the value of venture positions over the month, which is analogous to the standard stock-market index returns.
11
be viewed as suggesting the role for private equity as a hedge against public equity.
5
References
Antoniewicz, R.L. (2000): "A Comparison of the Household Sector from the Flow of Funds Accounts and the Survey of Consumer Finances," Working Paper 96-26, Board of Governors of the Federal Reserve System. Hall, R.E., and S.E. Woodward (2007): "The Incentives to Start New Companies: Evidence from Venture Capital," Working papers, Hoover Institution, Stanford University. Kaplan, S. N., and A. Schoar (2005): "Private Equity Performance: Returns, Persistence, and Capital Flows," Journal of Finance, 60, 1791-1823. McGrattan, E., and E. Prescott (2005): "Expensed and Sweat Equity," Working Paper 636, Federal Reserve Bank of Minneapolis. Moskowitz, T.J., and A. Vissing-Jørgensen (2002): "The Returns to Entrepreneurial Investment: A Private Equity Premium Puzzle?," Americal Economic Review, 92, 745-778.
Appendix A. Mergers and Acquisitions MVJ report their most accurate estimates of private equity returns with the mergers and acquisitions adjustment. This is an important channel for movements in and out of private equity in addition to …rm births and deaths through liquidations and bankruptcies. The recomputed and the original returns after M&A adjustment are included in table 2 in lines 25 and 26 respectively with the upward trend in the recomputed returns. The data for this adjustment come from the SDC Platinum database of Thomson Reuters. It is a commercial use database which is regularly updated as additional information for past transactions becomes available, in particular, for missing deal values.37 MVJ report that about 50% of transactions they include in the adjustment have missing deal values in the database, and use imputation regression method to address this issue. Since the publication of the paper, however, large number of these missing value transactions were updated to include the actual deal values. Thus 3 7 The database contains a special variable which records the date when the transaction was updated last. Many transactions continue being updated many years after their e¤ective date and the date of the original posting in the database. In particular, often updated …elds include the total value of the deal, sources of …nancing (debt or equity or both) and their values. Thomson Reuters, which owns the database, collects its data from many di¤erent sources, including prospectuses, newspapers, experts, etc., so the information may become available in parts and …nd its way into database over time.
12
the di¤erence in returns mentioned earlier may re‡ect systematic downward bias created by the imputation procedure. Another source of the di¤erence is associated with classi…cation of transactions by the source of …nancing. For the purpose of this adjustment, it is important to distinguish between debt (incl. internal funds) and equity …nancing of the mergers and acquisition. While some transactions are classi…ed as debt or equity …nanced only, others use both and so their total values have to be divided accordingly. The di¤erent numbers of transactions with debt and equity …nancing reported in Table 5 of MVJ and Table 7 suggest that in mixed …nancing cases the deal value may have been assigned to either debt or equity category instead of both. While these two sources would explain most of the di¤erence between the results reported in lines 25 and 26, pure input errors may have also played a role.38 With higher private equity returns for the period 1989-1998 due to M&A adjustment, the nature of their comparison with the public equity returns over the same period remains unchanged.39 At the same time mergers and acquisitions produce an upward adjustment to the total private equity returns for the period of 1999 to 2007 and contribute positively to the premium of private over public equity.
Appendix B. Aggregate Statistics and Returns to Private Equity in SCF 2007 Table 1 reports a large increase in the total value of private equity from 2004 to 2007, largely due to an almost two-fold increase in the value of unincorporated equity. This category includes sole proprietorships, general partnerships, limited partnerships, and limited liability companies with LP and LLC responsible for most part of the increase.40 ,41 Non-corporate pro…ts experienced a similarly large growth. With the average performance of corporate equity, both of these components contributed to an increase in returns to non-corporate and all private equity over the period 2005-2007.42 To partially validate these results, Table 2 also reports FFA/NIPA non-corporate equity returns over this period. The 2007 value of non-corporate equity in NIPA/FFA is substantially smaller than in SCF. NIPA/FFA report outstanding values of balance sheet variables 3 8 For example, some of the acquirors/targets in SDC have been mistakenly coded as both private and public. These discrepancies and inaccuracies were established with the help of Thomson’s Help Desk. 3 9 The private equity returns are not higher than the public equity returns. 4 0 The limited liability companies and limited liability partnerships are grouped together for the public dataset. The LLC business type combines the corporate characteristic of limited liability for all owners with the pass-through tax treatment of partnerships, and o¤ers more organizational ‡exibility than S-corporations. 4 1 As discussed previously, this classi…cation is based on the incorporation status of the business at its establishment. Thus, unincorporated equity also includes value of the businesses that have made an election to be treated as corporation for tax purposes, which is relevant for some forms of LPs and LLCs. 4 2 The values of corporate and non-corporate equities relative to the value of total private equity serve as weights in the computation of the overall private equity return.
13
as of year end.43 SCF collects its data over a certain period during the year,44 and so the valuation dates for data reported may di¤er between the two sources. This di¤erence in timing can contribute to the discrepancy and be important in the current economic crisis dated August 2007. Another explanation for the discrepancy invokes the calculation of equity in FFA/NIPA. The value of equity includes both market and non-market components and is computed as the sum of tangible assets (real estate at estimated market value, equipment, software, and inventories all at replacement/current), …nancial assets minus liabilities. It does not include the value of intangible assets, in particular, "sweat and equity investments", which may be an important component of the business owners’45 valuation of equity reported to SCF. The returns from NIPA/FFA in 2 are similar to returns from SCF, and both by and large pre-date the full e¤ects of the crisis.
Appendix C. Robustness Checks In SCF, raw returns of entrepreneurs are constructed using net income of the business. The labor income adjustment removes the component of raw investment returns that should be correctly attributed to the human capital investment of entrepreneurs, e.g. when they provide managerial and other services to the business but fail to report labor compensation. This is particularly relevant for sole proprietors and partners, as they cannot expense labor services provided to their own businesses. Many sole proprietors and partners in SCF report receiving no or zero labor compensation. In these cases, MVJ reduce the total net income by the amount of imputed wages to arrive at the measure of capital income used in construction of returns. At the same time, if sole proprietors and partners receive positive labor compensation it is assumed to be excluded from their reported net income. There are two objections to this di¤erential treatment of net income with non-zero labor compensation. First, for the question of net income of the business the SCF codebook contains references to IRS income tax forms. The net income of sole proprietors and partners on these forms refers to the total net income, incl. labor income, independent of the labor compensation report. Second, in macro literature the factor incomes are commonly computed by applying production function shares for capital and labor to the total net income of proprietors and partners (as it includes both). These reasons suggest an alternative to an MVJ computation which subtracts both reported and unreported labor compensation from net income used in the construction of entrepreneurial returns. The macro approach may also justify using production function capital share of 33% with reported net pro…ts to arrive at a measure of capital income directly instead of imputing total labor compensation …rst and 4 3 As
in the end-of-period balance sheets of corporate and other entities. the data collection for the most recent SCF 2009 has been scheduled over the period from July to January of this year. For SCF 2007 data collection started in May 2007. 4 5 See McGrattan and Prescott (2005) for de…nitions of expensed and sweat equity investments and for the discussion of accounting issues related to these investments in NIPA/FFA. 4 4 E.g.
14
then subtracting it from net income as in MVJ. One advantage of this approach is that it assumes the constant fraction of labor adjustment over time.46 In terms of its e¤ects on returns, the alternative assumption on labor compensation in total net income reduces returns to proprietors and partnerships and the aggregate returns in the fraction of non-corporate equity in total equity. The results for this alternative adjustments for the net income of proprietors and partners (i) using both reported and imputed unreported wages and (ii) using time-invariant share of labor compensation in net income procedure are reported in lines 2 and 3 of Table 8 respectively. The above discussion proposes a di¤erent alternative of accounting for the labor component of returns to entrepreneurial investments. It largely accounts for the part of the net income of entrepreneurs, that should be regarded as compensation for the hours worked in their businesses, but not reported as such. E.g. large number of sole proprietors and partners report total net income and no labor income from their businesses, but work positive number of hours. If the present discounted sum of these unreported wages is included in the value of owners’equity, it requires labor adjustment as well. McGrattan and Prescott (2005) refer to this component of equity as sweat equity de…ned formally as the value of time "invested" into businesses by their owners, which is compensated at less than the market rate. These unaccounted investments increase the total value of the business and are made with the expectation of realizing capital gains at exit. However, they have to be correctly attributed to the human capital of entrepreneurs and excluded from their investment returns. In MVJ the labor adjustment only a¤ects the net income components of the returns and thus lowers them. Assuming the market labor compensation constitutes a constant fraction of net income and the value of business uses a constant discount rate, labor adjustment in the same proportion of equity47 and net income would leave the overall returns unchanged. Given the size of the e¤ect that labor income adjustment to net income alone produces on entrepreneurial returns in MVJ, their estimates would be substantially biased downward compared to joint net income and equity labor adjustments.
.
15
Table 1: The Size of Private and Public Equity (1989-2007), $ bln. Survey year
1989
1992
1995
1998
2001
2004
2007
Private Equity Values Total equity [1] s.e. Equity in PP s.e. Equity in SC s.e.
3,680 (525) 2,020 (397) 1,660 (242)
3,740 (298) 1,980 (143) 1,770 (223)
4,290 (277) 1,990 (174) 2,300 (241)
5,710 (427) 2,510 (208) 3,200 (348)
7,830 (484) 3,570 (272) 4,260 (358)
9,650 (521) 4,310 (299) 5,350 (411)
14,700 (859) 8,260 (626) 6,460 (560)
Public Equity Values Original series Revised series [2] Equities ratio (private/public)
1,770 1,770 2.08
2,230 2,230 1.67
3,640 3,640 1.18
7,430 7,430 0.77
11,400 8,010 0.98
10,800 10,800 0.89
13,700 13,700 1.08
Profits Pretax pro…ts PP After tax pro…ts SC Pro…ts - RE PP [3] After tax pro…ts - RE SC
335 266 268 175
433 287 347 194
460 341 368 246
543 489 434 351
787 677 629 479
842 696 673 530
1,480 863 1,180 641
Labor Income Paid wages, total PP SC Unpaid wages, total PP SC
141 65.4 75.5 179 152 27
191 79.5 112 184 148 36
246 110 136 205 181 24
292 133 159 225 172 53
331 124 212 268 214 54
336 147 193 301 245 56
419 204 224 387 334 53
Pro…ts - RE - unpaid wages PP SC
116 148
199 158
187 222
262 298
415 425
427 474
846 588
3,306 (3,292) 2,314
4,396 (4,376) 3,078
6,785 (6,734) 4,750
13,288 (13,217) 9,301
13,829
16,458
19,851
9,681
11,521
13,896
66.4
69.2
100.0
98.3
108.0
107.0
148.0
Statistics from SCF
Statistics from CRSP Equity Statistics Total Public Equity [4,5] Public equity x 0.7 [6] Dividend income of public corporations [7]
16
Table 1: The Size of Private and Public Equity (1989-2007), $ bln. (continued) Survey year 1989 1992 1995 1998 2001 2004
2007
Statistics from FFA/NIPA Private Equity Values Equity in noncorporate business [8] Minus Value of 1-4 family rental properties [9] Equals Market Value of proprietorships and partnerships S and C corporations, market value With estate multiplier = 2 [10] With estate multiplier = 3 Income and dividends Proprietors’income [11] Adj. proprietors’income less retained earnings [12, 13] Dividends, S and C private corporations [14] Public equity statistics on new issues and takeovers
2,966 916
2,980 982
3,487 1,109
4,121 1,235
4,821 1,441
6,359 1,756
8,347 1,991
2,050
1,998
2,377
2,886
3,380
4,602
6,356
1,412 2,117
1,662 2,433
1,921 2,887
2,540 3,811
2,098 3,147
2,535 3,803
-
363.3
427.6
492.1
627.8
771.9
911.6
1056.2
187.7
216.3
283.3
514.6
514.7
557.3
678.1
165.2
177.2
249.0
387.6
406.4
466.0
-
1992
1995
1998
2001
2004
2007
SDC M & A equity adj. [15] 284 442 846 1,162 1,061 1,941 New Issues of public equity [16] 40 75 108 164 63 94 Note 1: For private equity statistics, included in parentheses are standard errors. Note 2: This revision as described in the text. Note 3: RE refers to retained earnings. Note 4: The market values for CRSP are obtained from WRDS version of CRSP Monthly Stock Market indices database and correpond to the variable "Total Market Value". It reports monthly total market value for a given market for all non-ADR securities with valid prices. The values reported are those for the end of calendat year. Note 5: The values in brackets are those originally reported in MVJ. The small discrepancy can be atributed to minor revisions of CRSP. Note 6: The total value of public equity held by households obtained by multiplying CRSP value by 0.7 as the average share of corporate ownership of households in FFA over this period. Note 7. Dividend distributions of publicly traded corporations include only distributions carried out from the current net income and do not include liquidating and other distributions. Note 8: The values reported refer to net worth of noncorporate business (table B.103 of the FFA, line 31) and owners’equity in farm business and unincorporated security brokers and dealers. Note 9: These values are taken from the BEA Private Residential Fixed Assets table and refer to the value of the net stocks in 1-4 family rental properties of households, sole proprietors and partnerships and nonpro…t organizations, net of depreciation. 17
Table 1: The Size of Private and Public Equity (1989-2007), $ bln. (continued) Note 10: These numbers are constructed using SOI …les "Estate Tax Returns Filed for "Year" Decedents: Gross Estate by Type of Property". Multipliers 2 and 3 are applied to values of closely held stock at date of death (multiplied by 2 or 3 accordingly). MVJ originally reported numbers using tax …les by year of …ling. Given that most returns are …led a year after a decedent’s death, values from tax …les for year 1989 e.g. would refer to value of closely held equity for 1988, and so appropriate tax …les should be chosen. The values for 2007 are left blank as the SOI tax …les for this year have not yet been posted. Note 11: The starting point for the proprietors’income calculation is Proprietors’income incl. inventory valuation (IVA) and capital consumption (CCAdj.) adjustments reported in NIPA Table 1.13, line 14 or Table 1.12, line 9. Note 12: Adjusted proprietors’income refers to the proprietors’income adjusted for the constant annual percentage of the tax misreporting as in MVJ, which assumes that every $1 of pro…ts reported to the IRS corresponds to $1.75 of "true" pro…ts. This adjustment is available only for nonfarm proprietors’income as reported in NIPA Table 7.14, line 1 (BEA does not provide raw data from IRS for the non-corporate farm sector), so for noncorporate farm income I use reported NIPA income instead. The tax misreporting adjustment applies to income without IVA and CCAdj. I add back IVA adjustment and exclude the CCAdj. to get a measure of the actual pro…t ‡ow to proprietos. The total adjusted income to proprietors is the sum of the NIPA farm income with IVA adjustment (Table 1.12, line 32), and non-farm income constructed as above. Note 13: As in MVJ, retained earnings adjustment is the sum of the capital expenditures plus net acquisition of …nancial assets minus net increase in …nancial liabilities plus proprietors’ net investment. Note 14: These are obtained as a di¤erence between NIPA/FFA total corporate dividends and CRSP dividends of publicly traded corporations. The value for 2007 cannot be constructed as the total dividends from NIPA/FFA for this year are unavailable. Note 15: Values of M&A adjustment are aggregated for 3-year periods 1990-92, 1993-95, 1996-98, 1999-2001, 2002-04, 2005-07. These values re‡ect movements in and out of public equity between the survey years. Note 16: These are the same statistics from Ritter used in the construction of private equity returns after the IPO adjustment. As in the case of M&A adjustment values are aggregated over the three-year intervals.
18
Table 2: The Returns to Private Equity (SCF, 1989-2007) 90-92
93-95
96-98
99-01
02-04
05-07
Line
Unadjusted returns ALL PP SC
17.4 15.7 19.5
21.9 19.0 25.0
26.4 26.3 26.5
27.7 30.3 25.5
22.7 23.7 21.8
29.0 39.5 19.1
1 2 3
Income taxes All PP SC
15.8 15.7 16.0
20.7 19.0 22.5
25.4 26.3 24.5
26.5 30.3 23.4
21.8 23.7 20.2
28.5 39.5 18.1
4 5 6
12.3 (12.3) 12.8 (12.6) 11.7 (12.0)
17.2 (17.0) 15.7 (15.6) 18.7 (18.5)
22.1 (22.2) 23.1 (23.0) 21.1 (21.4)
23.1
18.9
25.8
27.1
20.6
36.7
19.8
17.2
15.4
7 8 9 10 11 12
8.2 (8.2) 6.5 (6.4) 10.2 (10.9)
13.3 (12.7) 9.2 (9.4) 17.5 (16.9)
18.6 (18.4) 16.9 (15.9) 20.0 (20.6)
20.2
16.2
23.5
22.1
16.0
33.0
18.6
16.3
14.6
7.0 (7.5) 5.3 9.2
11.8 (11.6) 7.5 16.3
16.1 (16.4) 13.8 18.0
18.2
14.5
17.4
20.4 16.4
13.9 15.0
26.3 9.0
7.4 (7.8)
12.3 (12.1)
16.7 (17.0)
18.8
14.7
17.6
Total Private equity in SCF
Retained Earnings All PP SC
Labor income All PP SC
Firm birth All PP SC IPO [1] All
19
13 14 15 16 17 18
19 20 21 22
23 24
Table 2: The Returns to Private Equity (1989-2007) (continued) 90-92 93-95 96-98 99-01 02-04 05-07
Line
Total Private equity in SCF M&A All
9.6 (8.2)
15.4 (13.0)
21.4 (19.4)
23.5
18.0
22.3
25 26
Non-actively managed private equity in SCF [2] All owners Non-active owners
37.5 36.0
10.5 21.7
26.8 40.2
15.1 13.3
15.4 5.5
22.7 36.8
27 28
Private equity in FFA/NIPA PP
5.4
13.2
17.3
16.9
19.6
19.5
29
11.0
14.5
24.5
-0.4
6.0
10.2
30
(11.0)
(14.6)
(24.7)
CRSP S&P index holding return
7.2
11.2
25.9
-2.3
1.8
6.6
32
S&P index, Shiller [4]
7.9
12.1
26.1
-4.2
0.1
-
33
Public equity in CRSP CRSP value-wgtd index updated [3]
31
Public equity in SCF Return 11.2 20.4 28.5 16.4 -0.8 9.2 34 Return, revised 11.2 20.4 28.5 3.8 11.5 9.2 35 Note 1: For the IPO adjustment, I use values for the aggregate proceeds of IPOs reported by Jay Ritter, which can be found by following this link: http://bear.cba.u‡.edu/ritter/Moneybyyear.pdf Note 2: Category "All owners" refers to entrepreneurs who report owning businesses with and without active management role; "non-active owners" refers to entrepreneurs who only own businesses where they do not have an active management role. Note 3: For the CRSP value-weighted index returns in brackets are those originally reported in MVJ. Note 4: S&P index return for the period 2004-2007 is unavailable on the Shiller’s website and is left blank.
20
Table 3: Public Equity Market Values and Returns (1998-2007) Year
CRSP market value, bln. $ CRSP index return, % CRSP S&P return, % Year
CRSP market value, bln. $ CRSP index return, % CRSP S&P return, %
1998
1999
2000
2001
2002
Line
13,288 22.3 26.7
17,009 25.3 19.5
15,575 -11.1 -10.1
13,829 -11.3 -13.0
11,034 -20.8 -23.4
1 2 3
2003
2004
2005
2006
2007
Line
14,585 33.1 26.4
16,458 13.0 9.0
17,384 7.3 3.0
19,548 16.2 13.6
19,851 7.3 3.5
1 2 3
Table 4: Private Equity Industry Characteristics and Returns (1989-2007) Year
90-92
93-95
96-98
99-01
02-04
05-07
Line
Aggrgeates, mln. $ Total resources Total investments
61,841 13,461
137,174 22,789
362,162 67,812
802,647 287,907
446,440 120,923
1,390,315 165,859
1 2
Returns, % All private equity Pooled IRR 1-yr horizon IRR
13.6 9.3
14.9 23.6
16.7 25.4
18.0 14.7
14.2 6.9
14.1 13.0
3 4
Venture Capital Pooled IRR
9.8
12.0
14.9
19.2
16.4
15.9
5
Buyout Funds Pooled IRR
21.3
19.6
19.8
17.3
12.5
13.3
6
21
Table 5: Private Equity (PE) and Own-Company Stock Ownership Measure
1995
2004
2007
Private Equity (PE) Ownership % of total PE owned by households with: more than 25% of net worth in PE more than 50% of net worth in PE more than 75% of net worth in PE
93.3 77.1 50.6
92.4 73.7 41.9
93.5 79.0 51.4
Mean % of net worth invested in PE for households with positive private equity and net worth: SCF weights only Net worth weights
36.9 45.7
37.5 41.4
37.6 46.0
Mean % of PE held in one actively managed firm for households with positive PE: SCF weights only Private equity weights
82.5 73.9
85.4 73.8
85.3 72.2
Own Company Stock Ownership in Public Firms % of total public equity owned by households with: more than 25% of public equity in own company more than 50% of public equity in own company more than 75% of public equity in own company
11.0 6.5 3.1
9.9 4.6 1.2
12.6 6.7 2.7
Mean % of net worth invested in own-company stock for households with positive own-company stock and net worth: SCF weights only Net worth weights
11.1 10.4
9.0 8.3
8.9 11.4
Mean % of directly held public equity in own-company stock for households with positive own-company stock: SCF weights only Directly held public equity weights
70.1 48.4
69.7 47.0
73.3 57.4
Mean % of total public equity held in own-company stock for households with positive own-company stock: SCF weights only Total public equity held weights
44.2 29.4
32.2 20.9
35.3 29.1
22
Table 6: Summary Statistics on Entrepreneurs from the Survey of Consumer Finances Percentile
Section A Characteristic SCF1995 Entrepreneur age Firm age Private equity value, $ ths. Sales, $ ths. Pro…ts, $ ths. Net worth, $ ths. Share of …rm, % [1] Employees [2]
Mean
Std. dev.
10th
25th
50th
75th
90th
46.5 11.9 289.3 6,994.7 94.2 774.5 86.5 12.1
12.6 11.6 1,664.9 217,000 1,646.7 3,365.7 26.4 123.8
31 2 0 0 0 32.0 100 1
37 4 5.0 4.2 0.5 80.6 1000 1
45 8 30.0 30.0 6.5 182.0 100 2
54 16 129.0 130.0 29.0 489.6 100 4
65 26 481.0 700.0 80.0 1,337.7 100 12
SCF 2007 Entrepreneur age Firm age Private equity value, $ ths. Sales, $ ths. Pro…ts, $ ths. Net worth, $ ths. Share of …rm, % Employees
49.4 12.7 751.9 6,521.6 147.2 2,067.0 82.9 28.5
11.9 10.6 4,592.4 101,000.0 994.5 8,291.6 29.2 272.9
34 2 0 1.2 0 64.0 33 1
41 4 11.0 15.0 3.0 178.3 50 1
49 10 80.0 70.0 20.0 515.8 100 2
58 18 350.0 373.0 75.0 1,519.0 100 6
65 28 1,200.0 1,500.0 200.0 4,647.8 100 15
23
Table 6: Summary Statistics on Entrepreneurs from the Survey of Consumer Finances Section B SCF 2007 Industry % PE Agriculture [3] 10.2 Construction/mining [4] 17.5 Manufacturing [5] 6.5 Retail, wholesale [6] 13.7 FIRE/communications [7] 14.7 Services [8] 37.4 Note 1: The ownership share refers to the …rst (main) actively managed business of the household, as some of them report owning more than one business. Note 2: The numbers reported are inclusive of the entrepreneur working in the business. Note 3: This category includes: agriculture, forestry, …shing, hunting, veterinary, and landscaping services. Note 4: Oil and gas extraction, coal mining, quarrying, supporting services for mining and construction. Note 5: Wholesale and retail trade, restaurants, and food services. Note 6: Finance and insurance, real estate, automotive rental and leasing, software publishing, data processing, automotive repair and maintenance. Note 7: Commercial, industrial and other intangible assets rental and leasing, employment and business support services; broadcasting and telecommunications; other administrative and support services; health, education, and social services; arts and entertainment services; recreation, accommodation and food services; personal services, etc.
24
Table 7: Merger and Acquisition Activity in Private and Public Firms (19892007), $ bln. Survey year Acquiror: Target:
Pub Priv
All acquirors, all targets Value Number of deals
220.6 4,715
All acquirors, dom. targets Value Number of deals
94.3 2,209
Dom. acq., dom. targets debt of cash funded Value Number of deals
1990-1992 Priv Priv Priv Pub
192.9 3,701
69.7 528
Pub Priv
363.8 7,746
1993-1995 Priv Priv Priv Pub
84.4 626
247.2 4,911
201.4 4,313
Pub Priv
1996-1998 Priv Priv Priv Pub
756.5 11,794
219.9 1,026
424.9 6,417
69.9 1,208
101.9 1,615
157.1 2,107
Foreign acq., dom. targets Value Number of deals
13 143
9.3 95
16 167
Dom. acq., foreign targets equity funded Value Number of deals
0.7 5
0.6 12
2.1 14
Dom. acq., all targets equity funded Value Number of deals Total change
2.7 21 284.5
25
446.1 7,093
6.9 12 441.7
24.8 37 846.2
4 6 At the same time, with the current wage imputation procedure and the alternative assumpiton on net income the average fraction of capital income in net income over the period 1989-2007 equals its share in the production function. 4 7 The start and end-of-period values of equity.
26
Table 7: Merger and Acquisition Activity in Private and Public Firms (1989-2007), $ bln. (continued) Survey year 1999-2001 2002-2004 2005-2007 Acquiror: Pub Priv Priv Pub Priv Priv Pub Priv Priv Target: Priv Priv Pub Priv Priv Pub Priv Priv Pub All acq., all targets Value Number of deals
1,126 11,588
All acq., dom. targets Value Number of deals
534.1 4,670
400.9 1,590
635.4 8,133
723.6 9,025
287.3 1,253
470 7,592
330.1 3,056
1,241 12,765
1,327 1,606
497.4 3,866
Dom. acq., dom. targets debt of cash funded Value Number of deals
181 1,966
230.8 1,959
457.7 2,308
For. acq., dom. targets Value Number of deals
22.4 222
18.7 150
82.2 265
Dom. acq., for. targets equity funded Value Number of deals
0.4 19
2.8 11
2 8
Dom. acq., all targets equity funded Value Number of deals Total change
7.9 33 1,162
27
1,488 9,670
9.3 14 1,061
45.1 10 1,941
Table 8: Robustness checks 90-92
93-95
96-98
99-01
02-04
05-07
Line
MVJ Assumptions All
9.6
15.4
21.4
23.5
18.0
22.3
1
Alternative Assumptions Non-corporate labor income [1] All
8.7
14.5
20.4
22.6
17.5
21.7
2
Production function inc. shares for PP income and [1], [2] All
8.3
13.9
19.9
21.6
16.2
20.0
3
Total Private equity in SCF
Note 1: With this adjustment both reported and unreported imputed wages for proprietors and partners are subtracted from their net income for construction of entrepreneurial returns. Note 2: This adjustment is the same as [1] above but uses time-invariant share of labor income in total net income for the labor adjustment in construction of entrepreneurial returns.
28