Winner Bias and the Equity Premium Puzzle Matthew C. Pollard∗ The Australian National University January 16, 2009
Abstract The equity premium puzzle in US stocks can be resolved by winner bias. This bias equals the difference between an expected ex-post equity premium conditioned on being the sample maximum (the “winner”) and its ex-ante premium. After correcting for winner bias, the observed US equity premium is consistent with an ex-ante premium of zero. A simple model is used where the return on all equity markets has equal mean and variance, and all have an ex-ante equity premium of zero. The model correctly predicts the US equity premium and Sharpe ratio, the distribution of ex-post premia in the 20th Century for 40 countries and the distribution of market-capitalizations in the 20th century. The results imply that US investors should expect a considerably lower future equity premium.
Author’s Address: C/O Prof. Tom Smith, School of Finance and Applied Statistics, Australian National University, ACT 0200, Australia. Email:
[email protected]. Phone: +61 422 956 540
Key words: Equity premium, selection bias JEL Classification: G10, G12, G15
∗A
full version of this paper is available at matthewcpollard.googlepages.com
1
1
Introduction
There is a tendency to study the “best” or “winner” observation more than any other in a sample. The most successful CEOs, wealthiest individuals, most profitable businesses and best performing stock markets attract more attention and academic study than the mediocre and the failed. If such success is due either partially or wholy to chance, historical performance of the winner will overestimate the expected ex-ante performance and expected future performance. The effect, termed “winner bias,” affects estimates of US stock market performance and is sufficient to fully resolve the equity premium puzzle. The equity premium puzzle (Mehr and Prescott, 1985) is the apparent contradiction be- tween the estimated equity premium of the US market (ranging between 4-7%) and the predicted equity premium from the standard consumption-based asset-pricing model (0-2%), assuming reasonable levels of risk-aversion. The puzzle has attracted considerable academic attention and and there are numerous proposed “solutions” to the puzzle; see Kocherlakota (1996) and Cochrane (2000) for summaries. Despite these proposals, Mehr and Prescott (2006) argue that the puzzle remains unsolved. This paper argues that there is no puzzle: the estimated US equity premium is positively-biased due to winner bias. The condition that the US was the 20th century “winner” automatically implies that its expected ex-post equity premium is higher than its actual ex-ante equity premium. Formally, this is the statement E [R1 |R1 = max(R1 , R2 , ..., RN )] > E[R1 ] where R1 is the realized US equity premium, R2 , ..., RN are other countries’ realized premia, E[R1 ] is the ex-ante US equity premium and E[R1 |·] is the expected realization of the US equity premium conditioned on the the US being the ex-post winner. If the actual US premium is lower than estimated, both the equity premium puzzle and the risk-free rate puzzle are partially resolved; and if the premium is sufficiently low, both are fully resolved. The challenge is therefore in quantifying the winner bias. Winner bias is quantified using the simplest possible model for global equity returns where countries are ex-ante identical, annual returns are drawn from the same i.i.d. normal distribution and the true equity premium is zero. Parameters in the model are set to averages from the Jorion and Goetzmann (1999) study of 39 global stock markets. The model is highly parsimonious, involves few parameters, and yields strong testable predictions about the distribution of equity premia and market capitalizations.
2
The Model
I consider the simplest possible model for the long term performance of global stock markets. There are N hypothetical countries and T years of observed annual returns. In each country the excess return over the risk-free rate is: normally distributed, serially independent, identically distributed and independent of other countries. Furthermore, all countries share the same constant mean and standard deviation. Let Ri,t denote the excess return for country i. The model is specified as Ri,t ∼ i.i.d N (µ, σ 2 ) for all countries. The ex-ante equity premium across all countries is µ and the Sharpe ratio is µ/σ. I assume each country has an equity premium and Sharpe ratio equal to zero, or µ = 0. There is no equity-premium puzzle in any country, nor is there a risk-free rate puzzle. After observing T years of returns, however, there will appear to be equity premium puzzles in some lucky countries due to sampling variation. The free parameters in the model are σ 2 , N and T . These are set to equally-weighted averages in the Jorion and Goetzmann (1999) data-set of 39 countries: σ 2 = 0.2 (sample average is 23%). T = 50 (sample average is 53 years; this also corresponds to the post-World War II period);. The number of hypothetical countries with stock-markets is set to N = 40.1 1 There are currently 67 stock markets that US investors can participate in using index funds (MSCI-Barra, 2008). The MSCI-Barra World Index uses 48 countries, which includes 23 “developed” and 25 “developing” markets but excludes 19 “frontier” markets.
2
3 3.1
Results US Equity Premium
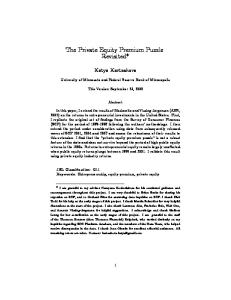
The expected winner’s ex-post equity premium in a world with zero ex-ante premium and σ = 0.2, N = 40 countries and T = 50 years of observation is 6.1%. The expected maximum Sharpe ratio is 32%. There is no significant difference between the historical US equity premium values and the expected maximum equity premium of 6.1%. (N ) Figure (1) shows the density of the expected maximum premium p(R ). Vertical lines drawn for five estimates of the equity premium used in the literature. Each estimate falls cleanly into the inner regions of the distributions, with p-values all greater than 5%. The Mehr and Prescott estimate of 6.1% has a p-value of 45%.
3.2
Global Equity Premia
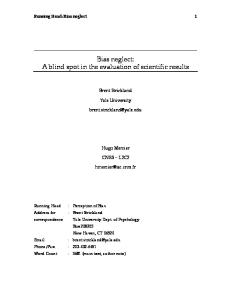
The model predicts the lowest expected ex-post equity premium and Sharpe ratio as −6.1% and −32% respectively. In the sample of 38 countries, Greece has the lowest observed equity premium and Sharpe ratio of -5.5% and -25%. These observations are not significantly different from the model results. The distributions of the minimum equity premium and Sharpe ratio are reflections about zero of the distributions for the maximum (drawn in figure (2)), and the respective p-values are 35% and 18%. The √ distribution √ of cross-sectional observed premia in the model is normal with mean 0 and standard deviation σ/ T = 0.2/ 50. The distribution is drawn in figure (3). The 38 observed premia are marked on this figure, and a kernel density estimate of the empirical distribution is drawn over the predicted distribution. The empirical distribution is approximately normal with mean of 0.23% and standard deviation of 24%. The mean is not statistically different from zero: a t-test yields a p-value of 31%. The standard deviation is marginally different to 20%: a t-test yields a p-value of 4.5%. To formally test whether these distributions are statistically equal, a Wilcoxon rank sum test was performed. There is no significant difference between model and empirical distributions, with a p-value value of 43%.
4
Conclusion
The model correctly predicts a value for ex-post winner that is statistically equal to the US equity premium and Sharpe ratio. The correctly predicts the smallest ex-post equity premia and Sharpe ratio, and correctly predicts the distribution of global equity premia and Sharpe ratios. It correctly predicts the distribution of countries percentage of total market capitalization. The winner’s expected capitalization of 30%, which compares favorably to the current US capitalization of 29%. The success of the model in these five predictions has strong implications. It implies that equity premia are equal across markets, or are indiscernible from being equal; it implies that the equity premium is fairly low (0-2%); and it implies that chance is a sufficient explanation for countries stock market successes and failures.
References [1] Cochrane, J., 2000, Asset Pricing, Princeton University Press, Chapter 20. [2] Jorion, P., & Goetzmann W., 1999, Global Stock Markets in the Twentieth Century, Journal of Finance, 953-980. [3] Mehr, R., & Prescott, E., 1985, The Equity Premium: A Puzzle, Journal of Monetary Economics, 15, 145-161. [4] Mehr, R. & Prescott, E., 2003, The Equity Premium in Retrospect, Handbook of the Economics of Finance, Elsevier, 14, 888-915.
3
10000
104
1000
102
100
Index
100 Index
10
98
1
96 94 0
10
20
30
40
50
1930
1940
1950
1960
1970
1980
1990
Year
4 1
2
3
Density
20 15 10
0
0
5
Density
25
5
30
6
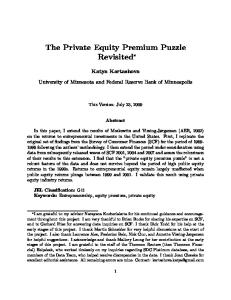
Figure 1: Model Simulation and reality. Left: A simulation from the model with ex-post winner shown in blue; Right: 39 countries real returns, 1930 to 1997 with the US shown in blue. Data kindly provided by William Goetzmann of Yale University.
0.02
0.06
0.10
0.1
Expected Equity Premium
0.2
0.3
0.4
0.5
0.6
Sharpe Ratio
Density
1.0
8 6 0
0.0
2
0.5
4
Density
1.5
10
2.0
12
14
2.5
Figure 2: US Premium Distribution Predicted by Model vs Actual. Left: Distribution of ex-post maximum equity premium in the model, with five estimates of the US equity premium. The expected ex-post maximum equity premium is 6.1%. There is no statistical difference between US estimates and what is expected from luck. Right: Distribution of ex-post maximum Sharpe ratio in the model, with five estimates of the US Sharpe ratio. The expected ex-post maximum Sharpe ratio is 32%. Again, there is no statistical difference between US estimates and what is expected from luck.
−0.10
−0.05
0.00
0.05
0.10
0.15
Realized Return
−1.0
−0.5
0.0
0.5
Realized Sharpe Ratio
Figure 3: Global Premium Distribution Predicted by Model vs Actual. Left: Distribution of realized equity premia predicted by model (solid), overlaid with the empirical √ distribution of 38 countries’ realized premia (broken). The model distribution is Normal with zero mean and σ/ T = 0.2/50 standard deviation. Right: Distribution of realized Sharpe ratios predicted by the model (solid), overlaid with the empirical distribution (broken).
4