UMD Parking and Transportation Study January 2016
In partnership with LHB & Architecture Advantage
Table of Contents Acknowledgments i Introduction 1 Study Purpose Study Area Planning Process
1 1 1
Discovery Phase
4
Demographics Existing Parking Supply Alternative Modes of Transportation Institution Comparison Summary of Findings
19
Functional Classification Traffic Distribution Intersection Control Evaluation
19 19 19
23
Public Engagement Process Future Parking Assumptions & Needs
23 24
Strategies & Solutions
29
Short-Term Parking Strategies Long-Term Parking Strategies
29 45
Recommendation Summary Attachment A – Cost Estimates Appendix A – Parking Inventory Appendix B – Traffic Analysis Report Appendix C – Listening Session Notes
4 4 4 7 18
Transportation Analysis
Exploration Phase
Acknowledgments UMD Project Management Team
Project Consultant Team
• Matt Barvels, CLA, Student
• Lance Bernard, SRF Consulting Group Inc.
• Jay Halling, Housing & Residence Life, Operations
• Craig Vaughn, SRF Consulting Group Inc.
• Lisa Hansen, Student Life Operations, Assistant Director
• Michael Palermo, SRF Consulting Group Inc.
• Patrick Keenan, Student Life Operations, Director
• Kevin Holm, LHB Inc.
• Hannah Keil, LSBE, Student
• Melissa Graftaas, Architecture Advantage, LLC
• John Kessler, Facilities Management, Project Manager • Erik Larson, Facilities Management, Civil Engineer
i
50 52 56 58 132
THIS PAGE IS INTENTIONALLY LEFT BLANK
Introduction The University of Minnesota Duluth (UMD) is a comprehensive regional university providing an alternative to both large research universities and small liberal arts colleges. UMD attracts students looking for a personalized learning experience on a medium-sized campus of a major university. UMD’s population is comprised of 12,435 (year 2015) students, faculty, and staff. The population is served by more than 50 buildings on 244 acres overlooking Lake Superior. UMD has also grown to be one of the community’s major assets, offering a range of services and activities (e.g., performing arts, banking, retail, daycare, and sporting events) to the public.
Street, College Street, and Woodland Avenue (see Figure 1). The project study area does not include off-site locations (i.e., Natural Resources Research Institute (NRRI) and the Research Lab Building - Lot Y).
Planning Process The planning process occurred over a six month period (March – August 2015). A Project Management Team (PMT) was formed to help guide the planning process and verify study findings. UMD staff and student representatives comprised the PMT. The planning process was also informed by a series of “Listening Sessions,” which are discussed in greater detail on page 23. The purpose of the “Listening Sessions” was to gather a clear understanding of UMD’s parking concerns and issues from various stakeholders (e.g., on campus residents, students, and employees). Key themes emerged from the “Listening Sessions” and PMT meetings, which shaped a series of guiding principles. The guiding principles were used to inform the planning process and the study’s recommendations:
Recent master planning efforts intend to ensure that UMD will continue to prosper as an educational institution and community asset. For example, planning is underway for a new Chemistry and Advanced Materials Science (CAMS) building. The proposed building will be located on an existing parking lot, removing a significant amount of surface parking. These combined factors have created the need to review and address the current and future campus parking supply and demand, as well as the current and future campus transportation alternatives.
• Develop parking solutions and strategies that respect UMD’s character and aesthetics.
Study Purpose
• Maximize today’s existing parking supply to its fullest potential.
The purpose of this study is to develop a comprehensive parking and transportation report. The study contains a complete review and analysis of the current and future campus parking and transportation supply and demand, and rate structure. Furthermore, the study provides recommendations to meet current and future needs based on a data-driven process, using benchmarks, best practices, and UMD campus information.
• Find low-cost/high-benefit solutions before exploring solutions and strategies that require significant resources. • Develop parking solutions and strategies that embrace multimodal alternatives. • Minimize land use impacts by preserving open space for higher and better uses.
Study Area
• Utilize the 2013 UMD Campus Master Plan as a framework.
The project study area includes on-street and off-street parking facilities bound by Junction Avenue, St. Marie
1
Finally, the planning process was developed under three phases. This phased approach helped discover existing conditions, explore opportunities, and identify solutions. The phases are described below:
Discovery Phase
Exploration Phase
The “Discovery Phase” identified existing conditions and the current utilization of on-street and off-street parking, as well as documented findings from peer and competitor institutions. The “Discovery Phase” also provided a high-level assessment of traffic distribution throughout the study area.
The “Exploration Phase” engaged students, on-campus residents, faculty, and staff to determine their parking needs and issues. The “Exploration Phase” also used data collected in the “Discovery Phase” to determine future parking needs. Future parking needs were tested using various scenarios based on industry standards and future growth assumptions.
2
Strategies & Solutions Phase The “Strategies & Solutions Phase” used the findings from the “Discovery Phase” and “Exploration Phase” to formulate “realistic” parking strategies and solutions that can be implemented over time.
WOR ST TH ST WORTH
S6
S7
GOLD ST GOLD ST
S1
S4
S2
ST W ST W MARIE ST ST MARIE
L1
® t
LIB RA RY
Ft ®
DR
CCTT AANN
J2
® t
M1
® t
Maroon Permit (Lot B, E, M1, M2, N1, N2, V, V2, Lund Lot, R1, & R3) White Permit (Lot W & S1-S8)
N1
Pay Lot
ELIZABETH ELIZABETH ST ST W W
On Street Parking Metered Zone Motor Cycle/Scooter/Moped Parking
K
® t
CT
N2
® t
® t
Designated Reserve/Service Vehicle
GRIGGS W PL W GRIGGS PL
® t
AR A
Q4
® t
Gold Permit (Lot A, C, D, R2, & Health Service Lot)
Green Permit (On Campus Resident) (Lot J2, J3, L1-L3, Q1-Q4, U, T1-T3)
® t
NI A G G
V1
ST MAR ION ST MARION
M2 C
® t
®H t
® Accessible Parking t
DR
® t
YY RRBB
® Q1 t
KI
Note: Some lots include or have a combination of meters, handicap accessible, designated reserve, & service vehicle spaces.
UNIV ER SI T YD R
® t
® t
R3
® t A
CLOV CLOVER ER ST ST W W
® t
B
CLOVER ST CLOVER ST
R2 TE
W
Lund
R1 COLLEGE W ST W COLLEGE ST
This map is intended for planning purposes. For more information regarding exact parking locations and restrictions please visit www.d.umn.edu/parking
8S
BRAINE BRAINERD RD AVE AVE
Document Path: J:\Maps\8781\mxd\Figure01_StudyAreaExistingParking.mxd
V2
L2
NIAGA ST EE RA ST NIAGARA
® t
Pay Lot
® t
® t
Q2
D
W AV ER LY AV E
® t
® t
® t
Q3
CC
NORT NORTON ON ST ST
Figure 1
Legend
WOO DL A ND AV E
U
E
OR DE
N GEE LLN LAG VVIILLLA
BUFFALO ST EE BUFFALO ST
OODD OO EEWW PPLL
M A
L3
J3 T
OONN TTII C C NN JJUU
EE AAVV
DOUGLAS AVE DOUGLAS AVE
OA KL
S5
® t
T CCTT SSTTUUAARRT
S3
® t
T3
T2
Overflow
S8
Study Area & Existing Parking Supply
DUNEDIN AVE DUNEDIN AVE
T1
IIRR DD CC N N AA
MIDWAY AVE MIDWAY AVE
® t ® t
W AAVVEE IEW BBAAYYVVIE
® t
CARVER AVE CARVER AVE
Figure 1: Study Area & Existing Parking Supply
COLLEGE ST EE COLLEGE ST
Aerial Photograph from 2013
[
Discovery Phase The Discovery Phase includes a comprehensive review of existing conditions. A key component to this phase included utilization counts. Utilization counts were conducted to determine today’s parking supply and demand. This phase also included a peer/competitor institution review.
Beyond trying to increase the supply of parking to keep up with growing demand, UMD can strive to reduce demand for parking by promoting alternative forms of transportation. In addition to helping address parking needs, active transportation options can contribute to healthy lifestyles for students, faculty, and staff. A reduction in vehicle traffic can also make the campus a more pleasant environment for all. To some extent, the university already pursues this approach, yet there is opportunity to augment existing efforts.
Demographics UMD’s population is comprised of over 12,435 students, faculty, and staff. During the fall semester of 2015, 1,950 individuals worked at UMD (full-time and part-time) and over 10,485 students were enrolled (all students in the categories of undergraduate, graduate, professional, and non-degree). Student enrollment is projected to increase at a modest rate. Recent projections estimate approximately 11,100 students for the 2019-2020 academic year1.
Alternative Modes of Transportation UMD has several programs in place to promote transportation options beyond driving alone to and from campus. Most of the university’s transportation options are marketed through the UMD Office of Sustainability’s website with some programs listed on the UMD Parking Services website and the Campus Life tab of the university’s homepage.
Existing Parking Supply The UMD campus provides and manages over 4,275 total parking spaces. The majority of parking is accommodated by surface asphalt lots. There are currently no parking structures on campus. Additional parking is located on city streets (i.e., Junction Avenue and St. Marie Street), which accounts for approximately 170 on-street parking spaces. On-street parking is not striped; therefore, the total supply of on-street parking may fluctuate. In this case, the study is using a total parking supply of 4,4452 spaces. (4,275 UMD parking spaces and 170 on-street parking spaces). See Appendix A for a more detailed inventory.
Transit The primary means by which UMD promotes alternative modes of transportation to campus is through its U-Pass program in partnership with the Duluth Transit Authority (DTA). Undergraduate students enrolled in at least six credits per semester and most graduate students are automatically assessed a $10 fee each semester. In return, they receive unlimited rides on the local bus system. Students not automatically assessed the fee can opt into the program. Faculty and staff can also opt in at a cost of $50 per fiscal year (July – June).
The bulk of parking is primarily managed by UMD through permits. Permit parking accounts for 75 percent of the parking supply. Metered parking, handicap accessible parking, on-street parking, and a pay lot account for the remaining 25 percent. Table 1 summarizes the pay structure and total number of parking spaces for these facilities.
DTA serves the UMD campus through the Kirby Plaza Bus Hub, which offers a climate-controlled waiting area. Local buses are equipped with racks to accommodate
1. University of Minnesota Duluth – Office of Academic Affairs (2015) 4
2. The existing parking supply does not account for Lot S8, which includes 56 White permitted spaces, four metered spaces, and one handicap accessible space. Lot S8 was not online until after the study.
Table 1: UMD’s Existing Parking Supply
Parking Facility White Lots
Total Percent of Total 1 Spaces Parking Supply 545
Cost
Available to
Enforced
12%
$120 per academic year
Daytime 6:00 a.m. to 5:00 p.m. Faculty, staff, and Monday through Friday, first day of students living classes fall semester through last off campus day of finals spring semester2 Daytime 6:00 a.m. to 5:00 p.m., Faculty, staff, and Monday through Friday, first day of students living classes fall semester through last off campus day of finals spring semester2
Maroon Lots
1,186
27%
$195 per academic year
Gold Lots
498
11%
$395 per fiscal year
Faculty and staff
Daytime 6:00 a.m. to 5:00 p.m., Monday through Friday, year-round
Green Lots
1,096
25%
$245 per academic year
Students living in on-campus housing
24 hours a day, 7 days a week, first day of classes fall semester through last day of finals spring semester2
Anyone
Daytime 6:00 a.m. to 5:00 p.m. Monday through Friday, first day of classes fall semester through last day of finals spring semester2
Pay Lot
340
8%
$3 per entry, cash or check $2.50 per entry with U-Card payment
Metered Parking (Purple Areas)
318
7%
$1 per hour
Anyone
Enforced between 8:00 a.m. to 6:30 p.m. Monday–Friday
On-Street Parking3
Approx. 170
4%
Free
Anyone
Parking prohibited between 2 a.m. and 6 a.m. November–May
ADA Handicap Accessible
109
2%
State Permit
Eligible Individuals
Enforced by Permit
University Vehicles & Administrators
Enforced by Permit
Contractors & Vendors
Enforced by Permit
Designated Reserve
158
3%
$395 for University vehicles & $635 for administrators
Service Vehicles
43
1%
$150 per fiscal year
Refer to Figure 1 for lot locations 1. The existing parking supply does not account for Lot S8, which includes 56 White permitted spaces, four metered spaces, and one handicap accessible space. Lot S8 was not online until after the study.
bicycles. DTA also operates two park-and-ride lots, one of which (Woodland Park) is directly connected to the UMD campus via Route 13.
2. Excluding semester breaks and holidays. 3. Maintained and operated by the city of Duluth—not UMD.
of the UMD Office of Sustainability. Outdoor racks are located throughout campus, though many of them are only in place from April through October. In the winter months, the difficulty of clearing snow around all of the racks (and the reduction in bicycle use due to climate) forces the university to consolidate bicycle parking into fewer centralized locations. Indoor parking is available at some residence halls, and covered parking is also available at the Residence Dining Center, Marshall W. Alworth Hall (MWAH), Marshall Performing Arts Center (MPAC), and rentable bicycle lockers are offered below the Residence Dining Center (RDC). There are also three on-campus bike repair stations with tools needed to make basic repairs.
In addition, Jefferson Lines offers daily intercity bus service to the Twin Cities with pick-up/drop-off in front of Kirby Student Center.
Biking UMD takes multiple steps to encourage students, faculty, and staff to bike to campus. The most visible way the university supports bicycle transportation is through the provision of bicycle parking throughout campus. A map of parking locations and types is available on the website 5
Bulldog Taxi Program
The university also actively promotes bicycle commuting through its Bike-to-Campus program. The effort tracks bicycle trips to and around campus through radio frequency identification (RFID) tags attached to bicycles enrolled in the program. Students, faculty, and staff who bike to campus a certain number of days are entered into monthly drawings for prizes. Participants can also compete against each other on teams. Faculty and staff can also receive wellness points toward reduced medical plan rates for participating in the program.
The UMD Student Association sponsors the Bulldog Taxi Program, which provides half-price cab fares to students displaying their university identification cards. The service is operated by Yellow Door Taxi 24 hours per day, seven days per week.
Driving Beyond encouraging people to switch transportation modes away from automobiles, the university offers programs to incentivize more efficient driving. Parking Services offers a stamp card to drivers of carpools. The driver gets a stamp for each passenger in the vehicle when entering the pay lot. Once the card is full of stamps, it can be traded for a free entry into the pay lot. Designated motorcycle and moped parking is also located throughout campus. Parking for these types of uses are free.
Additionally, bicycles are available for short-term rental through the Recreational Sports Outdoor Program (RSOP). Furthermore, the UMD Cycling Club supports students involved in recreational and competitive cycling and advocates for university and city policies that promote bicycling.
Walking
The Duluth Transit Authority also promotes carpooling through its eRideshare program. The program is essentially an online message board allowing people to find carpool companions. It is open to the general public, not just to students.
Walking to campus is promoted as a way to reduce the demand for parking. The UMD Office of Sustainability offers a map with estimated travel times for walking to campus from a variety of origins in the surrounding area. The map also includes bicycle travel times (see Figure 2).
Figure 2: Bicycle and Walking Travel Times (Provided by UMD Office of Sustainabilit y)
6
Institution Comparison
and price structure. Based on this comparison, UMD’s parking is priced similar to other institutions. Key findings throughout this analysis include:
UMD’s existing conditions were compared against other peer and competitor institutions. The purpose of this analysis is to understand if UMD’s current parking supply and pricing structure is comparable to other campuses.
• UMD provides lower priced options for commuters (see Table 2 – White Lots). • The peer institution average and median price point for commuters and residents ranged between $190 and $338 (see Table 2), and the competitor institution average and median price point for commuters and residents ranged between $190 and $256 (see Table 3).
Peer Institution Comparison The following universities are recognized as “peer” institutions by UMD Carnegie Classification Master’s M: • California Polytechnic State University-San Luis Obispo
• UMD has more parking per student than competitor institutions.
• College of Charleston • Minnesota State University-Mankato
• UMD’s price points range between $120 and $395 for commuters, and $245 for residents. This excludes UMD’s Designated Reserve permit prices.
• South Dakota State University • Southern Illinois University Edwardsville
Another measure for evaluating parking is to compare the existing parking supply with the number of students, faculty, and staff. The Institute of Transportation Engineers (ITE) estimate an average peak period parking demand of 0.33 spaces per person for a university/college. In this case, UMD’s current parking supply ratio is 0.35 spaces per person and meets industry standards.
• University of Massachusetts-Dartmouth • University of Michigan-Dearborn • University of North Carolina at Charlotte • University of Northern Iowa • Western Michigan University • Western Washington University
Furthermore, many peer institutions and competitors have separate pricing for staff and faculty. Staff and faculty have a different propensity to consume parking than students. Some strategies that universities utilize are separate faculty parking lots near campus, ride share programs to reduce costs for those who carpool, and bus passes.
Competitor Institution Comparison A competitor analysis was conducted in order to identify UMD’s strengths and weaknesses in comparison to their primary competitors for student enrollment. UMD’s Strategic Enrollment Management Undergraduate Competitive Analysis (2012) was used to identify the competitor institutions for this analysis:
Findings from the peer institution review indicate UMD’s parking supply and pricing structure to be comparable with similar universities and colleges. UMD however offers one of the lowest price points for commuters (i.e., $120 per year for a White permit). In that respect, there are opportunities to restructure pricing for UMD residents and commuters. It is also important to recognize that UMD offers free parking for motorcycles and mopeds from April through October. Findings from the utilization surveys will help inform the pricing recommendations from a supply and demand perspective.
• University of Minnesota Twin Cities • St. Cloud State University • Minnesota State University Mankato • North Dakota State University • University of Wisconsin-Eau Claire
Institution Comparison Findings Tables 2 & 3 provide a summary of the peer and competitor institution’s existing parking supply, population (students and employees), parking supply per person,
7
Table 2: Peer Institution Summar y
Total Spaces
Population (students/employees)
Space per Person
Cost for Long-Term Parking Permits1
California Polytechnic State University-San Luis Obispo
6,000
22,886 (20,186/2,700)
0.26
Commuter: $375 Resident: $525
College of Charleston
4,125
12,668 (10,488/2,200)
0.33
Commuter and Resident: $800-$1,200
Minnesota State University-Mankato
5,075
17,426 (15,426/2,000)
0.29
Commuter: $136 - $192 Resident: $192-$248
South Dakota State University
8,235
14,657 (12,557/2,100)
0.56
Commuter: $65 - $276 Resident: $148 - $276
Southern Illinois University Edwardsville
9,920
16,735 (14,235/2,500)
0.59
Commuter: $113 - $166 Resident: $147
University of MassachusettsDartmouth
3,230
10,253 (9,053/1,200)
0.32
Commuter: $145 Resident: $195
University of Michigan-Dearborn
5,500
10,033 (9,003/1,030)
0.55
Students: Free Faculty: $80 per year
University of North Carolina at Charlotte
12,500
30,200 (27,200/3,000)
0.41
Commuter: $210 - $340 Resident: $450
University of Northern Iowa
8,300
13,778 (11,928/1,850)
0.60
Commuter: $81 Resident: $31 - $81
Western Michigan University
~15,000
25,364 (23,914/4,150)
0.59
Commuter: $300 Resident: $300
3,560
16,940 (15,060/1,880)
0.21
Commuter: $178 - $239 Resident: $274
Peer Institution Minimum/Maximum2
3,230/12,500
10,033/30,200
0.21/0.60
Commuter: $65/$375 Resident: $31/$525
Peer Institution Average/Median2
6,645/5,750
17,358/16,735
0.43/0.41
Commuter: $286/$190 Resident: $338/$247
4,3273
12,435 (10,485/1,950)
0.353
Commuter: $120 - $3954 Resident: $245
Peer Institution
Western Washington University
University of Minnesota Duluth
1. Cost of long-term parking permits are provided for the academic year (typically 9 months). 2. Excludes the University of Michigan-Dearborn and the College of Charleston. 3. Excludes on-street parking and includes the White Lot S8. 4. Excludes Designated Reserve prices.
8
Table 3 : Competitor Institution Summar y
Peer Institution
Total Spaces
Population (students/employees)
Space per Person
Cost for Long-Term Parking Permits1
University of Minnesota Twin Cities
19,706
75,080 52,557/22,523
0.26
Commuter: $610 – $1,185 Resident: $610 – $1,185
St. Cloud State University
4,897
17,165 15,416/1,749
0.29
Commuter: $189 - $500 Resident: $189 - $500
Minnesota State University-Mankato
5,075
17,426 (15,426/2,000)
0.29
Commuter: $136 - $192 Resident: $192-$248
North Dakota State University
8,128
21,058 14,747/6,311
0.34
Commuter: $60 - $185 Resident: $60 - $185
University of Wisconsin Eau Claire
3,400
12,675 11,046/1,629
0.27
Commuter: $193 - $525 Resident: $193 - $223
Peer Institution Minimum/Maximum2
3,400/8,128
12,675/21,058
0.27/0.34
Commuter: $60 - $525 Resident: $60 - $500
Peer Institution Average/Median2
5,375/4,986
28,681/17,426
0.28/0.29
Commuter: $248/$254 Resident: $224/$214
4,3273
12,435 (10,485/1,950)
0.353
Commuter: $120 - $3954 Resident: $245
University of Minnesota Duluth
1. Cost of long-term parking permits are provided for the academic year (typically 9 months). 2. Excludes the University of Michigan-Dearborn and the College of Charleston. 3. Excludes on-street parking and includes the White Lot S8. 4. Excludes Designated Reserve prices.
Photo courtesy of UMD (http://www.d.umn.edu/maps/buildings.html)
9
Utilization Survey
-- 4:00 p.m. – A Generation Removed – Library -- 7:00 p.m. – Women Who Make America – 80 Montague Hall -- 7:30 p.m. – Shades of Africa – Weber Music Hall -- 8:00 p.m. – KPB Grocery Grab Bingo – Rafters
To determine current usage patterns, a parking utilization survey was conducted during the week of Saturday, March 28, 2015 through Friday, April 3, 2015 (with the exception of Sunday, March 29). The term “utilization” in this report is defined as a unit of measurement to describe the number of vehicles parked in a particular area.
• Wednesday April 1, 2015 -- 7:00 p.m. – Alworth Institute International Lecture – 120 SLC -- 7:30 p.m. – Shades of Africa – Weber Music Hall
Utilization counts were collected for the 9:00 a.m., 12:00 p.m., 3:00 p.m., and 6:00 p.m. hours. These hours represent the morning period (9:00 a.m.), the lunch period (12:00 p.m.), afternoon period (3:00 p.m.), and the period after most students and faculty have returned home (6:00 p.m.). The utilization survey was completed for all on-street and off-street areas within the study area. Known events during the utilization surveys included:
• Thursday April 2, 2015 -- 12:00 p.m. – Alworth Institute Brown Bag – Library -- 4:00 p.m. – Earth and Environmental Science – 191 MWAH -- 7:30 p.m. – Shades of Africa – Weber Music Hall
• Saturday March 28, 2015
• Friday April 3, 2015 (Religious Holiday: Good Friday)
-- 7:30 p.m. – Symphony Orchestra Student Soloist Competition – Weber Music Hall -- 7:30 p.m. – Detestable Madness – Dudley Experimental Theater
-- 8:00 a.m. – Admissions Bulldog Friday – Kirby Student Center -- 12:00 p.m. – Basketball – Romano Gym -- 2:00 p.m. – Basketball – Romano Gym -- 7:30 p.m. – Shades of Africa – Weber Music Hall
• Monday March 30, 2015 -- 9:00 a.m. – Tech Fest – Kirby Student Center • Tuesday March 31, 2015
10
The following section highlights each day’s utilization rates utilization rate it has typically utilized its effective supply by facility type (e.g., permitted lots, metered parking, and cushion, and is considered at full capacity. on-street parking). As part of this analysis, an 85 percent utilization rate was used as a threshold for helping deter- Finally, it is important to note the utilization counts for permine if a facility type is experiencing heavy demand. This mitted lots excludes the utilization of handicapped spaces takes into consideration UMD’s parking supply will rarely and metered spaces. This provides a more accurate picture be functioning at 100 percent capacity. When a parking of the total number of parking spaces being utilized by facility is designed, it ordinarily incorporates an effective permit holders. The utilization of metered and handicap accessible spaces are discussed separately. Utilization supply cushion to accommodate peak period demand and counts for designated version – UMDfacility PARKING & TRANSPORTATION STUDY – October 9,reserve 2015 and motorcycles/mopeds trafficDRAFT circulation. If a2.0parking exceeds a 93 percent were not collected as part of this study. Saturday (March 28, 2015) - Utilization Survey Findings
Saturday (March 28, 2015) - Utilization Survey Findings Saturday Utilization Saturday Utilization 100% 90%
85% Threshold
80% 70% 60% 50% 40% 30% 20% 10% 0% Gold
Green
Maroon 9am
On Street 12pm
Pay Lot 3pm
Metered
White
Total
6pm
Summary of Key Findings
Summary of Key Findings
• The utilization counts do not indicate any issues. In general, the utilization rates are normal for a The utilization counts do not indicate any issues. In general, the utilization rates are normal weekend sample. It is also important to recognize for a weekend sample. It is also important to recognize meters are free on weekends. meters are free on weekends.
11
DRAFT version 2.0 – UMD PARKING & TRANSPORTATION STUDY – October 9, 2015
Monday (March 30, 2015) - Utilization Survey Findings
Monday (March 30, 2015) - Utilization Survey Findings Monday Utilization Monday Utilization 100% 90%
85% Threshold
80% 70% 60% 50% 40% 30% 20% 10% 0% Gold
Green
Maroon
On Street 9am
12pm
Pay Lot 3pm
Metered
White
Total
6pm
Summary of Key Findings
-- Lot N1: 100% utilization at 9 a.m., 92% at 12 p.m., and 86% at 3 p.m. • Utilization rates of areKey normal from a total supply Summary Findings perspective. -- Lot V2: 92 % utilization at 12 p.m. Utilization rates are normal from a total supply perspective. -- Approximately 100 to 150 vacant Maroon Lot • The afternoon hours (12 p.m. and 3 p.m.) experispaces were available at 12 p.m. and 3 p.m. ence the heaviest demand for parking from a total The afternoon hours (12 p.m. and 3 p.m.) experience the heaviest demand for parking from supply perspective. • Pay Lot a total supply perspective. • Gold Lots -- 83% utilization at 12 p.m. -- Approximately 60 vacant spaces were available at -- LotC: Gold 91% utilization at 12 p.m. and 90% utilizaLots 12 p.m. at 3 p.m. tion at 3 p.m. o Lot C: 91% utilization at 12 p.m. and 90% utilization
• Green Lots at 3 p.m. -- Lot D: 91%outilization 12 p.m. and 93% utilizaLot D: at91% utilization at 12 p.m. and 93% utilization tion at 3 p.m. o Approximately 180 vacant Gold Lot spaces wereJ2, available p.m. p.m. -- Lots L1, L2, at L3,12Q1, Q2,and Q3,3Q4, T1, and U: -- Approximately 180 vacant Gold Lot spaces were 85% to 100% utilization between 9 a.m. and 6 available at 12 p.m. p.m. Maroon Lotsand 3 p.m. at 3 p.m. • Maroon Lots o Lot B: 99% utilization at 12 p.m. and 93% -- utilization Approximately 175 vacant Green Lot spaces were o Lot E: 90% utilization at 12 p.m. and 91% utilization at 3 p.m. available between 9 a.m. and 6 p.m. Underutilized -- Lot B: 99% utilization at 12 p.m. and 93% utilizao Lot M1: 100% utilization from 9 a.m. to 3 p.m. lots include J3, Q1, and T2. tion at 3 p.m. 15 • On-Street Parking -- Lot E: 90% utilization at 12 p.m. and 91% utilization at 3 p.m. -- On-street parking fluctuated throughout the day with the strongest demand at 3 p.m. -- Lot M1: 100% utilization from 9 a.m. to 3 p.m. -- Lot M2: 100% utilization from 9 a.m. to 12 p.m. 12
DRAFT version 2.0 – UMD PARKING & TRANSPORTATION STUDY – October 9, 2015
Tuesday (March 31, 2015) - Utilization Survey Findings
Tuesday (March 31, 2015) - Utilization Survey Findings Tuesday Utilization Tuesday Utilization 100% 90%
85% Threshold
80% 70% 60% 50% 40% 30% 20% 10% 0% Gold
Green
Maroon
On Street 9am
12pm
Summary of Key Findings
Pay Lot 3pm
Metered
White
Total
6pm
• Green Lots
Summary of Key Findings
• Morning (9 a.m.) and evening (6 p.m.) utilization -- Lots L1, L2, L3, Q2, Q3, Q4, T1, and U: Utilization (9 a.m.) evening (6 p.m.) utilization rates arerange normal from 89% a total ratesare Morning normal from a totaland supply perspective. rates between andsupply 100% for 9 a.m. perspective. and 3 p.m. • The afternoon hours (12 p.m. and 3 p.m.) experi-- Approximately 100 to 130 vacant spaces were ence the heaviest demand for parking from a total The afternoon hours (12 p.m. and 3 p.m.) experience the heaviest demand available at 9 a.m. and 3 for p.m.parking from supply perspective. a total supply perspective. • Pay Lot • Gold Lots -- 94% utilization at 12 p.m. -- LotC: Gold 94% utilization at 12 p.m. and 89% utilizaLots tion at 3 p.m. -- utilization 89% utilization at 3 p.m. o Lot C: 94% utilization at 12 p.m. and 89% at 3 p.m. -- Lot D: 93%outilization 12 p.m. -- Approximately 20 to 40 vacant Pay Lot spaces Lot D: at 93% utilization at 12 p.m. o 150 Approximately vacant were Gold Lot spaces were were available availableatat1212p.m. p.m.and 3 p.m. -- Approximately vacant Gold 150 Lot spaces available at 12 p.m. • White Lots Lots Maroon Lots • Maroon -- A spike in utilization for the White Lots occurred o Lund Lot: 88% utilization at 9 a.m., 100% utilization at 12hour. p.m.Atand p.m. all lots (with the at the 12 p.m. this3time, -- Lund Lot: 88% utilization at 9 a.m., 100% utilizao Lot 97% utilization at 12 p.m. and 94% utilization at S7) 3 p.m. exception of were at a utilization rate of 85% tion at 12 p.m. and 3E:p.m. o Lot M2: 100% utilization at 9 a.m., 95% utilization at 12 p.m. and 89% utilization at 3 or above. -- Lot E: 97% utilization at 12 p.m. and 94% utilizap.m. -- Approximately 100 vacant White Lot spaces were tion at 3 p.m. o Lot V1: 98% utilization at 9 a.m., and 92% utilization p.m. available atat1212p.m. -- Lot M2: 100% utilization at 9 a.m., 95% utilizao Lot V2: 100 % utilization at 12 p.m. tion at 12 p.m. and 89% utilization at 3 p.m. 17 -- Lot V1: 98% utilization at 9 a.m., and 92% utilization at 12 p.m. -- Lot V2: 100 % utilization at 12 p.m. -- Approximately 200 vacant Maroon Lot spaces were available at 12 p.m. and 3 p.m. 13
DRAFT version 2.0 – UMD PARKING & TRANSPORTATION STUDY – October 9, 2015
Wednesday 1, 2015) Utilization Survey Findings Wednesday (April(April 1, 2015) - Utilization Survey Findings Wednesday Utilization Wednesday Utilization 100% 90%
85% Threshold
80% 70% 60% 50% 40% 30% 20% 10% 0% Gold
Green
Maroon
On Street 9am
12pm
Pay Lot 3pm
Metered
White
Total
6pm
Summary of Key Findings
-- Lot V2: 100% utilization at 12 p.m. and 97% utilization at 3 p.m. • Morning (9 a.m.) and evening (6 p.m.) utilization ratesare Morning normal from a totaland supply perspective. - Approximately vacant Maroon Lot (9 a.m.) evening (6 p.m.) utilization-rates are normal 100 fromto a200 total supply spaces were available at 12 p.m. and 3 p.m. perspective. • The afternoon hours (12 p.m. and 3 p.m.) experiSummary of Key Findings
• Green Lots ence the heaviest demand for parking from a total supply perspective. The afternoon hours (12 p.m. and 3 p.m.) experience theJ2, heaviest for Q4, parking from -- Lots L1, L2, demand L3, Q2, Q3, U, and T1: Utilization rates range between 88% and 100% a total supply perspective. • Gold Lots between 9 a.m. and 6 p.m. -- Lot C: 94% utilization at 12 p.m. and 89% utiliza-- Q1 is underutilized at all times. tion at Gold 3 p.m.Lots o Lot C: 94% utilization at 12 p.m. and 89% at 3 p.m. -- utilization Overflow parking was being utilized in Lot T2 at -- Lot D: 93% utilization at 12 p.m. o Lot D: 93% utilization at 12 p.m. 9 a.m. -- Approximately to 200 vacant150 Gold o 150 Approximately to Lot 200spaces vacant Gold Lot spaces were available at 12 p.m.spaces and 3 are -- Approximately 100 to 150 vacant were available at 12 p.m. and 3 p.m. p.m. available at 12 p.m. and 3 p.m. • Maroon Lots • Pay Lot -- LotB: 94% utilization Maroon Lots at 12 p.m. -- 95% utilization at 12 p.m. Lot B: at 94% utilization at 12 p.m. -- Lot E: 99%outilization 12 p.m. and 95% utiliza-- utilization Approximately vacant spaces were available at o Lot E: 99% utilization at 12 p.m. and 95% at 3 15 p.m. tion at 3 p.m. 12 p.m. o Lot M2: 100% utilization at 9 a.m. and 12 p.m., and 92% utilization at 3 p.m. -- Lot M2: 100% utilization at 9 a.m. and 12 p.m., o Lot N2: 100% utilization at 6 p.m. and 92% utilization at 3 p.m. o utilization Lot R3: 87% at 12 p.m. -- Lot N2: 100% at 6 utilization p.m. o Lot V1: 91% utilization at 3 p.m. -- Lot R3: 87% utilization at 12 p.m. 19 -- Lot V1: 91% utilization at 3 p.m.
14
DRAFT version 2.0 – UMD PARKING & TRANSPORTATION STUDY – October 9, 2015
Thursday (April 2015) - Findings Utilization Survey Findings Thursday (April 2, 2015) -2, Utilization Survey Thursday Utilization Thursday Utilization 100%
85% Threshold
90% 80% 70% 60% 50% 40% 30% 20% 10% 0% Gold
Green
Maroon
On Street 9am
12pm
Summary of Key Findings
Pay Lot 3pm
Metered
White
Total
6pm
• Green Lots
Summary of Key Findings
• Morning (9 a.m.) and evening (6 p.m.) utilization -- Lots L1, L2, Q3, Q4, and T1: Utilization rates (9 a.m.) evening (6 p.m.) utilization rates arebetween normal 93% fromand a total supply ratesare Morning normal from a totaland supply perspective. range 100% between 9 a.m. perspective. and 3 p.m. • The afternoon hours (12 p.m. and 3 p.m.) experi-- Q1 and T2 were underutilized at all times. ence the heaviest demand for parking. The afternoon hours (12 p.m. and 3 p.m.) experience the heaviest demand for parking. -- Approximately 150 to 300 vacant spaces are • Gold Lots available between 9 a.m. and 6 p.m. -- LotC: Gold 90% utilization at 12 p.m. Lots • Pay Lot -- Lot D: 91%outilization 12 p.m. and 89% utilizaLot C: at 90% utilization at 12 p.m. -- utilization 84% utilization at 12 p.m. tion at 3 p.m. o Lot D: 91% utilization at 12 p.m. and 89% at 3 p.m. -- 83% o 200 Approximately vacant were Gold Lot spaces were utilization available at 312p.m. p.m. and 3 p.m. -- Approximately vacant Gold 200 Lot spaces available at 12 p.m. and 3 p.m. -- Approximately 50 vacant spaces were available at 12 p.m. and 3 p.m. Lots Maroon Lots • Maroon o Lot E: 95% utilization at 12 p.m. and 91% utilization at 3 p.m. -- Lot E: 95% utilization at 12 p.m. and 91% utilizao Lund Lot: 97% utilization at 9 a.m., and 100% utilization at 12 p.m. and 3 p.m. tion at 3 p.m. o Lot M2: 100% utilization at 9 a.m. and 12 p.m. -- Lund Lot: 97% utilization at 9 a.m., and 100% o Lot N2: 100% utilization at 6 p.m. utilization at 12 p.m. and 3 p.m. o Lot V1: 91% utilization at 3 p.m. -- Lot M2: 100% utilization at 9 a.m. and 12 p.m. o Lot V2: 100% utilization at 9 a.m., 97% utilization at 12 p.m., and 86% utilization at -- Lot N2: 100% utilization 3 p.m. at 6 p.m. -- Lot V1: 91% utilization at 3 p.m. -- Lot V2: 100% utilization at 9 a.m., 97% utilization 21 at 12 p.m., and 86% utilization at 3 p.m.
15
DRAFT version 2.0 – UMD PARKING & TRANSPORTATION STUDY – October 9, 2015
Friday (April 2,- Utilization 2015)Survey - Utilization Survey Findings Friday (April 2, 2015) Findings Friday Utilization Friday Utilization 100% 90%
85% Threshold
80% 70% 60% 50% 40% 30% 20% 10% 0% Gold
Green
Maroon
On Street 9am
12pm
Pay Lot 3pm
Metered
White
Total
6pm
Summary of Key Findings • Overall, utilization rates are normal. Summary of Key Findings
• The lower demand for parking on this day may Overall, utilization rates are normal. reflect faculty and students observing a religious holiday (Good Friday). Historically, Friday’s have lower demand for parking on this also beenThe determined to be a day that warrants lessday may reflect faculty and students observing a religious holiday (Good Friday). Historically, Friday’s have also been observed as a day that demand for parking. warrants less demand for parking.
23
16
Accessible Spaces - Utilization Survey Findings The utilization of accessible spaces was also evaluated during the week of March 28 – April 2, 2015. In some cases, accessible spaces were not being utilized and are shown as zero percent in Table 4. Furthermore, the utilization rates are not compared against an 85 percent uti-
lization threshold. Instead, findings from this assessment are used to determine how accessible spaces are being utilized on-campus and compared against the Minnesota Accessibility Code. Findings and recommendations are discussed further on page 43.
Table 4 : Accessible Spaces – Utilization Sur vey
Green Lots Utilization Counts
Number of Spaces
Gold Lots Lake Heaney Superior Service Hall Center
J2
L1
L2
Q1
Q2
Q4
T1
T2
2
3
2
1
1
2
3
1
1
0%
Maroon Lots
A
C
Health R2 Services Lot
1
2
4
4
0%
Metered Lots Kirby Kirby Drive/ Solon Univ. Library Ordean Drive/ Swenson Campus Drive/ Lot Court RHDC Science Center DAdB Bldg
Average Utilization
M1
V2
F
H
2
3
2
1
4
3
2
6
4
4
2
60
0%
0%
0%
0%
0%
0%
0%
0%
0%
0%
0%
0%
3%
0%
0%
0%
0% 100% 0%
0%
0%
33%
25%
0%
0%
16%
Sat. 9 AM
0% 0% 0%
0%
0%
67%
0%
0%
0%
0%
Sat. 12 PM
0% 0% 0% 100% 0%
0%
67%
0%
0%
0%
0% 50%
Sat. 3 PM
0% 0% 0%
0%
0%
0%
33%
0%
0%
0%
0%
0%
0%
0% 100% 0%
0%
0%
50%
0%
0%
100%
14%
Sat. 6 PM
0% 0% 0%
0%
0% 50%
0%
0%
0%
0%
0%
0%
0%
0%
0%
0%
0%
0%
0%
0%
25%
0%
0%
3%
Mon. 9 AM
0% 0% 0%
0%
0% 50% 33%
0%
0%
0%
0%
0%
0%
50%
0%
0%
0% 25%
0%
17%
50%
0%
0%
9%
Mon. 12 PM
0% 0% 0%
0%
0% 50% 33%
0%
0%
0%
0% 50%
0%
50%
0%
0%
0% 75% 33%
50%
33%
75%
0%
0%
19%
Mon. 3 PM
50% 0% 0%
0%
0%
0% 100%
0%
0%
0%
0%
0%
0% 75% 33%
0%
50%
50%
0%
50%
25%
Mon. 9 AM
0% 0% 0%
0%
0% 50% 33% 100%
0%
0%
0%
0%
0%
0%
0%
0%
0%
25%
0%
0%
10%
Tues. 9 AM
0% 0% 0%
0%
0%
0%
0%
0%
0%
0%
0%
0%
0%
0%
0% 25% 100%
0%
50%
100%
0%
100%
18%
Tues. 12 PM
0% 33% 0%
0%
0%
0%
0%
0%
0%
0%
0% 25%
50%
0%
67%
75%
50%
0%
26%
Tues. 3 PM
50% 0% 0%
0%
0% 50%
0%
0%
100%
0%
0% 75% 50%
50%
33%
0%
0% 50%
0%
0%
67%
75%
0%
50%
27%
Tues. 6 PM
50% 0% 0%
0%
0% 50%
0%
0%
0%
0%
0% 25%
0%
50%
0%
0%
0% 25%
0%
0%
100%
25%
0%
50%
16%
Wed. 9 AM
50% 0% 0%
0%
0% 50% 33%
0%
0%
0%
0%
0%
25%
50%
0%
0%
0%
33%
0%
17%
75%
25% 100%
19%
Wed. 12 PM
50% 0% 0%
0%
0% 50%
0%
0%
0%
0%
0%
0%
25%
0%
0%
0%
0% 50% 67%
0%
0%
50%
0%
50%
14%
Wed. 3 PM
50% 0% 0%
0%
0% 50%
0%
0%
0%
0%
50%
0%
0%
0% 25% 67% 100%
Wed. 6 PM
50% 0% 0%
0%
0% 50%
0%
0%
0%
0%
0% 50% 25%
0%
0%
0%
0% 25%
Thurs. 9 AM
50% 0% 0%
0%
0% 50%
0%
0%
0%
0%
0%
0%
50%
0%
0%
Thurs. 12 PM
0% 0% 0%
0%
0% 50% 67%
0%
0%
0%
50% 25%
0%
50%
Thurs. 3 PM
0% 33% 0%
0%
0% 100% 0%
0%
0%
0%
50% 50% 75%
50%
Thurs. 6 PM
0% 0% 0%
0%
0% 50%
0%
100%
0%
0%
0%
0%
Fri. 9 AM
0% 0% 0%
0%
0% 50% 33%
0%
100%
0%
0%
0%
0%
Fri. 12 PM
0% 0% 0%
0%
0%
0%
0%
0%
100%
0%
Fri. 3 PM
0% 0% 0%
0%
0%
0%
0%
0%
0%
0%
0%
0%
Fri. 6 PM
0% 0% 0%
0%
0% 50%
0%
0%
0%
0%
0%
0%
0%
0%
50% 0%
100% 100% 0% 0% 25% 50% 0%
0%
50% 100% 0%
0%
0%
0%
0%
0% 100% 75% 100% 50%
0%
0%
100%
0%
50%
27%
0%
33%
0%
0%
0%
10%
0% 50% 100%
0%
83%
100%
0%
50%
22%
0%
0% 100% 50% 67%
0%
83%
100%
0%
100%
31%
0%
0% 100% 25% 67% 100%
17%
75%
25%
50%
34%
50%
0%
0%
33%
0%
0%
50%
25%
0%
13%
50%
0%
0% 100% 50% 100%
0%
33%
75%
0%
0%
25%
0%
50%
0%
0%
0%
0%
67%
50%
33%
75%
25%
0%
20%
0%
0%
0%
0%
0%
0%
0%
0%
0%
0%
0%
0%
0%
25%
0%
0%
0%
0% 50% 33%
50%
33%
50%
0%
0%
12%
0%
50% 25%
Summary of Key Findings
0%
0%
0%
were not observed or recorded as part of the utilization counts.
• The metered lots are experiencing heavy utilization. Please note the utilization counts only reflect vehicles that were parked in designated handicap accessible spaces. The use of handicap accessible permits or “windshield tags” (state or UMD issued)
• The highest demand for handicap accessible spaces generally occurred during the 12 p.m. and 3 p.m. hours.
17
Summary of Findings
The utilization rates drop dramatically at 6 p.m. It is assumed a majority of on-campus residents are leaving in the evening to access jobs or other personal affairs. This assumption is further supported with the heavy utilization rates at 9 a.m., which assumes on-campus residents have returned home from the evening.
In general, there is an adequate supply of parking to meet current demand. However, there is a higher demand for parking in some areas over others that are underutilized. The highest demand for parking is typically occurring in the Maroon Lots and Pay Lot during the weekdays between 12 p.m. and 3 p.m. During this time period the utilization rates are approaching the 85 percent threshold. These findings suggest an opportunity to better manage today’s existing supply more effectively. Furthermore, these findings will help determine how much excess supply is available to meet future redevelopment initiatives. The following provides an overall summary of the existing conditions by parking area:
• Pay Lot: The pay lot experiences heavy utilization during the 12 p.m. and 3 p.m. hours. However, the utilization rates did fluctuate from day-to-day and hovered around the 85 percent threshold. Utilization rates spiked above 85 percent on Tuesday and Wednesday.
• Maroon Lots: Maroon Lots B, E, and M2 are experiencing the heaviest demand during the afternoon hours. The remaining Maroon Lots are typically underutilized. Lot V2 is experiencing some demand, which is within proximity to Lot E.
• City On-street Parking: The number of spaces fluctuated each day between 150 and 170. This range in supply is a result of on-street parking not being striped. Therefore, the size of vehicles and how drivers park their vehicles determine the number of available spaces. On-street parking was consistently utilized, but did not reach a utilization rate that indicated it was a concern. It is also important to recognize on-street parking is owned and operated by the City of Duluth. These spaces assist with UMD’s current parking supply.
• Gold Lots: Lots C and D experience the heaviest demand during the 12 p.m. and 3 p.m. hours. These lots are at, or approaching capacity during these time periods. Lot A is only being used at half capacity during peak demand.
• Metered: Overall, metered parking is operating at normal utilization rates. The only anomalies are a large demand for metered parking in front of the Solon Campus Center and in Lot K during the afternoon hours (3 p.m.).
• Green Lots: The Green Lots are heavily utilized. It is assumed there is little turnover during the day as these spaces are permitted for on-campus residents.
• Handicap Accessible Spaces: Utilization rates are normal and no areas of concern were identified.
• White Lots: The White Lots are underutilized throughout the weekdays and weekends. There is significant demand during the weekdays at 12 p.m., which is still under the 85 percent threshold.
18
Transportation Analysis A transportation analysis provided a high-level assessment of the transportation network to determine how traffic is being distributed throughout the study area.
• Kirby Drive and University Drive, which provide internal north/south connection to the campus, serve as key local roadway connections. Both of these roads were designed to slow down vehicles, discourage cut-through traffic and encourage safe pedestrian/bicycle activity.
Functional Classification The functional classification system defines both the function and role of a roadway within the hierarchy of an overall transportation network. This system is used to create a roadway network that collects and distributes traffic to the appropriate roadway facility. Functional classification planning works to manage mobility, access spacing, and spacing of routes. For example, roadways designed to move high volumes of traffic with access control are typically classified as “Arterials.” Roadways that provide direct connections between neighborhoods and arterial routes are typically classified as “Collectors.” It should also be noted that Woodland Avenue, College Street, Junction Avenue, and St. Marie Street are city streets. Kirby Drive and University Drive are owned and operated by UMD. In this case, the study area’s roadway network is appropriately aligned with functional classification principles and are summarized below:
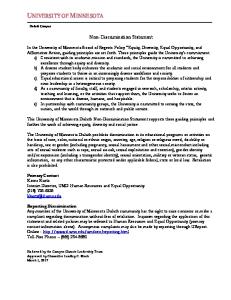
Traffic Distribution Current daily traffic volumes obtained from the Minnesota Department of Transportation (MnDOT) were reviewed to determine the origins of motorists destined to the campus. A boundary was drawn around the campus area to estimate the origin/destination of vehicles that are currently traveling along Woodland Avenue, College Street, 19th Avenue East, Carver Avenue, and St. Marie Street. This review is shown in Figure 3 and indicates that the majority (65 percent) of motorists are likely utilizing Woodland Avenue to enter/exit the campus, with relatively even distribution of motorists from the north and south. In theory, there is an even distribution of traffic between the heaviest utilized lots on campus (i.e., Maroon Lot B and E). This suggests good connectivity on the local roads without traffic being forced through UMD’s internal transportation network. However, a detailed traffic analysis would need to be conducted to determine specific traffic operations and circulation issues.
• Woodland Avenue and College Street are minor arterial roadways, meaning the roadway emphasizes mobility over land access; these roadways provide good, safe connections to/from the campus and urban areas outside of campus.
Intersection Control Evaluation
• Junction Avenue/St. Marie Street serve as the ring-road around the campus, connecting Woodland Avenue and College Street to the campus. Currently both Junction Avenue and St. Marie Street are classified as collectors. Collectors are designed to serve shorter trips that occur within the city and provide access from neighborhoods to other collector roadways and the arterial systems.
In 2013, an intersection control evaluation for College Street at Junction Avenue and 19th Avenue East was prepared. These reports provided recommendations for potential operational, safety, and multi-modal user improvements at the study intersections. These recommendations took into consideration existing turning movement counts and future traffic projections. In summary,
19
the study recommended a single-lane roundabout at the intersections of Junction Avenue and 19th Avenue East with College Street. The single-lane roundabout can also provide a “gateway” to aesthetically enhance the entrance to the adjacent neighborhoods and the UMD campus. This report is attached as Appendix B.
20
THIS PAGE IS INTENTIONALLY LEFT BLANK
Figure 3 : Transpor tation Network
5%
35%
Transportation Network Figure 2
5% XX%
Directional Distribution
Functional Classification Minor Arterial
30%
5% 5%
Document Path: J:\Maps\8781\mxd\StudyArea.mxd
15%
JUNCTION AVE
Collector Internal Campus Collector
[
Exploration Phase The Exploration Phase embraced a public engagement process by conducting a series of “Listening Sessions.” The purposes of the listening sessions were to verify findings from the utilization surveys and gather a clear understanding of UMD’s parking conditions from students, staff, and faculty. This approach established key themes in understanding today’s parking needs.
Facilities Subcommittee, and an open forum for the general public (e.g., students, staff, and faculty). Meeting materials and minutes from the listening sessions are included in Appendix C. Overall, the listening sessions generated key themes to help guide the planning process:
The Exploration Phase was also an opportunity to determine future parking needs. For example, UMD’s Campus Master Plan (2013) defines a conceptual and physical framework, guided by master plan principles and goals, for making physical changes to the campus over time. Some of these changes include new buildings and facilities, which may impact parking. Therefore, it is important that these efforts coincide with the parking study.
• Focus on low-cost/high benefit solutions before exploring large investments. • Embrace a “district-wide” parking approach. In essence, a “district-wide” approach discourages “door-to-door” parking and promotes a walkable campus between parking facilities and a user’s final destination.
Public Engagement Process
• Support a multimodal campus and Travel Demand Management (TDM) strategies to minimize parking demand.
The public engagement process was comprised of a series of “Listening Sessions” on May 3, 2015. This included meetings with the Vice Chancellor for Student Life, Campus Partners (e.g., UMD Stores, Kirby Student Center, Dining Services, Housing & Residence Life, Career Services, Athletics, Recreational Sports Outdoor Programs, Police Department, and Office of Admissions),
• Discover parking solutions that do not negatively impact the aesthetics and character of the campus.
23
Future Parking Assumptions & Needs In order to determine future parking needs, the study needed to rely on a series of assumptions and empirical evidence. Thus, a parking generation model was specifically developed for UMD to reflect existing conditions within the study area and determine future parking needs. The parking generation model uses existing conditions data (e.g., utilization survey results) and parking generation rates to estimate future parking demand. Furthermore, the parking generation model incorporates a series of assumptions to determine if the existing parking supply will be impacted by campus master planning efforts and future population growth. Recommendations drawn from the model will help inform broader campus master planning efforts. These assumptions can be changed at any time, which gives UMD a tool to use in the future to test various parking scenarios.
Future parking scenarios assumed on-street parking will continue to serve UMD’s parking needs. However, it is important to recognize on-street parking is owned and operated by the City of Duluth.
Short-Term Assumptions (1–5 years) UMD is expanding its facilities to meet the research and learning needs of students in chemistry, biochemistry, material science, and engineering. A new 56,000 square foot CAMS building is slated for construction in 2016, and will be located on an existing parking lot (Maroon – Lot B). The new building will reduce parking by 200 spaces (608 existing spaces – net 408 spaces). It is also assumed the building will generate additional parking demand. Industry standards indicate a building of this type and size will require approximately 65 parking spaces (1.2 parking spaces per 1,000 sq. ft.).
In order to determine future parking demands, SRF worked with the PMT to determine realistic assumptions. The following assumptions were used in the parking generation model as a baseline for determining potential impacts on the existing parking supply and demand. These assumptions were further defined into two time bands to help implement and phase the appropriate parking strategies and solutions.
Finally, it is assumed the campus will continue to grow at a conservative rate. For the purpose of this study, a 0.60 percent annual student and employment growth factor was used over the next ten years. This results in a population increase from 12,435 to 13,201 (see Table 5). These growth projections are carried forward throughout the long-term assumptions.
Table 5: UMD Grow th Projections
Year
Students
Employees
Total Population
2015
10,485
1,950
12,435
2016
10,548
1,962
12,510
2017
10,611
1,973
12,584
2018
10,675
1,985
12,660
2019
10,739
1,997
12,736
2020
10,803
2,009
12,812
2021
10,868
2,021
12,889
2022
10,933
2,033
12,967
2023
10,999
2,046
13,045
2024
11,065
2,058
13,123
2025
11,131
2,070
13,201
24
Long-Term Assumptions (5–10 years)
Medical Facility/Building Assumption UMD’s Campus Master Plan (2013) also identifies other opportunities for new buildings and the expansion of existing facilities. These plans are recognized as longterm initiatives and are not currently programmed for construction. However, the study assumes a new medical facility/building (120,000 sq. ft.) will be constructed over the next five to ten years. A building of this size will likely be constructed on an existing parking lot. For the purpose of this study, it is assumed this building will be placed on Gold Lot A and will reduce the total parking supply by 250 spaces (306 existing spaces – net 56 spaces). It is also assumed the building will generate additional parking demand. Industry standards indicate a building of this type and size will require approximately 144 parking spaces (1.2 parking spaces per 1,000 sq. ft.).
The study explored long-term campus master planning efforts and their potential impact on parking. The Campus Master Plan (2013) was used as a guide to help determine developments that may occur over the next ten years. Guidance and direction was also provided by the PMT. This study assumes a reduction in parking as a result of future roadway improvements and a new medical facility/ building. These future development assumptions serve as the framework for the future parking analysis. Additional campus master planning efforts may be realized outside these assumptions, such as a new Wellness Center. In that respect, the study will need to be revisited from time-to-time to confirm development assumptions and their potential impacts on parking. New development on campus will also likely warrant the need for a traffic analysis. A traffic study will help determine the potential traffic circulation issues and mitigation measures.
Parking Generation Methodology The methodology was driven by today’s existing parking supply and anticipated parking reductions over the next ten years (see Table 6). The adjusted parking supply reflects an 85 percentile downward adjustment to ensure an adequate supply cushion, and takes into consideration the loss of parking as a result of new development (e.g., CAMS and a new medical facility/building).
Realignment of West College Street The Campus Master Plan (2013) identifies a realignment of West College Street with Clover Street (see Figure 4). This improvement will address traffic control issues and geometric deficiencies at the existing intersection. However, the realignment will potentially reduce the total parking supply by 54 to 104 spaces (Maroon Lot R1 and R3, and Gold Lot R2). It is assumed these improvements will occur in five to ten years.
Figure 4 : Realignment of College Street (from Campus Master Plan)
25
Table 6 : Adjusted Parking Supply
Year
Existing Parking Supply1
Adjusted Parking Supply2
2015
4,228
3,594
2016
4,084
3,471
2017
4,084
3,471
2018
4,084
3,471
2019
4,084
3,471
2020
3,980
3,383
2021
3,980
3,383
2022
3,980
3,383
2023
3,980
3,383
2024
3,980
3,383
2025
3,730
3,171
1. The total parking supply excludes ADA, designated reserve, and motorbike parking spaces. This provides a more accurate supply number for vehicles. The reduction in parking spaces include 200 spaces (CAMS building) in 2016, 104 spaces (West College Street realignment) in 2020, and 250 spaces (Gold Lot A) in 2025. The parking supply is further adjusted in 2016 to reflect White Lot S8 (61 spaces), which came online in the fall of 2015. 2. The estimated available spaces were based on an 85 percentile downward adjustment. This takes into consideration UMD’s parking supply will rarely be functioning at 100 percent of capacity. When a parking facility is designed, it ordinarily incorporates an effective supply cushion, which is the difference between the actual number of spaces and the effective supply.
Industry standards from the Institute of Transportation walks, bikes, or uses transit to travel to and from campus Engineers (4th Edition) Parking Generation Manual require (see Table 7) - 25 percent utilize transit as their preferred 0.33 parking spaces per person, and 1.2 spaces per 1,000 mode choice. For the purposes of this study, a 25 percent sq. ft. However, the ITE rates were adjusted to reflect a mode share split was used to determine future parking mode share split. The mode share split was determined needs. This approach will ensure parking strategies are by a 2009 survey conducted by the Duluth –Superior not developed solely for the automobile, but takes into Metropolitan Interstate Council (MIC). The survey was account those who chose to use alternative modes of part of a larger transportation study for UMD and the transportation. Based on this methodology, approximately DRAFT College version 2.0 UMD PARKING(CSS). & TRANSPORTATION STUDY – October 9, 2015 of –St. Scholastica The survey results 406 additional parking spaces are needed by 2025 to indicated approximately 38 percent of UMD’s population accommodate UMD’s growth (see Table 8). Table 6: Mode Share Split (2009 Survey Results – UMD-CSS Transportation Assessment) Table 7: Mode Share Split (2009 Sur vey Results – UMD-CSS Transpor tation Assessment)
10.3% Automobile (carpool with one or more people)
11.2% Walk
2.2% Biking
25.0% Bus
50.8% Automobile (drive alone)
0.5% Motorcycle or Scooter 26
Table 8 : Parking Grow th Needs
Year
Population Growth (Faculty, Employees, & Students)1
Parking Space Needs for New Population2
Parking Supply for New Building(s)3
Parking Growth Needs
2016
77
19
67
86
2017
154
38
67
105
2018
232
57
67
125
2019
310
77
67
144
2020
388
96
67
163
2021
468
116
67
183
2022
547
135
67
203
2023
627
155
67
222
2024
708
175
67
242
2025
789
195
211
406
1. Population growth was determined by using a 0.60 percent annual increase. 2. Industry standards for a university/college estimate an average peak period parking demand of 0.33 spaces per person. This number also reflects a 25 percent mode share split based on a 2009 UMD Transportation Assessment survey (see Table 7). 3. Industry standards for a university/college estimate an average peak period parking demand of 1.2 spaces per 1,000 sq. ft. It is assumed 56,000 sq. ft. will be built in 2016, and an additional 120,000 sq. ft. in 2025.
The parking required to meet UMD’s growth (406 parking spaces) was compared against today’s available parking supply and utilization counts. The utilization counts were used to determine if there were any parking spaces available (vacant) during specific times of the day (i.e., 9 a.m., 12 p.m., 3 p.m., and 6 p.m.) that can be used to meet UMD future parking needs. The analysis looked at this purely from a supply perspective.
To test this scenario, the study determined the available parking spaces during periods of the day that generated the heaviest demand for parking. These times included the noon hours for Monday, Tuesday, Wednesday, and Thursday. Table 9 demonstrates the number of parking spaces available during these times and how many may be available to absorb UMD’s future parking needs.
27
Future Parking Needs Overall, there is not enough parking available to accommodate today’s current parking demand, nor future parking needs. Approximately 500 additional parking stalls will be needed by 2025 to meet current demand and
future campus growth. This need may be much more significant based on Wednesday’s peak parking demand (see Table 9), which identifies a need for 660 parking stalls. This demand can be reduced by
embracing the study’s guiding principles, which encourage alternative modes of transportation, and implementing the various parking strategies.
Table 9 : Future Parking Needs. Please note : Numbers with a negative symbol (-) indicate a shor tfall in parking.
Adjusted Parking Parking Parking Parking Needs Needs Growth Year Supply for New for New Needs4 (see Table 5)1 Population2 Buildings3 (see Table 7)
Mon.
Tues.
Wed.
Available Spaces at 12 p.m.5
Available Spaces at 12 p.m.5
Available Spaces at 12 p.m.5
Thurs.
Future Parking Needs6
Available Spaces at Mon. Tues. Wed. Thurs. Avg. 12 p.m.5
2016
3,471
19
67
86
197
175
47
284
111
89
-39
198
90
2017
3,471
38
67
105
197
175
47
284
92
70
-58
179
71
2018
3,471
57
67
125
197
175
47
284
73
51
-77
160
52
2019
3,471
77
67
144
197
175
47
284
54
32
-96
141
32
2020
3,383
96
67
163
109
87
-41
196
-54
-76
-204
33
-76
2021
3,383
116
67
183
109
87
-41
196
-74
-96
-224
13
-95
2022
3,383
135
67
203
109
87
-41
196
-94
-116
-244
-7
-115
2023
3,383
155
67
222
109
87
-41
196
-113
-135
-263
-26
-135
2024
3,383
175
67
242
109
87
-41
196
-133
-155
-283
-46
-155
2025
3,171
195
211
406
-104
-126
-254
-17
-510
-388
-660
-423
-495
1. The estimated available spaces were based on an 85 percentile downward adjustment. This takes into consideration UMD’s parking supply will rarely be functioning at 100 percent of capacity. When a parking facility is designed, it ordinarily incorporates an effective supply cushion, which is the difference between the actual number of spaces and the effective supply. 2. Population growth was determined by using a 0.60 percent annual increase. 3. Industry standards for a university/college estimate an average peak period parking demand of 0.33 spaces per person. This number also reflects a 25 percent mode share split based on a 2009 UMD Transportation Assessment survey (see Table 7). 4. Industry standards for a university/college estimate an average peak period parking demand of 1.2 spaces per 1,000 sq. ft. It is assumed 56,000 sq. ft. will be built in 2016, and an additional 120,000 sq. ft. in 2025. 5. The available supply is based on utilization counts prepared for this study.
28
6. Future Parking Needs: “Future Parking Needs” are calculated by subtracting the “Parking Growth Needs” from “Available Spaces.” This helps determine if there is enough parking today to absorb future parking needs. Future parking needs are based on the development assumptions (see footnotes). Positive numbers indicate there is enough parking purely from a supply perspective. Negative (-) numbers represent a shortfall in parking to meet future parking needs.
Strategies & Solutions The “Exploration” phase determined the need for 500 parking spaces over the next ten years. This need can be accommodated by carefully balancing multiple parking strategies and solutions. Therefore, the study’s recommendations are defined into two time bands to help implement and phase the appropriate parking strategies and solutions over time. The goal is to successfully implement the parking strategies and avoid the need for a new parking facility in the long-term.
proximity to existing lots that are experiencing heavy utilization. Another opportunity includes the recent expansion of the White S Lots. Lot S8 was recently constructed in late 2015, and provides an additional 56 parking spaces (see Figure 6). Please note these additional parking spaces were not online during the study’s utilization counts. A final opportunity includes the expansion and reconfiguration of the Pay Lot and Maroon Lot E. UMD should explore this expansion/reconfiguration to determine the number of new spaces that could be added.
Short-Term Parking Strategies (1–5 years)
Overall, Maroon Lot M2 and the White S Lots would provide an additional 208 parking stalls. This opportunity would help meet interim, short-term, and long-term parking needs; however, a total of 362 interim parking stalls are still needed. Some of this need can be absorbed by underutilized lots. For example, Gold Lot A (adjacent to Maroon Lot B) would be able to absorb approximately 150 to 200 parking stalls (see Table 10). Portions of Gold Lot A would need to be converted to a temporary Maroon Lot.
The short-term parking strategies are designed to meet the interim parking needs during the construction of CAMS. For example, there will be an immediate need to address the reduction of parking in Maroon Lot B. It is assumed this lot will be reduced by 200 spaces to accommodate the footprint of the new CAMS building. It is also important to recognize the reduction may be much greater in the interim as additional space will be needed for construction phasing. In that respect, UMD should assume the majority of Maroon Lot B will not be available for parking during construction. Therefore, UMD will need to plan accordingly to replace 570 parking stalls in the interim. The strategies documented throughout this section are also intended to help set the stage for meeting the long-term parking needs.
Maroon Lot B’s current utilization can also be absorbed by the White Lots. This strategy would be easier to achieve as Maroon permit holders currently have the ability to “downward” park in the White lots. Table 10 demonstrates the White Lots’ ability to absorb approximately 120 to 250 spaces during UMD’s peak period (9 a.m. – 12 p.m.). The expansion of existing lots and the utilization of excess capacity would help accommodate the potential closure of Maroon Lot B during construction. More importantly, the expansion of the existing lots would help set the stage in meeting short-term and long-term parking needs.
Expanding Surface Lots The existing surface lots have been designed and built to fully maximize their parking capacity. In most cases, there is little flexibility to add any new capacity. However, there are two areas of opportunity that provide some flexibility. Maroon Lot M2 is located adjacent to the former Stadium Apartments. This site is a viable option to add an additional 152 spaces (see Figure 5) without significantly impacting the campus footprint. Other benefits include the site’s
Cost The cost estimate to expand Lot M2 is based on past UMD standards including storm water treatment, which would be $5,800 per stall. The project cost is approximately $881,600 for 152 spaces.
29
Figure 5: Preliminar y Draft Maroon Lot M2 Expansion (prepared by UMD)
Figure 6 : White S Lot Expansion (prepared by UMD)
30
Table 10 : – Existing Parking Availabilit y (Excess Capacit y)
A
B
C
D
E
Time
Lot A Availability (85% threshold)
White Lot Availability (85% threshold)
White Lot (S8) & Maroon M2 Lot Expansion
Interim Need (570 space) – Difference
9 AM Monday
205
243
208
86
9 AM Tuesday
192
211
208
41
9 AM Wednesday
219
312
208
169
9 AM Thursday
187
264
208
89
9 AM Friday
62
306
208
6
12 PM Monday
136
123
208
-103
12 PM Tuesday
121
74
208
-167
12 PM Wednesday
149
97
208
-116
12 PM Thursday
136
133
208
-93
12 PM Friday
170
230
208
38
3 PM Monday
117
165
208
-80
3 PM Tuesday
154
176
208
-32
3 PM Wednesday
145
161
208
-56
3 PM Thursday
135
210
208
-17
3 PM Friday
117
328
208
83
6 PM Monday
152
274
208
64
6 PM Tuesday
214
418
208
270
6 PM Wednesday
217
408
208
263
6 PM Thursday
206
377
208
221
6 PM Friday
36
435
208
109
Table 10 demonstrates how the interim loss of parking (570 spaces) can be absorbed in existing lots. For example, Lot A and the White Lots provide the most opportunity because they are currently underutilized (see Column B & C). For example, Lot A can absorb 150 to 200 cars without exceeding an 85 percent capacity threshold. Utilizing these spaces and expanding White Lot S8 and Maroon Lot M2 (see Column D) will help address the interim loss of 570 spaces. Column E demonstrates the additional spaces needed to address the interim loss. A negative (-) number represents the additional parking spaces needed to address the interim loss and positive (+) indicates a surplus. Column E is determined by adding Column B, C, and D, and subtracting 570 spaces.
Temporary Surface Lots
lot. This site provides the most flexibility to accommodate an interim gravel lot, without impacting existing land uses. “Chester Park” was also selected for its general location to Maroon Lot B and access from College Street. Converting the site to a temporary parking lot will require signage, grading, materials (e.g., gravel), and potential dust control. Additional costs will include the conversion of the gravel lot to its original state once Maroon Lot B reopens.
Other options in meeting interim parking needs include the use of temporary surface lots. Temporary surface lots provide some value by keeping parking centralized to campus. In this case, a vacant parcel of land would be converted to a temporary gravel lot. Potential locations include the “surface lot” search areas identified in Figure 7. The most viable location includes the “Chester Park” 31
Cost
Lot M2, while maximizing UMD’s excess capacity in order to address interim parking needs. UMD will need to consider the following items as part of a shared parking agreement:
The project cost associated with a temporary gravel lot will range between $700,000 and $850,000 (see Attachment A). This assumes construction and returning the field back to its natural turf. The temporary gravel lot could be reverted to artificial turf, providing an amenity for recreational opportunities. Constructing a temporary gravel lot and reverting it to an artificial turf will range between $950,000 and $1,100,000.
• Logistics -----
Off-Site Parking
Number of spots needed Specific spots that will be used Time of use Shuttle service
• Maintenance
A temporary parking facility can be avoided by discovering off-site parking locations. This option provides the highest-benefit by maximizing an existing parking facility’s supply, while reducing the need to build additional parking on campus. In essence, UMD enters a shared parking agreement with a property owner to lease their underutilized parking spaces.
-- General maintenance (e.g., striping, crack sealing, and asphalt resurfacing) -- Snow removal • Utilities and Taxes -- Costs associated with lighting -- Property taxes • Enforcement
Finding an off-site parking facility will depend on the property owner’s willingness to enter into a shared parking agreement. More importantly, the location must be convenient and within proximity to UMD to ensure utilization. In this case, a half-mile search area was explored to identify any large-lot facilities within proximity to campus (see Figure 8). The half-mile search area provides an acceptable level of transit service (ten to fifteen minutes) between campus and an off-site location.
-- Signage and permitting -- Towing procedure (need permission from property owner first) • Legality -- Liability Insurance – can usually be covered under standard business liability insurance -- Length of agreement/ procedure to sever contract
Cost
The most appropriate locations in the search area include the Vineyard Church, St. Benedict Church, and the Cathedral of Our Lady of the Rosary. Religious institutions provide the most flexibility for shared parking opportunities. For example, the parking demand for a church typically occurs during the evening hours and weekends, which is opposite to UMD’s peak parking demand. Other large lot facilities include the Kenwood and Mt. Royal shopping centers; however, these commercial uses may not offer enough flexibility between their peak hour parking demands, which typically occur between 8 a.m. and 5 p.m.
Costs will need to be negotiated as part of a shared parking agreement with private property owners. Additional costs include a shuttle service between UMD and the off-site location. The Duluth Transit Authority (DTA) can provide shuttle service at approximately $100 per hour, which includes operation and maintenance. However, a reduced rate may be available as part of UMD’s partnership with the DTA in providing other transit services and programs. Utilizing the DTA to provide shuttle service is a low-cost/ high-benefit solution versus UMD purchasing or leasing buses. It is assumed a shuttle service will operate between 7 a.m. and 7 p.m. five days a week during the academic year (approximately 145 days). The total cost would be approximately $174,000 per bus for one academic year. Further analysis would be needed to determine the number of shuttle buses.
It is recommended UMD explores the feasibility of entering into a shared parking agreement with Vineyard Church. Vineyard Church provides the largest parking supply (approximately 300 parking stalls) in helping meet interim, short-term, and long-term parking needs. This strategy will also need to coincide with the expansion of Maroon 32
Figure 7: Search Areas Future Parking Options
Search Areas Future Parking Options North St. Marie Street Lot/Ramp South St. Marie Street Ramp
Figure 7
Legend Future Parking Structure (Search Area) Future Surface Lot (Search Area) Existing Parking
Stadium Lot/Ramp
Search Area Notes: Junction Ave. Lot - 300 spaces Kirby Dr. Lot - 130 spaces College St. Ramp I and II: 600 - 700 spaces to cover loss of existing spaces (6+ level deck) Chester Park Lot: 350 spaces
Campus Center Ramp
Document Path: J:\Maps\8781\mxd\StudyBoundary.mxd
Junction Ave. Lot
University Dr. Lot: 330 spaces
University Dr. Lot
Campus Center Ramp: 500 - 600 spaces (below grade) Stadium Lot/Ramp: 150 space lot/ 550 - 650 space ramp to cover loss of existing spaces (2+ level deck) South St. Marie: 500 - 600 spaces to cover loss of existing spaces (2+ level deck)
Kirby Dr. Lot
College St. Ramp I
College St. Ramp II
Chester Park Lot
North St. Marie: 425 space lot/ 500 - 600 space ramp to cover loss of existing spaces (2+ level deck)
[
Figure 8 : Search Areas Future Offsite Parking Options
Search Areas Future Offsite Parking Options
The Vineyard Church ~ 300 parking spaces
Figure 8
Saint Benedict Church ~ 125 parking spaces
mn n m
Legend UMD Campus UMD Half-Mile Buffer
Half Mile Buffer
Document Path: J:\Maps\8781\mxd\offsite search area.mxd
m n Our Lady of the Rosary Overflow Lot ~100 Parking Spaces
[
Adjust Metered Parking Supply
mitted lots, it is assumed the user is hesitant to enter the lototof access the metered or c unaware metered in exis Table 9 demonstrates how the interim loss parking (570 sspaces, paces) an be theabsorbed UMD provides over 300 metered parking spaces, which spaces exist. For example, Maroon Lot B provides metered example, Lot Athrough and tFriday he Wbetween hite Lots the most opportunity, because they are curren are enforced Monday 8 a.m.provide and parking but is not signed accordingly. 6:30 p.m. Metered spaces intended Bto & provide underutilized (see are Column C). Fshortor example, Lot A can absorb 150 to 200 cars without e The removal of underutilized metered parking within term parking for campus visitors and commuters. The these 85 percent capacity threshold. Utilizing spaces and expanding White Lot S8 and Mar utilization counts indicate that these spaces are operating permitted lots that are experiencing heavy utilization is (see Column D) will help address the interim loss of 570 spaces. an appropriate parking management strategy. In turn, at normal utilization rates, signifying steady turnover. this provides additional capacity for permit holders. It is InColum some cases, metered parking is not located in the most recommended parking bethe removed from Gold LotA negativ E demonstrates the additional spaces needed metered to address interim loss. appropriate locations. These locations include metered A, Gold Lot C, and Maroon Lot B. represents the additional parking spaces needed to address the interim loss and positive (+ parking in permitted lots. Metered parking in these locasurplus. Column used E is according determined by adding Column B, C, and D, and subtracting 570 spaces Cost tions is not commonly to the utilization counts. lots are signed andwdesignated as per- There are capital costs associated with this strategy. Page Since 32 –the Replace Table ith Graphs
Lot (Utilization) A Lot A Meters 100% 80% 60% 40%
3 PM Tuesday
3 PM Wednesday
3 PM Thursday
3 PM Friday
6 PM Monday
6 PM Tuesday
6 PM Wednesday
6 PM Thursday
6 PM Friday
esday
esday
rsday
Friday
onday
esday
esday
rsday
Friday
3 PM Monday
12 PM Friday
12 PM Thursday
12 PM Wednesday
12 PM Tuesday
12 PM Monday
9 AM Friday
9 AM Thursday
9 AM Wednesday
9 AM Tuesday
0%
9 AM Monday
20%
Lot B 100% 80% 60% 40%
35
onday
Friday
rsday
esday
esday
onday
Friday
rsday
esday
esday
0%
onday
20%
0%
80%
100%
36
Lot E
6 PM Wednesday 6 PM Thursday 6 PM Friday
6 PM Thursday
6 PM Friday
3 PM Thursday
3 PM Wednesday
3 PM Tuesday
3 PM Monday
12 PM Friday
12 PM Thursday
12 PM Wednesday
12 PM Tuesday
12 PM Monday
9 AM Friday
9 AM Thursday
9 AM Wednesday
9 AM Tuesday
6 PM Wednesday
20% 6 PM Tuesday
40%
6 PM Tuesday
60% 6 PM Monday
80%
6 PM Monday
100% 3 PM Friday
Lot (Utilization) C Lot C Meters
3 PM Friday
3 PM Thursday
3 PM Wednesday
3 PM Tuesday
3 PM Monday
12 PM Friday
12 PM Thursday
12 PM Wednesday
12 PM Tuesday
12 PM Monday
9 AM Friday
9 AM Thursday
9 AM Wednesday
9 AM Tuesday
9 AM Monday
0%
9 AM Monday
Lot (Utilization) B Lot B Meters
100%
80%
60%
40%
20%
6
6 P
6 PM
6 P
6 P
3
3 P
3 PM
3 P
3 P
12
12 P
12 PM
12 P
12 P
9
9 A
9 AM
9 A
9 A
0%
37
6 PM Friday
6 P
6 PM Thursday
3 P
3 PM
3 P
3 P
12
12 P
12 PM
12 P
12 P
9
9 A
9 AM
9 A
9 A
6 PM
20%
6 PM Wednesday
40%
6 P
60%
6 PM Tuesday
80%
6 P
100%
6 PM Monday
3 PM Friday
3 PM Thursday
3 PM Wednesday
3 PM Tuesday
3 PM Monday
12 PM Friday
12 PM Thursday
12 PM Wednesday
12 PM Tuesday
12 PM Monday
9 AM Friday
9 AM Thursday
9 AM Wednesday
9 AM Tuesday
9 AM Monday
Lot (Utilization) E Lot E Meters
Adjust Parking Prices
rate is inexpensive when compared against other parking facilities in the community and other colleges/universities. A typical daily rate in downtown Duluth and in Canal Park ranges between $4.00 and $10.00 a day. Competitors with similar environments such as St. Cloud State University, Minnesota State University – Mankato, Western Michigan University, and North Dakota State University charge $5.00 to $12.00 per day. Based on the current demand and market research, it is recommended a $0.50 to $1.00 adjustment is made (see Table 11). An annual increase should also be applied if the utilization rates continue to increase. Annual increases should be by the quarter, up to a dollar ($0.25, $0.50, $0.75, or $1.00). This provides the user convenience and the ease of providing change.
A good way to control demand is through proper pricing. However, it can be difficult to determine a precise shift in demand for change in price. For example, there are many factors that can affect elasticity including the user’s income, distance from home to location, availability, convenience, and cost of other transportation alternatives. Limited parking studies have been conducted in the collegiate setting from a parking rate perspective. The studies that have been completed mirror similar findings for price elasticity. For example, typical price elasticity for parking has been found to be about a 1% to 6% decrease in demand for every 10% increase in price (Elasticity of -0.1 to -0.6 with -0.3 being most frequently cited3). Victoria Transportation Policy Institute Parking Pricing Implementation Guidelines (2011) also suggests using a 1% to 3% decrease for 10% increase in price for future estimates. Furthermore, a study done by the University of Laval in Quebec found that for a 10% increase in price on their campus for parking decreased by 15% overall with a 19% decrease for students, a 9% decrease for staff, and only a 4% decrease for professors4.
Cost There are no capital costs associated with this strategy. Price Elasticity - Price elasticity is a term in economics often used when discussing price sensitivity. For example, price elasticity reflects the expected change in parking demand based upon an adjustment of price. In this case, parking prices were compared with today’s parking utilization and industry standards to inform recommended adjustments in price.
UMD’s current pricing structure is comparable to other peer and competitor institutions (see Page 8). However, UMD’s parking is experiencing heavy utilization in the Green Lots, Maroon Lots, and Pay Lot. These lots are approaching or exceeding the 85% threshold and their pricing structure should be adjusted accordingly to help reduce parking demand. Best practices (as indicated above) suggest a 10% to 15% price increase, which should be applied to the UMD current pricing structure (see Table 10). Once the increase is implemented, UMD should monitor each parking lot’s utilization. If utilization continues to increase, an annual increase of 1% to 3% should be implemented. The annual increase is intended to help stabilize utilization rates, in addition to keeping revenue on par with inflation rates for parking maintenance costs. The pay lot’s daily rate should also be adjusted to better reflect today’s supply and demand. In some cases, it is cheaper to pay by-the-day than to purchase a permit, which may account for the lot’s heavy utilization. The daily
3. Erin Vaca and J. Richard Kuzmyak, “Traveler Response to Transportation System Changes Chapter 13 Parking Pricing and Fees” Transit Cooperative Research Program Report 95 (2005): Pg. 13-14
4. “Reducing Automobile Dependency at university Laval,” Enerinfo Volume 17 Number 1 (Winter 2012): 1-2 38
Table 11: Adjusted Parking Prices
2016 Adjustment Parking Permit Gold Permits
2015 Cost
10% Increase 15% Increase
Annual Increase (After 2016 Increase) 1% (based on a 10% increase)
3% (based on a 10% increase)
$395 per fiscal year
$434
$454
$438
$447
Maroon Permits
$195 per academic year
$215
$224
$217
$221
White Permits
$120 per academic year
$132
$138
$133
$136
Green Permits (On Campus Residents)
$245 per academic year
$270
$286
$273
$278
Designated Reserve
$635 per fiscal year
$698
$730
$705
$719
$3.00 per entry
$3.50
$4.00
$0.25
$0.50
Pay Lot
1
1. Price increases were rounded to the nearest $0.25
Utilization Counts
the demand for parking on campus is declining; there may no longer be a demand for on-campus parking expansion.
A core component for determining existing and future parking needs were utilization counts. The utilization counts used for this analysis represent a snapshot in time. Therefore, it is important for UMD to continue to monitor parking utilization on a regular basis for all parking facilities (e.g., permitted lots, metered spaces, and on-street parking). At a minimum, utilization counts should occur once every academic year. The days and times should mirror this study’s utilization counts and occur in the month of March. This approach will help build historic trends against the counts collected for this study. UMD should also consider a more robust data collection effort and collect data during other months to determine seasonal peaks in parking demand (e.g., winter vs. spring). This data collection will build a stronger baseline for evaluating future parking needs and for identifying unforeseen parking issues.
Cost Costs associated with conducting utilization counts include staff time and internal resources. The level of effort to conduct the utilization counts that mirror this study can be done by four field staff. Traveling in a vehicle to collect data has proven to be the most efficient method for this study area. Data is typically logged in the field by using handwritten spreadsheets and logged electronically later in GIS.
Wayfinding Wayfinding systems serve an important role well beyond responding to the need for basic navigation, identification, and information. Wayfinding elements, such as monuments, directional systems, directories, interpretive, and even regulatory signs can enrich and enhance our experience within campus environments. In this case, wayfinding signage is discussed from a parking perspective. More importantly, this low-cost/high-benefit solution will help better manage today’s parking supply.
Monitoring parking utilization on a regular basis will help measure the success of the short-term strategies (e.g., parking price adjustments and off-site parking) and confirm long-term parking needs. For example, the short-term strategy emphasizes the use of off-site parking. This strategy is also intended to meet long-term parking needs before pursuing large investments (e.g., parking structure). If this strategy is implemented, UMD will need to monitor the off-site utilization to determine its effectiveness. If the data determines the off-site parking facility is being maximized (e.g., >70% utilization rates) or
Today, the parking lots are clearly marked with signage at the entrances (see Figure 9). However, the signs have created some confusion amongst the users. In some respect, this confusion is a result of the “downward parking” policy Maroon permit holders obtain. Maroon permit holders are allowed to park in White Lots. This
39
“downward parking” policy is not currently displayed on the parking signs. Moving towards a system of signs that adequately displays a permit holder’s flexibility will help maximize the current parking supply. In essence, these types of signs embrace a “color-coded” system. A “color-coded” system will help the user quickly determine if their permit is valid in a particular lot. Precedent examples of a color coded signage system are displayed in Figure 10.
Prior to implementing this strategy, UMD should consider developing a wayfinding plan. A common theme that evolved out of the public engagement activities include the lack of signage. Campus stakeholders expressed the difficulty visitors have in finding their destination (e.g., Weber Music Hall and School of Medicine) once they have parked their car, especially during sporting events. A successful wayfinding plan will address these issues and look beyond the signage needs for parking. Elements of a wayfinding plan take into consideration kiosks, banners, gateway markers, and design/branding efforts. A wayfinding plan will also help establish uniformity and a hierarchy amongst wayfinding elements. Signage for special events can be as simple as placing “sandwich” boards indicating which lots are available for event parking.
This strategy has proven to be successful in helping educate a permit holders parking options, while embracing a district-wide approach to parking. This strategy is still appropriate to continue for Maroon permit holders as the lots have indicated high utilization and White Lots, in some cases, are underutilized.
Signage for residential parking (Green Lots) should remain the same. The Green Lots do not require any “downward” parking signage. The lots are adequately signed and labeled with the parking lot’s name. In general, this type of signage provides wayfinding benefits from a safety perspective providing emergency personnel an identifier when responding to an emergency.
Additional benefits to a “color-coded” signage system will help better facilitate public parking passes issued by UMD staff and faculty. For example, the signs will display a particular color indicating a valid parking lot for public passes. Once a campus guest pass is issued, staff can instruct the user to find a lot within the specific color dot. In this case, it is suggested campus guest passes are issued for the White Lots or Gold Lot A, based on their current utilization. Figure 9 : UMD Parking Sign Examples
Figure 10 : “Downward Parking” Signs - Precedent Examples
University of California San Diego
Colorado State University
40
Northwestern University
Cost
lot. Implementing a pay station at this location will offer the benefits described in this section. Meters should also continue to be converted to accept credit, debit, and “chip-and-pin” cards. Approximately two-thirds of UMD’s meters on campus currently accept credit or debit cards.
New parking signs are recommended to be placed at the entrances of each parking lot (with the exception of the Green Lots) displaying the “downward parking” policy. These types of signs can vary in cost depending on the size, material and amenities associated with the signage (e.g., lighting and landscaping). A typical sign costs approximately $500 - $1,500 per sign. This cost includes installation and furnishing. It is assumed a total of twenty-five signs are needed for all the permitted parking lots. The total project cost is approximately $12,500–$37,500.
Cost In today’s market, there are various vendors and suppliers that offer a variety of services and products for automated pay stations. The cost for converting the pay lot to an automated pay station will range between $35,000 and $50,000. This assumes one pay station and standard arm gates at the entrance and exit points. The cost estimate may vary depending on the type of pay station and arm gates, and any added amenities such as loop detectors, which are used to determine a lot’s utilization. UMD should continue to explore the various products available to meet their needs.
Parking Technology Integrating the use of new technologies is an effective strategy to manage parking. For example, recent discussions have evolved around the use of automated pay machines for metered parking and the pay lot. Automated pay machines allow the user to pay with credit cards instead of cash. The demand for this service has grown to meet the needs of the customer, who now typically pay by credit or debit card. Benefits in moving towards automated pay machines include:
Travel Demand Management (TDM) Strategies Research has shown that Travel Demand Management (TDM) Strategies are a useful technique in helping alleviate parking demands. TDM strategies are applied to help reduce the number of single occupancy vehicles traveling and parking in a certain area. UMD should be actively pursuing TDM strategies on an annual basis. While UMD has taken steps to encourage people to travel to campus by means other than driving alone, there are several ways in which the university could increase its TDM efforts.
• Offers the customer an easy, secure and quick way to pay with credit or debit cards. • Provides the parking manager (i.e., UMD) the ability to track utilization and turnover rates. • Better cash control and auditing procedures. • Shifts a proportion of cash collection to direct bank processing. • Flexibility to adjust parking rates (e.g., event parking) and time restrictions at gate controlled entrances/exits.
Transit Improve Visibility of the Kirby Bus Hub in University Maps: The transit stop is included on the Free Speech Zone and Gender Inclusive Bathrooms Maps, but it is absent from the Building Locations and Parking Maps and not clearly labeled in the Interactive Campus Map. More prominent placement in all campus maps would increase awareness of transit.
Integrating the use of pay machines will need to be cognizant of emerging technologies and pay methods. National efforts are transitioning towards automated pay machines that accept “chip-and-pin” cards. The industry commonly refers to the “chip-and-pin” as the Europay, MasterCard, and Visa (EMV). EMV developed the technology specification for payments, which has been adopted by the major card providers.
Biking Offer Longer-Term Bicycle Leasing: While bicycles are available to rent on a daily basis through RSOP, leasing bikes for semester- or year-long terms could increase daily bicycle use by students, faculty, and staff. This type
To stay current with industry standards, UMD should transition towards automated pay machines for the pay
41
of program is offered at the University of Wisconsin – Eau Claire.
within close proximity to their home. In turn, those individuals are matched and carpool to campus. Many universities use a service called Zimride.
Start a Bike-Sharing Program: Bike-sharing enables people to ride a bike for portions of their daily travel without having to commit to bicycling all day or maintain their own equipment. For example, the “Nice Ride” program has been successful at the University of Minnesota – Twin Cities.
Eliminate First-Year on Campus Resident Parking: Universities and colleges throughout the nation are implementing new programs to reduce the number of student vehicles on campus. Common practices include the restriction of vehicles brought on campus by first year students. In turn, first year students are encouraged to take advantage of the multitude of transportation modes that are available such as walking, biking, and public transportation. This approach helps increase a stronger mode share split throughout the campus and supports a sustainable campus environment by reducing automobile dependency.
Open a Bike Center: Establish a location offering essential bicycle equipment and services including things like parts for sale, repair services, bicycle etiquette/safety training, lockers, and showers. The University of Minnesota – Twin Cities has a permanent establishment called the U of M Bike Center, and the University of Texas at Austin offers a mobile shop called The Kickstand. However, Duluth’s biking season is limited within a colder climate. As biking increases in Duluth, the demand for a center may increase. UMD will need to continue to monitor the number of bike commuters to and from campus.
UMD has a robust network of alternative transportation modes that make first year student car restrictions a viable option. In that respect, UMD should consider the elimination of parking permits for first year students living on campus.
Create Marked Bikeways through Campus: Marked bikeways can help with wayfinding for people traveling by bicycle and reduce conflicts between cyclists and vehicles or pedestrians by separating people by mode of travel.
Cost Costs will vary for each TDM strategy.
Accessible Spaces
Driving
The utilization counts and field observations did not identify any areas of concern. However, UMD will need to be cognizant of the American’s with Disability Act (ADA), Minnesota Accessibility Code, and Minnesota State Statute 169.346 requirements for accessible parking when today’s parking supply is modified (reduced or added). UMD is required to provide one accessible parking space that meets MN Accessibility Code design guidelines for every 25 spaces up to 100 spaces. The requirement is reduced as the number of spaces increase. For example, for every 101 to 200 spaces the requirement is lowered to 1 per 50 spaces, and for every 201 to 500 spaces the requirement is one per 100 spaces. Parking lots with 501 to 1,000 spaces are required to ensure two percent of the parking is compliant with MN Accessibility Code. For parking lots with over 1,000 spaces there is a requirement of 20 spaces plus an additional space for every 100 spaces over 1,000.
Offer Locational Benefits for Carpoolers: In addition to the stamp cards offered to carpoolers, dedicate some parking spaces closest to key destinations on campus to people sharing rides. Establish a Car-Sharing Program: Car-sharing programs enable people to live on campus without owning a car while still providing access to a vehicle to run errands if needed. This strategy will help reduce the residential demand for parking on campus. The University of Minnesota – Twin Cities offers a Zipcar program and the University of Wisconsin – Eau Claire offers car-sharing through Enterprise. Provide a Platform for Ride-Matching: The university could benefit from establishing its own rideshare platform to facilitate carpooling among faculty, staff, and some students. Ride-matching programs identify individuals who share the same destination and work/class schedule
UMD’s current parking supply is 4,336 spaces (excludes
42
Cost
on-street), which includes the recent expansion of White Lot S8. Based on the above requirements, UMD is required to provide approximately 54 accessible spaces. This assumes UMD’s total parking supply is treated as one parking facility to serve the entire campus. UMD currently exceeds this requirement by providing 66 accessible spaces. However, it is important to recognize design was not considered.
Internal costs are associated with this strategy. Prepare an Accessibility Study: The study
did not identify any areas of concern regarding accessible spaces. However, it is recommended a more comprehensive accessibility study is prepared to determine the appropriate locations for accessible spaces. The study should also evaluate the accessible routes between accessible spaces and campus facilities/buildings.
Parking stalls must meet minimum design guidelines to be considered accessible. Requirements include signage, size, and location. Every accessible stall is required to have a non-removable sign that is visible to the driver from inside the car that depicts the international symbol of access in white on a blue background, and indicates a fine of up to $200. Furthermore, the stall must be at least 96” wide with a 60” access aisle to accommodate a wheel chair. Access aisles are required to be marked either by markings on the ground or with a sign. One out of every six accessible spaces must be van accessible. To be van accessible a stall must be at least 96” wide, have at least 96” access aisle to accommodate a wheel chair lift, and have a minimum clearance of 98”. The length of the parking stall in both situations must match the adjacent parking stall.
Designated Reserve & Service Vehicle Spaces The “Discovery Phase” determined designated reserve and service vehicle spaces are an important part of UMD’s functionality. However, the study did not include utilization counts for these spaces. The following provides general guidance and direction regarding these spaces.
Designated Reserve Designated Reserve spaces are available for official UMD vehicles and select senior UMD administrators. There are approximately 141 designated reserve spaces. The majority of these spaces are located in the Gold Lots and the Darland Lot.
Accessible parking spaces are required to be located on the shortest accessible route to travel to an accessible facility entrance. Based on MN Accessibility code, an accessible route cannot have more than a 1:12 slope in the direction of travel. Routes should be 3 feet wide, without curbs or stairs, and made of a firm, slip-resistant surface. All accessible parking spaces, aisles, and routes should be maintained in good repair and kept clear of snow, ice, or fallen leaf build-up. It will be important to incorporate these requirements into future parking lot designs to ensure that the university remains accessible to students, faculty, staff, and visitors.
The Listening Sessions did not identify any issues regarding these spaces. Furthermore, the designated reserve spaces account for a small portion of UMD’s overall parking supply. Based on these findings, the study is not recommending any changes to the designated reserve spaces.
Service Vehicles The most significant factors when determining service vehicle parking is safety and usability. Safety of service vehicle parking spaces can be influenced in two ways. First, the spaces should be designed to reduce the risk of crashes. Spaces tend to have more crashes when service vehicles are required to back up, have operators walk around the back of the vehicle to access it, or are placed in high traffic areas. Second, safety can be improved by
The study did not identify any areas of concern regarding accessible spaces. It is recommended a more comprehensive accessibility study is prepared to determine the appropriate locations for accessible spaces. The study should also evaluate the accessible routes between accessible spaces and campus facilities/buildings.
43
reducing conflict along the route to the parking space. Service vehicle parking should be located where they can be accessed by vehicles with minimal conflict with pedestrians, bikes or other vehicles. Providing a detailed map of preferred service vehicle routes can reduce this conflict among different user groups and provide the best route to access service vehicle parking. Potential areas of concern include the service vehicle spaces along Kirby Drive near Kirby Student Center. General observations in the field identified this area as having high volumes of pedestrians, transit and motorcycle/mobile parking, which may cause safety conflicts amongst service vehicles.
the service vehicle parking and for what functions will help determine these policies. Identifying ideal locations that promote safety, as well as clearly identifying parking policies will ensure service vehicles can adequately operate on campus.
Cost Internal costs are associated with this strategy.
The usability of service vehicle parking also plays an important role in encouraging utilization of the provided spaces. Service vehicle spaces need to be conveniently located to be useful to users. Direct access to the appropriate building entrance adds to the convenience and reduces potential conflicts. Policies are also important to assure appropriate use. Policies should address time limits for parking, eligible users and potential vehicle permit requirements. Understanding who will be using
44
Long-Term Parking Strategies (5+ years)
• Proximity to Events - Each site was evaluated to determine their opportunity to serve event parking. • Access/Circulation - Each site was evaluated to determine if the existing roadway network could provide adequate access and would not negatively impact traffic circulation.
UMD will need to add additional parking if the short-term parking strategies are not realized. The long-term parking strategies explore the feasibility of adding additional capacity by building a surface parking lot or parking structure. The sites chosen for evaluation are referred to as “search areas” and are depicted in Figure 7. The evaluation process was qualitative in nature; however, this process helped the PMT determine the feasibility of a site and their “fatal flaws.” Some examples of “fatal flaws” include the removal of existing green space, play fields, or the potential to impact visual cues and gateways into campus. The criteria used for the evaluation process included:
• Pedestrian Connections - Each site was evaluated to determine if pedestrians would have a safe route to campus, without having to cross any major barriers (e.g., roadways). • Future Gateway - Each site was evaluated to determine any implications to the proposed Gateways identified in the 2013 UMD Campus Master Plan. • Environmental Constraints - Each site was evaluated to determine if there were any known environmental constraints (e.g., proximity to the designated trout stream and stormwater ponds).
• Ownership – Each site was evaluated to determine its ownership. In general, a site owned by UMD would not require any right-of-way acquisition.
• Utilization – Each site was evaluated to determine if it is located in proximity to a large surface lot experiencing heavy utilization.
• Existing Land Use – Each site was evaluated to determine if a new parking facility would impact an existing land use.
• Cost – Each site was evaluated to determine the construction cost and funding magnitude.
• 2013 - UMD Campus Master Plan – Each site was evaluated to determine its alignment with the 2013 UMD Campus Master Plan.
45
Surface Parking Lots
principles emphasize the preservation of open space, and minimizing impacts to the campus aesthetics and character. Adhering to these principles are difficult to achieve with all six search areas. UMD should focus on the reduction of parking by achieving the short-term parking strategies. If a new surface parking lot is desired, UMD should focus on the “North St. Marie” search area. This site provides the most benefit by preserving the campus footprint, aesthetics, and character. However, the location is in the White Lots that are already underutilized.
The evaluation process determined six search areas (see Figure 7) for future surface parking. Findings from the evaluation process are documented in Table 12, which highlights the benefits and challenges of each site. Overall, there are only a few opportunities to accommodate a new surface parking lot (400+ spaces). The most viable options include the “North St. Marie” and “University Drive” search areas. Both sites provide the most flexibility in meeting long-term parking needs; however, each site does come with its own challenges. For example, the “University Drive” site will require the reprogramming of ball fields and will need to be coordinated with the future University Drive extension (as identified in the 2013 UMD Campus Master Plan). The “North St. Marie” site is the most desirable location, but will require additional land acquisition.
Cost The cost for a permanent paved lot would be between $2,800 and $5,800 per stall, which includes standards for addressing storm water treatment needs (see Attachment A). Cost savings are achieved when implementing a larger lot. A 400 space surface lot would cost between approximately $1,120,000 and $2,320,00.
It is important to recognize the study’s guiding principles before pursuing a site for surface parking. The guiding Table 12 - Sur face Parking Search Areas
Search Area
Benefits
Challenges
Recommendation
• Requires the reprogramming of an athletic field • Does not provide significant Junction • Can accommodate a large surface lot • Provides potential opportunities to expand/ • Potential wayfinding/distance issues between benefits to carry forward as a Avenue Lot consolidate smaller lots in the area the search area and campus facilities recommended site
Kirby Drive • Can accommodate a large surface lot • Vacant Lot
• A parking lot will negatively impact the visual cues and gateway into campus
• Does not provide significant benefits to carry forward as a recommended site
• Vacant • Located within proximity to the new CAMS building
• A parking lot will negatively impact the visual cues and gateway into campus • Located in an area identified for future roadway improvements/alignments • Requires the reprogramming of a recreational field
• Potential site for interim parking (see short-term strategies), but should not be used as a longterm solution
• Can accommodate a large surface lot • Located within proximity to major event centers and the new CAMS building
• Requires the reprogramming of multiple play fields • Does not provide direct access from a major roadway, and may pose circulation issues
• Provides some benefits; however, traffic circulation and the reprogramming or play fields will need to be investigated in greater detail
Stadium Lot
• Can be expanded to accommodate 150 spaces • Expands an existing parking lot (Maroon Lot M2) • Located in proximity to a large lot experiencing heavy utilization
• Located within proximity of a designated trout stream
• Carries forward as a potential site in meeting long-term parking needs.
North St. Marie
• Identified as a “Future Parking Structure” in • Parcels are owned by UMD and private property • Carries forward as a potential the 2013 Campus Master Plan owners site in meeting long-term • Located in proximity to a large lot experi• Higher cost associated with land acquisition parking needs encing heavy utilization • No utilities • Located across St. Marie Street from the University
Chester Park Lot
University Drive Lot
46
Parking Structures
parking on the south end of campus would help balance the overall supply. More importantly, the “College Street” sites would offer convenient parking for visitors accessing CAMS, the Planetarium, and Kirby Plaza. Between the two “College Street” locations, “College II” offers the most benefits at this time. For example, it is unclear on how a 120,000 sq. ft. medical facility/building would be situated and designed within the “College I” search area. Future planning efforts for this building would need to occur before determining the feasibility of placing a parking structure within the “College Street I” location.
The evaluation process determined five search areas (see Figure 7) for future parking structures. Findings from the evaluation process are documented in Table 13, which highlights the benefits and challenges of each site. In general, a parking structure would provide the most benefit from a land use perspective. The footprint for a parking structure would be less intrusive to an already land constrained environment. The recommended sites for UMD’s consideration include the “College Street I and II” search areas. The “College Street” search areas provide the most benefit by serving the southern end of campus. This portion of campus provides approximately 38% of the overall parking supply (excluding on-street, metered, and private) (see Figure 11). Parking in this area may be reduced by 10% over the long-term with new facilities and the realignment of College Street. Providing additional
Finally, the “Campus Center” search area is another alternative to consider, but comes with a larger price tag. The proposed structure would be located underground, as identified in the 2013 Campus Master Plan. The benefits include a structure that is centrally located, offers additional parking for events, and direct access to the campus
Table 13 : Structured Parking Search Areas
Search Area
Benefits
• Identified in the 2013 Campus Master Plan as a “Future Structured Parking” College • Accommodates future CAMS parking needs Street Ramp • Helps balance the overall parking supply in I the north and southern portions of campus
Challenges
Recommendation
• Potential access and traffic circulation issues • A larger ramp is required to replace existing parking • Unknown foot print for a future medical facility/building
• Does not provide significant benefits to carry forward as a recommended site until the foot print of a new medical facility/building is determined
• Potential access and traffic circulation
• Carries forward as a potential site in meeting long-term parking needs.
• Provides direct access to the core of campus • Higher cost associated with an underCampus ground structure Center Ramp • Visual impacts will be minimized with parking located underground • Potential access and traffic circulation (under• Located in proximity to large events issues ground
• Carries forward as a potential site in meeting long-term parking needs. However, the project cost is significantly higher than other sites
• Provides flexibility to be integrated with the
College proposed CAMS building footprint issues Street Ramp • Accommodates future CAMS parking needs • A larger ramp will be required to replace • Helps balance the overall parking supply in the existing surface lot II the north and southern portions of campus
structure) Stadium Ramp South St. Marie Ramp North St. Marie Ramp
• Located adjacent to large events (e.g., • Located within proximity of a designated • Carries forward as a potential football) trout stream site, but is less desirable over • Provides direct access to the core of campus • Limits opportunities for future building the College Street I and II expansion and an amphitheater as idenramps. tified in the campus master plan • Provides an opportunity to consolidate large • Potential access and traffic circulation surface lots issues
• Does not provide significant benefits to carry forward as a recommended site
• Identified as a “Future Parking Structure” in the 2013 Campus Master Plan • Located in proximity to a large lot experiencing heavy utilization
• Consider the site as an option if future parking demand exceeds long-term projections outside the study’s time horizon
• Parcels are owned by UMD and private property owners • Higher cost associated with land acquisition • No utilities
47
core. An underground parking structure offers other benefits aesthetically by placing in some cases, a less desired land use out of sight. Additional costs will include the realignment of University Drive and wayfinding measures to direct visitors to the underground parking structure. The realignment also supports the 2013 Campus Master Plan in creating more a prominent entrance (gateway) from College Street into campus via University Drive.
strategy of expanding Maroon Lot M2 by 100+ spaces. If this strategy is not implemented, the size of the parking structure increases from 400 to 500 spaces. Secondly, it is important to recognize the parking structure locations are being proposed on existing surface lots. Thus, the cost estimates include additional parking spaces to replace those that are being impacted. Table 14 provides a summary of the parking structure size and cost estimates for each location. Additional information regarding the cost estimates can be found in Attachment A.
Cost Planning level cost estimates were prepared for the North St. Marie Street Ramp, Campus Center Ramp, College Street II Ramp, and Stadium Ramp (see Attachment A). The cost estimates take into consideration two factors. First, the cost estimates differentiate the need for a 400 or 500 parking stall ramp. This assumes the short-term
There are also a number of other costs associated with the construction of a parking structure. UMD will need to consider annual operation and maintenance expenses. Table 15 provides general cost estimates associated with a new parking structure. This estimate assumes operation, maintenance, lighting, and general expenses.
Table 14 : Structured Parking Cost Estimates (Planning Estimates)
Size without Maroon Lot M2 Expansion/Cost
Size with Maroon Lot M2 Expansion/Cost
North St. Marie Street Ramp
520 / $12,480,000
620 / $14,880,000
Solon Campus Center Ramp (underground structure)
490 / $18,360,000
590 / $22,460,000
College Street II Ramp
600 / $14,400,000
700 / $16,800,000
Stadium Ramp
640 / $15,360,000
740 / $17,760,000
Search Area
Table 15: Annual Expenses (Planning Estimates)
Item
Freestanding Parking Structure Per Space
400 Spaces
500 Spaces
700 Spaces
800 Spaces
Annual Operation & Maintenance Expenses
$250
$100,000
$125,000
$150,000
$175,000
Funding
A state bond can vary in terms (ten year or twenty year) and stipulations. In this case, it is assumed a state bond will be paid by the revenue generated from the parking user.
A parking structure will require significant resources to implement. Each of the search areas come with their own price tag, which vary between $12 and $20 million for construction. A potential funding source for consideration is State Bonding. Typically every year, the State Legislature approves a state bonding bill. The bill provides state funding for major investments that have a regional or statewide benefit. The bonding bill is comprehensive and funds projects as diverse as higher education facilities (e.g., parking structures), natural resource programs, and a wide variety of local special need projects.
A detailed financial analysis and plan will need to be prepared if UMD pursues a parking structure.
48
Figure 11: Parking Supply by Zones
Parking Supply by Zones Figure 11
Legend Existing Parking (exclueds on-street, private and metered parking)
North Zone 62% of parking is located in the northern portion of campus. Parking in this area may account for 72% of the overall parking supply, if parking is reduced over the long-term.
Document Path: J:\Maps\8781\mxd\Zones.mxd
South Zone
- 250 parking spaces (long-term assumption)
North Zone
38% of parking is located in the southern portion of campus.
South Zone
Parking in this area may account for 28% of the overall parking supply, if parking is reduced over the long-term.
- 200 parking spaces (short-term assumption) - 100 parking spaces (short-term assumption)
[
Recommendation Summary Over time, UMD will need to balance the parking strategies and solutions to address anticipated parking needs. It is encouraged that UMD first explores the TDM strategies and the use of off-site parking facilities before pursuing strategies that will require significant investments and resources. More importantly, UMD will need to reevaluate the parking study every few years to determine if the development assumptions are still relevant. It is also suggested the study is updated one year after CAMS construction. Updating the study will require regular utilization counts. This data provides a wealth of information and serves as a backbone for the various technical elements of the plan. More importantly, regular utilization counts will help monitor the success of implementing various strategies and their influence on reducing parking demand.
50
THIS PAGE IS INTENTIONALLY LEFT BLANK
Attachment A – Cost Estimates (prepared by LHB)
52
UMD Parking Study Approximate Construction Values Comparison Assumptions: Ramp size is based on efficiency of floor plates roughly 190’ x 270’+/ Exterior image would meet Duluth UDC Standards (this is not required but is being used as a definition appearance) Structures, with the exception of the Campus Center structure, would be open structures to reduce mechanical costs for construction and operation Costs are based on construction season 2016; inflation will need to be added to account for future planning time frames Estimates are based on costs of previous ramp projects in Duluth, adjusted with calculated escalation of values. Base assumed values are $24,000/stall roughly $63/SF and $380 SF/Stall Soft costs are anticipated to be approximately 20% of the construction cost. The costs below are componentized to allow a better apples to apples comparison and a menu of options / upgrades Annual maintenance costs (exclusive of snow removal) are estimated at $60 - $95 /stall for an open ramp, and $16 - $20 / stall for a paved lot. Assumes a base net of 400 spaces for all structures. North St Marie Street This site has a partial impact to existing parking to the amount of 120 spaces. This site does warrant the discussion of a skywalk or walkway over St. Marie Street to accommodate the amount of foot traffic in a concentrated location and improve the convenience of the ramp. Final ramp location, property ownership at the time of planning and orientation/size will dictate the amount of property acquisition and associated cost that is required. Primary benefits are the minimal impact to existing parking (lowest construction cost), and no impact to the buildable footprint of the campus proper.
Ramp X spaces x $24,000 = Estimated Soft Cost (20%) = Total Estimated Cost =
520 Capacity
620 Capacity
$12,480,000 $ 2,496,000 $14,976,000
$14,880,000 $ 2,976,000 $17,856,000
Misc. Items: Skywalk / Covered Walkway = $1,000,000 - $3,500,000 Property Acquisition = unknown based on what may be purchased prior to the project start
Page: 2 Date: December 2015
Solon Campus Center The ramp at this site would be an underground ramp starting at the current elevation of the Solon Campus Center entry and excavate down. Some existing metered parking will be displaced roughly 90 spaces. The top deck of this ramp is expected to improve the entry sequence to Solon with landscaping and greenspace. Because it is underground, it will require ventilation and fire suppression. Primary benefits include central location to campus, administration, Kirby Student Center (ballroom), Tweed and hidden underground protected structure. 490 Capacity
590 Capacity
Ramp X spaces x $24,000 = Mechanical Requirements = Excavation =
$11,760,000 $ 1,800,000 $ 4,800,000
$14,160,000 $ 2,300,000 $ 6,000,000
Construction Total = Estimated Soft Cost = Total Estimated Cost =
$18,360,000 $ 3,672,000 $22,032,000
$22,460,000 $ 4,492,000 $26,952,000
Misc. Items: Top Deck Improvements =
$2,100,000
College Street This site fully impacts existing parking in the amount of 200 spaces. This site does warrant the discussion of a skywalk or walkway connected to the new science or medical structures to improve the convenience of the ramp. Final ramp location and orientation at the time of planning will dictate the cost of the connecting link. Primary benefits are due to location; a direct enclosed connection to the new science/engineering structure planned, and direct access to College Street. 600 Capacity
700 Capacity
Ramp = X spaces x $24,000 = Estimated Soft Cost (20%) = Total Estimated Cost =
$14,400,000 $ 2,880,000 $17,280,000
$16,800,000 $ 3,360,000 $20,160,000
Misc. Items: Skywalk / Covered Walkway =
$750,000 - $2,000,000
Page: 3 Date: December 2015
Stadium This site fully impacts existing parking at 197 spaces. The recommendation for this location would be to include bus circulation and parking on grade beneath, which would require the equivalent of another 40 spaces. This site does not currently warrant the discussion of a skywalk or walkway. The primary benefits are its proximity to large venue events, center of campus location, and clean vehicular access from off campus.
Ramp = X spaces x $24,000 = Estimated Soft Cost (20%) = Total Estimated Cost =
640 Capacity
740 Capacity
$15,360,000 $ 3,072,000 $18,432,000
$17,760,000 $ 3,552,000 $21,312,000
Other Construction Value Comparisons Temporary gravel lot for 320 spaces returned to natural turf would be approximately $700 - $850,000. Temporary gravel lot for 320 spaces to be replaced with artificial turf would be $950 - $1,100,000 for the temporary parking and finished artificial field. Permanent paved lot based on past UMD standards including storm water treatment would be $5,800 / stall at 100 or less capacity or $2,800 / stall for more than 200 stalls. (These values include storm water requirements but not wetland mitigation at ($600/stall based on $/sf of a stall)
R:\15Proj\150066\400 Design\406 Reports\150066 20150915 Parking Study Prelim Report.docx
Appendix A – Detailed Parking Inventory
56
February 2015 Campus Parking Space Inventory GOLD LOTS
Lot A Lot C Lot D Health Services Lot Lot R2
TOTAL
MAROON LOTS
Lot B Lot E Lot M1 Lot M2 Lot N1 Lot N2 Lot V Lot V2 Lund Lot Lot R1 Lot R3
TOTAL
OFF CAMPUS LOTS
NRRI (Natural Resources Research) Lot Y (Research Lab Bldg)
Color Permit Spaces Daily Pay Spaces Designated Reserve (DR) 265 0 10 128 0 4 86 0 6 5 0 8 14 0 9
Meters 22 22 0 5 0
TIME & METER #'S 4 Hours A #1-22 4 Hours C #1-22 2 Hours LSH #7-12 -
Handicap (HC) HC/DR 2 0 4 0 0 0 2 0 4 0
HC Access Service Vehicle 1 6 2 0 0 0 0 2 2 1
Total Spaces 306 160 92 22 30 610
Motorcycle no yes no no no
Color Permit Spaces Daily Pay Spaces Designated Reserve (DR) 570 0 0 256 0 0 84 0 0 37 0 0 9 0 0 9 0 0 64 0 0 65 0 0 34 0 15 24 0 0 34 0 5
Meters 38 14 0 0 0 0 0 0 0 0 11
TIME & METER #'S 4 Hours B #1-38 2 Hours E #7-20 2 Hours R #1-11
Handicap (HC) HC/DR 0 0 0 5 3 0 0 0 0 0 0 0 0 0 2 0 0 0 0 0 0 0
HC Access Service Vehicle 0 0 0 0 1 1 0 0 0 0 0 0 0 0 0 0 0 6 0 0 0 0
Total Spaces 608 275 89 37 9 9 64 67 55 24 50 1287
Motorcycle yes yes no no no no no yes no no yes
Color Permit Spaces Daily Pay Spaces Designated Reserve (DR) 190 0 0 48 0 0
Meters 0 0
TIME & METER #'S -
Handicap (HC) HC/DR 5 0 1 0
HC Access Service Vehicle 2 2 0 0
Total Spaces 199 49 248
Motorcycle no no
Color Permit Spaces Daily Pay Spaces Designated Reserve (DR) 193 0 0 100 0 0 22 0 0 60 0 0 53 0 0 48 0 0 13 0 0 56 0 0
Meters 4 0 0 0 0 0 0 0
TIME & METER #'S -
Handicap (HC) HC/DR 0 0 0 0 0 0 0 0 0 0 0 0 0 0 0 0
HC Access Service Vehicle 0 0 0 0 0 0 0 0 0 0 0 0 0 0 0 0
Total Spaces 197 100 22 60 53 48 13 56 549
Motorcycle no no no no no no no no
Meters
TIME & METER #'S
Handicap (HC) HC/DR
HC Access Service Vehicle
Total Spaces
Motorcycle
498
1186
238 TOTAL * Off Campus Lots were not included as part of the study
WHITE LOTS
Lot W Lot S1 Lot S2 Lot S3 Lot S4 Lot S5 Lot S6 Lot S7
TOTAL
545
Gold/Maroon/White SubtotaColor Permit Spaces TOTAL
METER SPACES
TOTAL
GREEN LOTS
PAYLOT GRAND TOTAL
0
0
0
37
20
0
0
Daily Pay Spaces Designated Reserve (DR)
0
57
Color Permit Spaces Daily Pay Spaces Designated Reserve (DR) 0 0 1 0 0 0 0 0 42 0 0 0 0 0 6 0 0 0 0 0 11 0 0 8 0 0 2 0 0 0 0 0 3 0 0 0 0 0 0 0 0 2 0 0 3
Univ Drive/School of Med Univ Drive/DAdB Darland (DAdB) Lot Lot F Lot H Lot K Kirby Drive/Kirby Plaza Kirby Drive/RHDC RHDC Tunnel/Loading Dock Kirby Drive/Swenson Science Bldg Kirby Drive/Heller Hall Library Lot Ordean Court Sports & Health Bldg Solon Campus Center Lot
Heaney Service Center Lake Superior Hall Lot J2 Lot J3 Lot L1 Lot L2 Lot L3 Lot Q1 Lot Q2 Lot Q3 Lot Q4 Lot U Lot T1 Lot T2 Lot T3
2467
0
TOTAL
TOTAL
0
0
78
GRAND TOTAL CHECK:
63
0
4
116
Meters 7 19 0 25 9 29 3 0 0 14 2 13 0 0 66
187
12
5
6
0
23
TIME & METER #'S 2 Hours UD #1-7 2 Hours UD #9-28 4 Hours F #1-28 4 Hours H #3-11 2 Hours K #1-29 4 Hours KD #1-3 4 Hours KD #10-23 2 Hours KD #5-6 2 Hours L #1-13 1 Hour CC #19-30 2 Hour CC #31-56 4 Hour CC #1-8 4 Hour CC #58-77
0
5
0
0
5
Handicap (HC) HC/DR 0 0 4 0 0 0 1 0 4 5 0 0 0 0 3 0 0 0 2 0 0 0 6 0 2 0 0 0 4 7
26
12
5
1
2
0
8
9
7
2
0
18
HC Access Service Vehicle 0 1 4 0 0 3 1 0 3 2 0 1 0 2 1 0 0 0 1 2 0 2 3 2 0 3 0 1 2 2
15
21
2694
Total Spaces 9 27 45 27 29 30 16 12 2 19 7 24 5 3 84
Motorcycle no no no no no no no yes no no no no no no no
339
Color Permit Spaces Daily Pay Spaces Designated Reserve (DR) 0 0 0 0 0 0 12 0 6 215 0 0 82 0 0 26 0 0 97 0 0 89 0 0 28 0 0 19 0 0 27 0 0 220 0 0 107 0 0 139 0 0 35 0 0
Meters 5 6 0 0 0 0 0 0 0 0 0 0 0 4 0
TIME & METER #'S 4 Hours HSC #1-5 2 Hours LSH #1-6 4 Hours T #1-4 -
Handicap (HC) HC/DR 1 0 1 0 2 0 0 0 3 0 2 0 0 0 1 0 1 0 0 0 2 0 0 0 3 0 1 0 0 0
HC Access Service Vehicle 1 1 1 2 1 0 0 0 2 0 0 1 0 0 1 0 1 0 0 0 1 1 0 0 2 0 0 0 0 1
Total Spaces 8 10 21 215 87 29 97 91 30 19 31 220 112 144 36 1150
Motorcycle no no no no yes no no yes no no no no yes no no
Color Permit Spaces Daily Pay Spaces Designated Reserve (DR)
Meters
TIME & METER #'S
Handicap (HC) HC/DR
HC Access Service Vehicle
Total Spaces
Motorcycle
0
-
340
-
Meters
TIME & METER #'S
Total Spaces
Motorcycle
1096
0
0
340
6
0
Color Permit Spaces Daily Pay Spaces Designated Reserve (DR) TOTAL
49
3563
340
141
15
318
17
0
0
0
Handicap (HC) HC/DR
66
17
10
0
6
0
HC Access Service Vehicle
33
45
4523
4523
Appendix B – Traffic Analysis Report
58
INTERSECTION CONTROL EVALUATION
College St (MSA 155) at Junction Ave (MSA 156) and 19th Ave E (MSA 154) Duluth, St. Louis County, Minnesota
March 22, 2013
SRF NO. 01207889
INTRODUCTION The Arrowhead Regional Development Commission/Duluth-Superior Metropolitan Interstate Council (ARDC/MIC), in partnership with St. Louis County, the City of Duluth, and the City of Hermantown, are leading an Intersection Control Evaluation (ICE) study to evaluate the College Street (MSA 155) at Junction Avenue (MSA 156) and 19th Ave (MSA 154) intersection in Duluth, Minnesota (see Figure 1). The study intersection has been observed to be congested while the university is in session, including a high volume of pedestrian and bicycle traffic, caused by its proximity to the University of Minnesota – Duluth. Also, this intersection has access points close to the intersection including a fire station and the Afterno Home. Study Goals The following summarizes the goals of the study with respect to existing and future conditions: •
Determine the most appropriate form of intersection control to optimize both traffic operations and safety.
•
Improve the operations and safety for multi-modal users such as transit buses, pedestrians and bicyclists.
Study Process
1. Data Collection
Phase I - Scoping
2. Traffic Forecasts 3. Existing Conditions 4. 2035 No-Build Conditions 5. Concept Development 6. Preliminary Screening 7. Prospective Alternative(s)
Phase II – Alternative Selection
The following summarizes the overall study process, which consists of a two-phase approach:
1. Site Specific Considerations 2. Prospective Alternative(s) 3. Detailed Operations Analysis 4. Comparison of Alternatives 5. Recommendations
This report documents the two-phase approach of the ICE study and provides recommendations for potential operational, safety, and multi-modal user improvements at the study intersection.
College Street at Junction Avenue and 19th Avenue E March 22, 2013
Intersection Control Evaluation Page 1
North NORTH
H:\Projects\7889\TS\Figures\03 College-Junction-19th\Figure 1 Study Intersection.cdr
Study Intersection
Study Intersection Intersection Control Evaluation Planning Study - College St / Junction Ave / 19th Ave E 001207889 Oct 2012
Arrowhead Regional Development Commission / Duluth-Superior Metropolitan Interstate Council
Figure 1
EXISTING YEAR 2012 CONDITIONS Existing year 2012 a.m. peak and p.m. peak hour turning movement volumes and daily approach volumes were collected by SRF Consulting Group in September and October of 2012. Intersection crash history was collected for a period of ten years (2002-2011) using the Minnesota Crash Mapping Analysis Tool (MnCMAT). The following summarizes the existing year 2012 conditions at the study intersection (see Figure 2): •
The study intersection is currently traffic signal controlled with the northbound and southbound approaches operating with split phasing.
•
College Street is a four-lane undivided urban roadway that is functionally classified as a minor arterial west of the study intersection. College Street is a two-lane undivided urban roadway that is functionally classified as a minor arterial east of the study intersection. Junction Avenue is a two-lane undivided urban roadway that is functionally classified as an urban collector. 19th Avenue is a two-lane undivided urban roadway that is functionally classified as an urban collector. The posted speed limit on all approaches is 30 mph. All approaches are designated on-street bicycle routes.
•
There is an existing signalized intersection less than a mile north of the study intersection at Carver Avenue, and an existing signalized intersection a half mile west at Kenwood Avenue.
•
Adjacent land uses consist of the University of Minnesota – Duluth and a fire station in the northeast quadrant, the Aftenro Home which is an assisted living home in the southwest quadrant, medium density residential in the northwest quadrant, and high density residential in the southeast quadrant.
•
The study intersection currently operates at overall acceptable levels-of-service (see Appendix A): o LOS C (26.2 seconds of delay per vehicle) during the a.m. peak hour. o LOS C (34.2 seconds of delay per vehicle) during the p.m. peak hour.
•
Intersection crash history indicates 40 recorded crashes (see Appendix A) at the study intersection, 19 of which were rear end crashes, from 2002 through 2011. The calculated crash rate is 0.9 per million entering vehicles (MEV), which is higher than the expected crash rate of 0.6 per MEV for this type of facility.
•
All-way stop control is warranted at the study intersection under year 2012 volume conditions but traffic signal control is not warranted assuming more than one lane of approach on all approaches (see Appendix A).
College Street at Junction Avenue and 19th Avenue E March 22, 2013
Intersection Control Evaluation Page 3
North North NORTH NORTH
30 MPH Urban Collector 34 (19) 157 (270) 8 (45)
College St
) (33 ) 65 (63 ) 6 (13 137 19t
ve hA
N
124
(113) 139 (167) 252 (123) 38
4,790
(MSA 156)
Junction Ave
45 (181) 19 (69) 7 (36)
Existing Signal 0.875 mile North at Carver Ave
30 MPH Minor Arterial 30 MPH Minor Arterial
H:\Projects\7889\TS\Figures\03 College-Junction-19th\Figure 2 Existing Conditions.cdr
9,670 5,220
(MSA 155)
(MSA 155)
Existing Signal 0.5 mile West at Kenwood Ave 4,890
30 MPH Urban Collector
LEGEND
(M SA
Existing Year 2012 Conditions Intersection Control Evaluation Planning Study - College St / Junction Ave / 19th Ave E 001207889 Mar 2013
Arrowhead Regional Development Commission / Duluth-Superior Metropolitan Interstate Council
15 4)
XX (XX) X,XXX XX (XX) X,XXX
----
A.M. Peak Hour Volume P.M. Peak Hour Volume LEGEND Existing 2012 Daily Volumes A.M. PeakStop HourControl Volume Two-Way P.M. Peak Hour Volume All-Way Stop Control Daily Volumes Traffic Signal Control
Figure 2
TRAFFIC FORECASTS Year 2035 daily traffic forecasts and peak hour turning movement forecasts were developed at the study intersection (see Figure 3). Details of the forecasting process can be found in Appendix B. Yearly growth percentages for the eastbound and westbound mainline approaches were calculated to be 1.51 and 0.94 percent, respectively. Yearly growth percentages for the northbound and southbound minor approaches were calculated to be 0.41 and 0.63 percent, respectively.
YEAR 2035 NO-BUILD CONDITIONS The year 2035 no-build condition evaluates the study intersection assuming existing intersection geometry and control with future year 2035 volumes to determine the expected intersection operations if no improvements are implemented. The following summarizes the year 2035 no-build conditions at the study intersection: •
The study intersection is expected to operate at acceptable levels-of service; however, long queues are anticipated and there is little reserve capacity without geometric improvements or modifications to the signal phasing (see Appendix B): o LOS C (31.2 seconds of delay per vehicle) during the a.m. peak hour. o LOS D (48.3 seconds of delay per vehicle) during the p.m. peak hour.
•
Based on expected volume growth, the operations of the existing geometry and intersection control are expected to worsen with long approaches queues and the northbound and southbound approaches will operate near capacity in 10 to 15 years.
•
All-way stop control is warranted under future year 2035 volume conditions but traffic signal control is not warranted assuming more than one lane of approach on all approaches (see Appendix B).
College Street at Junction Avenue and 19th Avenue E March 22, 2013
Intersection Control Evaluation Page 5
THIS PAGE IS INTENTIONALLY LEFT BLANK
North North
College St
) (35 ) 65 (65 ) 5 (17 140 19t
ve hA
N
175
(145) 190 (225) 335 (150) 50
5,500
(MSA 156)
Junction Ave
65 (250) 20 (70) 10 (35)
NORTH NORTH
35 (20) 230 (395) 10 (45)
13,700 6,500
H:\Projects\7889\TS\Figures\03 College-Junction-19th\Figure 3 2035 Conditions.cdr
(MSA 155)
(MSA 155)
5,400
(M SA
Year 2035 No-Build Conditions Intersection Control Evaluation Planning Study - College St / Junction Ave / 19th Ave E 001207889 Feb 2013
Arrowhead Regional Development Commission / Duluth-Superior Metropolitan Interstate Council
LEGEND
15 4)
XX - A.M. Peak Hour Volume (XX) - P.M. Peak Hour Volume X,XXX - Daily Volumes
Figure 3
KEY FINDINGS As previously noted, the operations of the existing geometry and intersection control are expected to worsen long-term without improvements. Also, the intersections currently has an above average number of crashes and of the crashes, almost half are rear end crashes. Therefore, the concepts and alternatives evaluated are related to geometric and intersection control improvements to improve operations and safety. The following summarizes the Phase I – Scoping process (see Appendix C) and the Phase II – Alternative Selection process (see Appendix D) completed to assist in achieving the aforementioned study goals: •
All-way Stop Control All-way stop control concept, which would include two lanes on all approaches and a realignment of both the northbound and southbound approaches, is expected to provide long-term acceptable operations. However, because of the need for two lanes of approach, lane drops would be needed downstream of the intersection on the north, south and east legs of the intersection. This is not a desirable condition when other forms of control provide acceptable operations. Therefore, it is not a preferred long-term solution at the study intersection.
•
Roundabout Control A single-lane roundabout is expected to provide long-term acceptable operations. Details of the VISSIM analysis are shown in Appendix E. Access modifications to the Afterno Home and fire station may be needed to maintain full access to the sites. The roundabout splitter islands need to be of sufficient length to provide safe and efficient operations of the roundabout. As such, the splitter islands could impact these accesses. Single-lane roundabouts are considered one of the safest intersection control alternatives and often have better overall safety than the comparable traffic signal controlled intersections: o Roundabouts have fewer vehicular conflict points than other forms of at-grade intersection control. More importantly, roundabouts have no left-turn conflicts. o Roundabouts eliminate right-angle crashes. o Roundabouts use geometry to reduce vehicular speeds at an intersection rather than traffic control devices. This reduces the severity of crashes. There are no nationally accepted warrants for the installation of roundabouts. Roundabouts are both a roadway feature and a traffic control device. Roadways are typically designed to accommodate traffic volumes for 20 years into the future; however, traffic control devices are typically installed when the need arises. One of the considerations to justify the installation of a roundabout is whether a traffic signal is warranted. Generally, a roundabout is justified if a traffic signal is warranted.
College Street at Junction Avenue and 19th Avenue E March 22, 2013
Intersection Control Evaluation Page 7
•
Traffic Signal Control Traffic signal control, which includes exclusive left-turn lanes on all approaches and realignment of both northbound and southbound approaches, is expected to provide acceptable long-term operations. Details of the Synchro/SimTraffic analysis are shown in Appendix E. However, rear end crashes are already one of the predominate types of crashes at the study intersection and rear end crashes are typical with traffic signals. Also, traffic signal control is not warranted under future year 2035 volume conditions. Therefore, traffic signal control is not the preferred long-term solution at the study intersection.
•
Alternative Intersection Concepts Because of their excessive right-of-way impacts, alternative intersection concepts were not considered at the study intersection.
OTHER CONSIDERATIONS Pedestrians and Bicycles All legs of the study intersection are designated on-street bicycle routes. Single-lane roundabouts are one of the safest at-grade intersections alternatives for pedestrians and bicyclists because of their low speed design. Roundabouts accommodate pedestrians by having pedestrians cross only one direction of traffic at a time on the leg where the crossing is provided. Also, a pedestrian refuge is provided in the splitter island. Transportation System A high degree of mobility and safety is best achieved when driver expectations are met. Converting the existing traffic signal to a roundabout would meet driver expectations because drivers are currently used to having to slow down or stop at the study intersection. Although all vehicles will experience some delay under roundabout control, a roundabout will typically operate with less delay than a signalized intersection when sufficient roundabout capacity is provided.
College Street at Junction Avenue and 19th Avenue E March 22, 2013
Intersection Control Evaluation Page 8
RECOMMENDATIONS Based on the results of this intersection control evaluation, single-lane roundabout control is recommended under year of opening and design year 2035 conditions at the College Street (MSA 155) at Junction Avenue (MSA 156) and 19th Ave (MSA 154) intersection in Duluth, St. Louis County, Minnesota. Single-lane roundabouts are considered one of the safest intersection control alternatives and often have better overall safety than the comparable traffic signal controlled intersections. Because of the safety benefits of roundabouts (reduced conflict points, eliminates right-angle crashes, lower speeds, etc.), a roundabout is the preferred intersection control alternative when compared to the traffic signal control alternative. The single-lane roundabout can also provide a “gateway” to aesthetically enhance the entrance to the adjacent neighborhoods and to the University of Minnesota – Duluth campus. Access modifications to the Afterno Home and fire station may be needed to maintain full access to the sites. The roundabout splitter islands need to be of sufficient length to provide safe and efficient operations of the roundabout. As such, the splitter islands could impact these accesses. As a relatively new form of traffic control in the Twin Ports, modern roundabout education will be critical so users can learn more about the inherent benefits and how to properly navigate them.
College Street at Junction Avenue and 19th Avenue E March 22, 2013
Intersection Control Evaluation Page 9
APPENDIX A
Existing Year 2012 Conditions
Intersection Control Evaluation College Street at Junction Avenue and 19th Avenue E
Timings 1: College St & Junction Ave
Lane Group Lane Configurations Volume (vph) Turn Type Protected Phases Permitted Phases Detector Phase Switch Phase Minimum Initial (s) Minimum Split (s) Total Split (s) Total Split (%) Yellow Time (s) All-Red Time (s) Lost Time Adjust (s) Total Lost Time (s) Lead/Lag Lead-Lag Optimize? Recall Mode Act Effct Green (s) Actuated g/C Ratio v/c Ratio Control Delay Queue Delay Total Delay LOS Approach Delay Approach LOS
Existing Year 2012 - AM Peak 1/31/2013
EBL
EBT
WBL
WBT
NBT
SBT
139 pm+pt 5 2 5
252
8 pm+pt 1 6 1
157
137
19
6
8
4
6
8
4
5.0 14.0 15.0 14.6% 3.0 2.0 0.0 5.0 Lead Yes None 28.4 0.40 0.34 17.3 0.0 17.3 B
10.0 34.5 39.5 38.5% 3.5 2.0 0.0 5.5 Lag Yes None 26.1 0.37 0.47 21.4 0.0 21.4 C 20.1 C
5.0 10.0 15.0 14.6% 3.0 2.0 0.0 5.0 Lead Yes None 19.6 0.28 0.03 14.4 0.0 14.4 B
10.0 21.5 28.5 27.8% 3.5 2.0 0.0 5.5 Lag Yes None 13.9 0.20 0.57 32.6 0.0 32.6 C 31.9 C
10.0 22.5 25.5 24.9% 3.5 2.0 0.0 5.5
10.0 22.5 22.5 22.0% 3.5 2.0 0.0 5.5
None 20.0 0.28 0.69 33.7 0.0 33.7 C 33.7 C
None 10.4 0.15 0.27 18.2 0.0 18.2 B 18.2 B
2 2
Intersection Summary Cycle Length: 102.5 Actuated Cycle Length: 70.9 Natural Cycle: 90 Control Type: Actuated-Uncoordinated Maximum v/c Ratio: 0.69 Intersection Signal Delay: 26.6 Intersection Capacity Utilization 57.8% Analysis Period (min) 15 Splits and Phases:
Intersection LOS: C ICU Level of Service B
1: College St & Junction Ave
College St/Junction Ave/19th Ave E SRF Consulting Group, Inc.
Page 1
Timings 1: College St & Junction Ave
Lane Group Lane Configurations Volume (vph) Turn Type Protected Phases Permitted Phases Detector Phase Switch Phase Minimum Initial (s) Minimum Split (s) Total Split (s) Total Split (%) Yellow Time (s) All-Red Time (s) Lost Time Adjust (s) Total Lost Time (s) Lead/Lag Lead-Lag Optimize? Recall Mode Act Effct Green (s) Actuated g/C Ratio v/c Ratio Control Delay Queue Delay Total Delay LOS Approach Delay Approach LOS
Existing Year 2012 - PM Peak 1/31/2013
EBL
EBT
WBL
WBT
NBT
SBT
113 pm+pt 5 2 5
167
45 pm+pt 1 6 1
270
63
69
6
8
4
6
8
4
5.0 14.0 15.0 14.6% 3.0 2.0 0.0 5.0 Lead Yes None 28.4 0.36 0.36 19.4 0.0 19.4 B
10.0 34.5 39.5 38.5% 3.5 2.0 0.0 5.5 Lag Yes None 22.8 0.29 0.59 27.6 0.0 27.6 C 25.3 C
5.0 10.0 15.0 14.6% 3.0 2.0 0.0 5.0 Lead Yes None 23.8 0.30 0.15 16.9 0.0 16.9 B
10.0 21.5 28.5 27.8% 3.5 2.0 0.0 5.5 Lag Yes None 18.6 0.24 0.71 38.8 0.0 38.8 D 35.8 D
10.0 22.5 25.5 24.9% 3.5 2.0 0.0 5.5
10.0 22.5 22.5 22.0% 3.5 2.0 0.0 5.5
None 15.7 0.20 0.70 42.1 0.0 42.1 D 42.1 D
None 16.5 0.21 0.75 38.4 0.0 38.4 D 38.4 D
2 2
Intersection Summary Cycle Length: 102.5 Actuated Cycle Length: 78.5 Natural Cycle: 90 Control Type: Actuated-Uncoordinated Maximum v/c Ratio: 0.75 Intersection Signal Delay: 34.2 Intersection Capacity Utilization 69.1% Analysis Period (min) 15 Splits and Phases:
Intersection LOS: C ICU Level of Service C
1: College St & Junction Ave
College St/Junction Ave/19th Ave E SRF Group Consulting, Inc.
Page 1
Diagram Layout Version 1.0 May 2010
Notes:
10/19/2012
CRASH COUNT: 40 - WORK AREA: COUNTY_CODE('69') - FILTER: CRASH_YEAR('2002','2003','2004','2005','2006','2007','2008','2009','2010','2011') - SPATIAL FILTER APPLIED MnCMAT 1.0.0
Crash Detail Report College/Junction/19th Ave E Report Version 1.0 March 2010
Crash ID: 021020040 County: ST LOUIS
Time: 1700
Date: 04/12/2002 City: DULUTH
Route: 10400156
Severity: PROPERTY DAMAGE Road Type: Road Char: Crash Type: Surf Cond: Light Cond: Weather 1: Weather 2:
To Junction: UNKNOWN Traffic Device: STOP SIGN 4-WAY Speed Limit: 30 Diagram: UNKNOWN Officer: Reliability: CONFIDENT # of Vehicles: 2.00 Unit 2
Trav Dir:
EAST
N
Veh Act:
LEFT TURN
STRAIGHT AHEAD
PASSENGER CAR
PICKUP TRUCK
18
46
F
M
Cond:
UNKNOWN
UNKNOWN
Cont Fact
UNKNOWN
UNKNOWN
Cont Fact
UNKNOWN
UNKNOWN
Age: Gender:
Crash ID: 031050315 County: ST LOUIS
Unit 3
Time: 1630
Date: 02/04/2003 City: DULUTH
Road Char: Crash Type: Surf Cond: Light Cond: Weather 1: Weather 2:
To Junction: NON-JUNCTION Traffic Device: OTHER Speed Limit: < 30 Diagram: REAR END Officer: Reliability: LESS CONFIDENT # of Vehicles: 2.00 Unit 2
Trav Dir:
S
S
Veh Act:
LEFT TURN
LEFT TURN
PICKUP TRUCK
PASSENGER CAR
21
55
M
F
NORMAL
NORMAL
Cont Fact
DISTRACTION
DISTRACTION
Cont Fact
NOT SPECIFIED
NOT SPECIFIED
Age: Gender: Cond:
10/19/2012
000+00.025
First Event: ON ROADWAY
2 LANES UNDIV 2_WAY STRAIGHT AND LEVEL COLL W/MV IN TRANSPORT DRY DAYLIGHT CLEAR NOT SPECIFIED
Unit 1
Veh Type:
Sys: 05-MSAS Route: 10400156
Severity: PROPERTY DAMAGE Road Type:
000+00.000
First Event: UNKNOWN
UNKNOWN UNKNOWN COLL W/MV IN TRANSPORT DRY DAYLIGHT CLEAR NOT SPECIFIED
Unit 1
Veh Type:
Sys: 05-MSAS
MnCMAT 1.0.0
Unit 3
Page 1 of 21
Crash ID: 031290079 County: ST LOUIS
Time: 1036
Date: 05/02/2003 City: DULUTH
Route: 10400155
Severity: PROPERTY DAMAGE Road Type: Road Char: Crash Type: Surf Cond: Light Cond: Weather 1: Weather 2:
To Junction: 4-LEGGED INTERSECTION Traffic Device: STOP SIGN 4-WAY Speed Limit: 30 Diagram: REAR END Officer: Reliability: CONFIDENT # of Vehicles: 2.00 Unit 2
Trav Dir:
N
NE
Veh Act:
STRAIGHT AHEAD
00
SPORT UNTILITY VEHICLE
BICYCLE
61
21
M
M
NORMAL
NOT APPLICABLE
Cont Fact
NO IMPROPER DRIVING
NOT SPECIFIED
Cont Fact
NOT SPECIFIED
NOT SPECIFIED
Age: Gender: Cond:
Crash ID: 040740002 County: ST LOUIS
Road Char: Crash Type: Surf Cond: Light Cond: Weather 1: Weather 2:
Unit 3
Time: 2127
Date: 03/13/2004 City: DULUTH
To Junction: NON-JUNCTION Traffic Device: NO PASSING ZONE Speed Limit: 30 Diagram: SIDESWIPE OPPOSING Officer: Reliability: BEST GUESS # of Vehicles: 2.00 Unit 2
Trav Dir:
EAST
W
Veh Act:
STRAIGHT AHEAD
STRAIGHT AHEAD
PASSENGER CAR
VAN OR MINIVAN
17
36
F
M
NORMAL
NORMAL
Cont Fact
SKIDDING
NO IMPROPER DRIVING
Cont Fact
WEATHER
NOT SPECIFIED
Age: Gender: Cond:
10/19/2012
000+00.000
First Event: ON ROADWAY
2 LANES UNDIV 2_WAY CURVE AND GRADE COLL W/MV IN TRANSPORT ICE/PACKED SNOW DARK - STREET LIGHTS ON SNOW SLEET/HAIL/FREEZE-RAIN
Unit 1
Veh Type:
Sys: 05-MSAS Route: 10400156
Severity: NON-INCAPACITATING INJURY Road Type:
000+00.510
First Event: ON ROADWAY
2 LANES UNDIV 2_WAY STRAIGHT AND GRADE COLL W/PEDALCYCLE DRY DAYLIGHT CLOUDY NOT SPECIFIED
Unit 1
Veh Type:
Sys: 05-MSAS
MnCMAT 1.0.0
Unit 3
Page 2 of 21
Crash ID: 041210199 County: ST LOUIS
Time: 1405
Date: 04/29/2004 City: DULUTH
Route: 10400155
Severity: NON-INCAPACITATING INJURY Road Type: Road Char: Crash Type: Surf Cond: Light Cond: Weather 1: Weather 2:
000+00.510
First Event: ON ROADWAY
2 LANES UNDIV 2_WAY STRAIGHT AT HILLCREST COLL OTHER TYPE DRY DAYLIGHT CLEAR NOT SPECIFIED
Unit 1
Sys: 05-MSAS
To Junction: NON-JUNCTION Traffic Device: TRAFFIC SIGNALS Speed Limit: 30 Diagram: REAR END Officer: Reliability: CONFIDENT # of Vehicles: 4.00 Unit 2
Unit 3
Trav Dir: Veh Act: Veh Type: Age: Gender: Cond: Cont Fact Cont Fact
Crash ID: 041220013 County: ST LOUIS
Time: 0337
Date: 04/25/2004 City: DULUTH
Route: 10400155
Severity: NON-INCAPACITATING INJURY Road Type: Road Char: Crash Type: Surf Cond: Light Cond: Weather 1: Weather 2:
Trav Dir:
NE
Veh Act:
PED. NOT IN ROAD
Veh Type: Age: Gender: Cond:
To Junction: NON-JUNCTION Traffic Device: NOT APPLICABLE Speed Limit: < 30 Diagram: RAN OFF ROAD - RIGHT SIDE Officer: Reliability: CONFIDENT # of Vehicles: 1.00 Unit 2
Unit 3
PASSENGER CAR 32 M HAD BEEN DRINKING
Cont Fact
OTHER HUMAN FACTOR
Cont Fact
ILLEGAL SPEED
10/19/2012
000+00.529
First Event: PRIVATE PROPERTY
PRIVATE CURVE AND LEVEL COLL W/TREE OR SHRUB DRY DARK - NO STREET LIGHTS CLOUDY NOT SPECIFIED
Unit 1
Sys: 05-MSAS
MnCMAT 1.0.0
Page 3 of 21
Crash ID: 041250230 County: ST LOUIS
Time: 0846
Date: 01/18/2004 City: DULUTH
Route: 10400154
Severity: PROPERTY DAMAGE Road Type: Road Char: Crash Type: Surf Cond: Light Cond: Weather 1: Weather 2:
Unit 1
S
Veh Act:
STRAIGHT AHEAD
Veh Type: Age: Gender: Cond:
To Junction: NON-JUNCTION Traffic Device: NOT APPLICABLE Speed Limit: 30 Diagram: REAR END Officer: Reliability: CONFIDENT # of Vehicles: 1.00 Unit 2
20 F NORMAL VISION OBSCURED - SUN OR H
Cont Fact
NOT SPECIFIED
Crash ID: 041400164 County: ST LOUIS
Time: 1004
Date: 02/20/2004 City: DULUTH
Road Type: Road Char: Crash Type: Surf Cond: Light Cond: Weather 1: Weather 2:
Trav Dir:
S
Veh Act:
STRAIGHT AHEAD
Gender: Cond:
To Junction: NON-JUNCTION Traffic Device: NOT APPLICABLE Speed Limit: 30 Diagram: RAN OFF ROAD - LEFT SIDE Officer: Reliability: BEST GUESS # of Vehicles: 2.00 Unit 2
Unit 3
PASSENGER CAR 47 F NORMAL
Cont Fact
WEATHER
Cont Fact
SKIDDING
10/19/2012
000+00.000
First Event: OFF ROADWAY ON ROADSIDE
2 LANES UNDIV 2_WAY CURVE AT HILLCREST COLL W/PARKED MV ICE/PACKED SNOW DAYLIGHT SNOW SLEET/HAIL/FREEZE-RAIN
Unit 1
Sys: 05-MSAS Route: 10400156
Severity: NON-INCAPACITATING INJURY
Age:
Unit 3
SPORT UNTILITY VEHICLE
Cont Fact
Veh Type:
001+00.010
First Event: OFF ROADWAY ON SHOULDER
2 LANES UNDIV 2_WAY STRAIGHT AND GRADE COLL W/PARKED MV SNOW DAYLIGHT CLEAR NOT SPECIFIED
Trav Dir:
Sys: 05-MSAS
MnCMAT 1.0.0
Page 4 of 21
Crash ID: 041540161 County: ST LOUIS
Time: 0750
Date: 01/15/2004 City: DULUTH
Route: 10400156
Severity: PROPERTY DAMAGE Road Type: Road Char: Crash Type: Surf Cond: Light Cond: Weather 1: Weather 2:
To Junction: NOT SPECIFIED Traffic Device: UNKNOWN Speed Limit: < 30 Diagram: SIDESWIPE OPPOSING Officer: Reliability: BEST GUESS # of Vehicles: 2.00 Unit 2
Trav Dir:
S
N
Veh Act:
RIGHT TURN
STRAIGHT AHEAD
PASSENGER CAR
PICKUP TRUCK
62
39
F
M
Cond:
NOT SPECIFIED
NOT SPECIFIED
Cont Fact
NOT SPECIFIED
NOT SPECIFIED
Cont Fact
NOT SPECIFIED
NOT SPECIFIED
Age: Gender:
Crash ID: 041600065 County: ST LOUIS
Road Char: Crash Type: Surf Cond: Light Cond: Weather 1: Weather 2:
City: DULUTH
Sys: 05-MSAS Route: 10400155
000+00.510
First Event: NOT SPECIFIED
NOT SPECIFIED NOT SPECIFIED COLL W/MV IN TRANSPORT DRY DARK - STREET LIGHTS ON CLEAR NOT SPECIFIED
Unit 1
Unit 3
Time: 1848
Date: 01/19/2004
Severity: PROPERTY DAMAGE Road Type:
000+00.000
First Event: NOT SPECIFIED
NOT SPECIFIED NOT SPECIFIED COLL W/MV IN TRANSPORT SNOW DAYLIGHT SNOW NOT SPECIFIED
Unit 1
Veh Type:
Sys: 05-MSAS
To Junction: NOT SPECIFIED Traffic Device: TRAFFIC SIGNALS Speed Limit: NL Diagram: NOT CODED Officer: Reliability: CONFIDENT # of Vehicles: 2.00 Unit 2
Unit 3
Trav Dir: Veh Act: Veh Type: Age: Gender: Cond: Cont Fact Cont Fact
10/19/2012
MnCMAT 1.0.0
Page 5 of 21
Crash ID: 043210517 County: ST LOUIS
Time: 2025
Date: 11/16/2004 City: DULUTH
Route: 10400156
Severity: NON-INCAPACITATING INJURY Road Type: Road Char: Crash Type: Surf Cond: Light Cond: Weather 1: Weather 2:
To Junction: INTERSECTION-RELATED Traffic Device: STOP SIGN OTHER Speed Limit: 30 Diagram: SIDESWIPE PASSING Officer: Reliability: BEST GUESS # of Vehicles: 2.00 Unit 2
Trav Dir:
S
W
Veh Act:
STRAIGHT AHEAD
LEFT TURN
PICKUP TRUCK
PASSENGER CAR
20
18
M
F
NORMAL
NORMAL
Cont Fact
NO IMPROPER DRIVING
FAIL TO YIELD ROW
Cont Fact
NO IMPROPER DRIVING
NO IMPROPER DRIVING
Age: Gender: Cond:
Crash ID: 050400818 County: ST LOUIS
Road Char: Crash Type: Surf Cond: Light Cond: Weather 1: Weather 2:
Unit 3
Time: 0959
Date: 02/09/2005 City: DULUTH
To Junction: NON-JUNCTION Traffic Device: NOT APPLICABLE Speed Limit: < 30 Diagram: RIGHT ANGLE Officer: Reliability: BEST GUESS # of Vehicles: 2.00 Unit 2
Trav Dir:
N
N
Veh Act:
U TURN
STRAIGHT AHEAD
PASSENGER CAR
PICKUP TRUCK
22
25
F
M
NORMAL
NORMAL
Cont Fact
IMPROPER LANE
NO IMPROPER DRIVING
Cont Fact
IMPROPER TURN
NOT SPECIFIED
Age: Gender: Cond:
10/19/2012
000+00.000
First Event: ON ROADWAY
OTHER CURVE AND LEVEL COLL W/MV IN TRANSPORT WET DAYLIGHT CLOUDY SNOW
Unit 1
Veh Type:
Sys: 05-MSAS Route: 10400156
Severity: PROPERTY DAMAGE Road Type:
000+00.000
First Event: ON ROADWAY
2 LANES UNDIV 2_WAY STRAIGHT AND GRADE COLL W/MV IN TRANSPORT WET DARK - STREET LIGHTS ON FOG/SMOG/SMOKE RAIN
Unit 1
Veh Type:
Sys: 05-MSAS
MnCMAT 1.0.0
Unit 3
Page 6 of 21
Crash ID: 050620387 County: ST LOUIS
Time: 1500
Date: 03/03/2005 City: DULUTH
Route: 10400156
Severity: PROPERTY DAMAGE Road Type: Road Char: Crash Type: Surf Cond: Light Cond: Weather 1: Weather 2:
Unit 1
N
Veh Act:
STRAIGHT AHEAD
Veh Type: Age: Gender: Cond:
To Junction: 4-LEGGED INTERSECTION Traffic Device: STOP SIGN OTHER Speed Limit: 30 Diagram: RIGHT ANGLE Officer: Reliability: BEST GUESS # of Vehicles: 2.00 Unit 2
Unit 3
PASSENGER CAR 58 F NORMAL
Cont Fact
DISREGARD TRAFFIC DEVICE
Cont Fact
FAIL TO YIELD ROW
Crash ID: 053400201 County: ST LOUIS
Time: 1530
Date: 12/02/2005 City: DULUTH
Road Type: Road Char: Crash Type: Surf Cond: Light Cond: Weather 1: Weather 2:
To Junction: ALLEY-DRIVEWAY ACCESS Traffic Device: NOT APPLICABLE Speed Limit: 30 Diagram: RIGHT ANGLE Officer: Reliability: CONFIDENT # of Vehicles: 2.00 Unit 2
Trav Dir:
N
E
Veh Act:
LEFT TURN
STRAIGHT AHEAD
VAN OR MINIVAN
PASSENGER CAR
44
23
F
F
NORMAL
NORMAL
Cont Fact
FAIL TO YIELD ROW
NO IMPROPER DRIVING
Cont Fact
NOT SPECIFIED
NOT SPECIFIED
Gender: Cond:
10/19/2012
000+00.495
First Event: ON ROADWAY
3 LANES UNDIVIDED STRAIGHT AND GRADE COLL W/MV IN TRANSPORT DRY DAYLIGHT CLEAR NOT SPECIFIED
Unit 1
Age:
Sys: 05-MSAS Route: 10400155
Severity: PROPERTY DAMAGE
Veh Type:
000+00.000
First Event: ON ROADWAY
OTHER STRAIGHT AND GRADE COLL W/MV IN TRANSPORT DRY DAYLIGHT CLEAR NOT SPECIFIED
Trav Dir:
Sys: 05-MSAS
MnCMAT 1.0.0
Unit 3
Page 7 of 21
Crash ID: 071300233 County: ST LOUIS
Time: 1756
Date: 05/01/2007 City: DULUTH
Route: 10400155
Severity: PROPERTY DAMAGE Road Type: Road Char: Crash Type: Surf Cond: Light Cond: Weather 1: Weather 2:
To Junction: 4-LEGGED INTERSECTION Traffic Device: TRAFFIC SIGNALS Speed Limit: 30 Diagram: HEAD ON Officer: Reliability: CONFIDENT # of Vehicles: 2.00 Unit 2
Trav Dir:
N
S
Veh Act:
STRAIGHT AHEAD
LEFT TURN
PASSENGER CAR
PASSENGER CAR
20
20
F
M
NORMAL
NORMAL
Cont Fact
DISREGARD TRAFFIC DEVICE
NO IMPROPER DRIVING
Cont Fact
NOT SPECIFIED
NOT SPECIFIED
Age: Gender: Cond:
Crash ID: 071370009 County: ST LOUIS
Road Char: Crash Type: Surf Cond: Light Cond: Weather 1: Weather 2:
Unit 3
Time: 2310
Date: 05/16/2007 City: DULUTH
To Junction: 4-LEGGED INTERSECTION Traffic Device: TRAFFIC SIGNALS Speed Limit: 30 Diagram: LEFT TURN INTO TRAFFIC Officer: Reliability: CONFIDENT # of Vehicles: 2.00 Unit 2
Trav Dir:
EAST
W
Veh Act:
LEFT TURN
STRAIGHT AHEAD
PASSENGER CAR
PASSENGER CAR
20
22
F
M
NORMAL
NORMAL
Cont Fact
FAIL TO YIELD ROW
NO IMPROPER DRIVING
Cont Fact
NOT SPECIFIED
NOT SPECIFIED
Age: Gender: Cond:
10/19/2012
000+00.510
First Event: ON ROADWAY
2 LANES UNDIV 2_WAY STRAIGHT AND GRADE COLL W/MV IN TRANSPORT DRY DARK - STREET LIGHTS ON CLOUDY NOT SPECIFIED
Unit 1
Veh Type:
Sys: 05-MSAS Route: 10400155
Severity: PROPERTY DAMAGE Road Type:
000+00.510
First Event: ON ROADWAY
2 LANES UNDIV 2_WAY STRAIGHT AND GRADE COLL W/MV IN TRANSPORT DRY DAYLIGHT CLEAR NOT SPECIFIED
Unit 1
Veh Type:
Sys: 05-MSAS
MnCMAT 1.0.0
Unit 3
Page 8 of 21
Crash ID: 071520065 County: ST LOUIS
Time: 1705
Date: 05/10/2007 City: DULUTH
Route: 10400155
Severity: PROPERTY DAMAGE Road Type: Road Char: Crash Type: Surf Cond: Light Cond: Weather 1: Weather 2:
To Junction: INTERSECTION-RELATED Traffic Device: TRAFFIC SIGNALS Speed Limit: 30 Diagram: REAR END Officer: Reliability: CONFIDENT # of Vehicles: 2.00 Unit 2
Trav Dir:
MC
MC
Veh Act:
STOPPED TRAFFIC
00
PASSENGER CAR
99
19
895
M
NULL
NORMAL
NOT SPECIFIED
Cont Fact
NO IMPROPER DRIVING
NOT SPECIFIED
Cont Fact
NOT SPECIFIED
NOT SPECIFIED
Age: Gender: Cond:
Crash ID: 073440122 County: ST LOUIS
Road Char: Crash Type: Surf Cond: Light Cond: Weather 1: Weather 2:
Unit 3
Time: 0927
Date: 12/06/2007 City: DULUTH
To Junction: 4-LEGGED INTERSECTION Traffic Device: TRAFFIC SIGNALS Speed Limit: 30 Diagram: REAR END Officer: Reliability: CONFIDENT # of Vehicles: 2.00 Unit 2
Trav Dir:
EAST
E
Veh Act:
STRAIGHT AHEAD
STOPPED TRAFFIC
SPORT UNTILITY VEHICLE
SPORT UNTILITY VEHICLE
25
21
M
M
NORMAL
NORMAL
Cont Fact
ILLEGAL SPEED
NO IMPROPER DRIVING
Cont Fact
DEFECTIVE BRAKES
NOT SPECIFIED
Age: Gender: Cond:
10/19/2012
000+00.510
First Event: ON ROADWAY
2 LANES UNDIV 2_WAY STRAIGHT AND GRADE COLL W/MV IN TRANSPORT ICE/PACKED SNOW DAYLIGHT CLOUDY NOT SPECIFIED
Unit 1
Veh Type:
Sys: 05-MSAS Route: 10400155
Severity: PROPERTY DAMAGE Road Type:
000+00.510
First Event: ON ROADWAY
OTHER DIVIDED HIGHWAY STRAIGHT AND LEVEL COLL W/MV IN TRANSPORT DRY DAYLIGHT CLEAR NOT SPECIFIED
Unit 1
Veh Type:
Sys: 05-MSAS
MnCMAT 1.0.0
Unit 3
Page 9 of 21
Crash ID: 080500177 County: ST LOUIS
Time: 0800
Date: 11/09/2007 City: DULUTH
Route: 10400155
Severity: PROPERTY DAMAGE Road Type: Road Char: Crash Type: Surf Cond: Light Cond: Weather 1: Weather 2:
Unit 1
EAST
Veh Act:
STOPPED TRAFFIC
Veh Type: Age: Gender:
To Junction: NOT SPECIFIED Traffic Device: TRAFFIC SIGNALS Speed Limit: NL Diagram: OTHER Officer: Reliability: CONFIDENT # of Vehicles: 2.00 Unit 2
Unit 3
PASSENGER CAR 25 M
Cond:
NOT SPECIFIED
Cont Fact
NOT SPECIFIED
Cont Fact
NOT SPECIFIED
Crash ID: 080510312 County: ST LOUIS
Time: 0802
Date: 02/20/2008 City: DULUTH
Road Type: Road Char: Crash Type: Surf Cond: Light Cond: Weather 1: Weather 2:
To Junction: 4-LEGGED INTERSECTION Traffic Device: TRAFFIC SIGNALS Speed Limit: 30 Diagram: REAR END Officer: Reliability: CONFIDENT # of Vehicles: 2.00 Unit 2
Trav Dir:
N
N
Veh Act:
STOPPED TRAFFIC
STRAIGHT AHEAD
PASSENGER CAR
PASSENGER CAR
22
20
M
F
NORMAL
NORMAL
Cont Fact
NO IMPROPER DRIVING
FOLLOWING TOO CLOSELY
Cont Fact
NOT SPECIFIED
NOT SPECIFIED
Gender: Cond:
10/19/2012
000+00.988
First Event: ON ROADWAY
2 LANES UNDIV 2_WAY STRAIGHT AND GRADE COLL W/MV IN TRANSPORT DRY DAYLIGHT CLEAR NOT SPECIFIED
Unit 1
Age:
Sys: 05-MSAS Route: 10400154
Severity: PROPERTY DAMAGE
Veh Type:
000+00.510
First Event: NOT SPECIFIED
NOT SPECIFIED NOT SPECIFIED COLL W/MV IN TRANSPORT SNOW DAYLIGHT SNOW NOT SPECIFIED
Trav Dir:
Sys: 05-MSAS
MnCMAT 1.0.0
Unit 3
Page 10 of 21
Crash ID: 082910180 County: ST LOUIS
Time: 1816
Date: 10/12/2008 City: DULUTH
Route: 10400155
Severity: PROPERTY DAMAGE Road Type: Road Char: Crash Type: Surf Cond: Light Cond: Weather 1: Weather 2:
To Junction: 4-LEGGED INTERSECTION Traffic Device: TRAFFIC SIGNALS Speed Limit: 30 Diagram: RIGHT ANGLE Officer: Reliability: CONFIDENT # of Vehicles: 2.00 Unit 2
Trav Dir:
W
E
Veh Act:
STRAIGHT AHEAD
LEFT TURN
SPORT UNTILITY VEHICLE
PASSENGER CAR
23
19
M
F
NORMAL
NORMAL
Cont Fact
NO IMPROPER DRIVING
FAIL TO YIELD ROW
Cont Fact
NOT SPECIFIED
DISTRACTION
Age: Gender: Cond:
Crash ID: 083090248 County: ST LOUIS
Road Char: Crash Type: Surf Cond: Light Cond: Weather 1: Weather 2:
Unit 3
Time: 1420
Date: 11/04/2008 City: DULUTH
To Junction: INTERSECTION-RELATED Traffic Device: TRAFFIC SIGNALS Speed Limit: 30 Diagram: LEFT TURN INTO TRAFFIC Officer: Reliability: CONFIDENT # of Vehicles: 2.00 Unit 2
Trav Dir:
W
E
Veh Act:
STRAIGHT AHEAD
LEFT TURN
PICKUP TRUCK
PASSENGER CAR
58
19
M
F
NORMAL
NORMAL
Cont Fact
NO IMPROPER DRIVING
FAIL TO YIELD ROW
Cont Fact
NOT SPECIFIED
NOT SPECIFIED
Age: Gender: Cond:
10/19/2012
000+00.510
First Event: ON ROADWAY
4_6 LANES UNDIV 2_WAY STRAIGHT AND GRADE COLL W/MV IN TRANSPORT DRY DAYLIGHT CLEAR NOT SPECIFIED
Unit 1
Veh Type:
Sys: 05-MSAS Route: 10400155
Severity: POSSIBLE INJURY Road Type:
000+00.510
First Event: ON ROADWAY
2 LANES UNDIV 2_WAY STRAIGHT AND GRADE COLL W/MV IN TRANSPORT WET DARK - STREET LIGHTS ON CLOUDY NOT SPECIFIED
Unit 1
Veh Type:
Sys: 05-MSAS
MnCMAT 1.0.0
Unit 3
Page 11 of 21
Crash ID: 083460356 County: ST LOUIS
Time: 1752
Date: 12/11/2008 City: DULUTH
Route: 10400155
Severity: PROPERTY DAMAGE Road Type: Road Char: Crash Type: Surf Cond: Light Cond: Weather 1: Weather 2:
Sys: 05-MSAS
000+00.500
First Event: ON ROADWAY
4_6 LANES UNDIV 2_WAY STRAIGHT AND LEVEL COLL W/MV IN TRANSPORT WET DARK - STREET LIGHTS ON CLEAR NOT SPECIFIED
To Junction: INTERSECTION-RELATED Traffic Device: NOT APPLICABLE Speed Limit: 30 Diagram: REAR END Officer: Reliability: CONFIDENT # of Vehicles: 3.00
Unit 1
Unit 2
Unit 3
Trav Dir:
EAST
E
EAST
Veh Act:
STRAIGHT AHEAD
STOPPED TRAFFIC
STOPPED TRAFFIC
SPORT UNTILITY VEHICLE
SPORT UNTILITY VEHICLE
VAN OR MINIVAN
22
18
62
M
F
M
NORMAL
NORMAL
NORMAL
Cont Fact
DISTRACTION
NO IMPROPER DRIVING
NO IMPROPER DRIVING
Cont Fact
NOT SPECIFIED
NOT SPECIFIED
NOT SPECIFIED
Veh Type: Age: Gender: Cond:
Crash ID: 083510220 County: ST LOUIS
Time: 1300
Date: 12/15/2008 City: DULUTH
Route: 10400156
Severity: PROPERTY DAMAGE Road Type: Road Char: Crash Type: Surf Cond: Light Cond: Weather 1: Weather 2:
Sys: 05-MSAS
000+00.000
First Event: ON ROADWAY
3 LANES UNDIVIDED STRAIGHT AND LEVEL COLL W/MV IN TRANSPORT ICE/PACKED SNOW DAYLIGHT CLEAR NOT SPECIFIED
To Junction: NON-JUNCTION Traffic Device: TRAFFIC SIGNALS Speed Limit: 30 Diagram: REAR END Officer: Reliability: CONFIDENT # of Vehicles: 3.00
Unit 1
Unit 2
Unit 3
Trav Dir:
EAST
E
EAST
Veh Act:
SLOWING TRAFFIC
SLOWING TRAFFIC
STOPPED TRAFFIC
PASSENGER CAR
PASSENGER CAR
PASSENGER CAR
22
21
UNKNOWN
F
F
NULL
NORMAL
NORMAL
NORMAL
Cont Fact
WEATHER
WEATHER
NO IMPROPER DRIVING
Cont Fact
SKIDDING
SKIDDING
NOT SPECIFIED
Veh Type: Age: Gender: Cond:
10/19/2012
MnCMAT 1.0.0
Page 12 of 21
Crash ID: 083580559 County: ST LOUIS
Time: 1700
Date: 12/23/2008 City: DULUTH
Route: 10400155
Severity: POSSIBLE INJURY Road Type: Road Char: Crash Type: Surf Cond: Light Cond: Weather 1: Weather 2:
To Junction: 4-LEGGED INTERSECTION Traffic Device: NOT APPLICABLE Speed Limit: 30 Diagram: REAR END Officer: Reliability: CONFIDENT # of Vehicles: 2.00 Unit 2
Trav Dir:
EAST
E
Veh Act:
SLOWING TRAFFIC
00
PASSENGER CAR
PASSENGER CAR
20
24
F
F
NORMAL
NORMAL
Cont Fact
FOLLOWING TOO CLOSELY
NO IMPROPER DRIVING
Cont Fact
NOT SPECIFIED
NOT SPECIFIED
Age: Gender: Cond:
Crash ID: 090060416 County: ST LOUIS
Road Char: Crash Type: Surf Cond: Light Cond: Weather 1: Weather 2:
Unit 3
Time: 1936
Date: 12/15/2008 City: DULUTH
To Junction: INTERSECTION-RELATED Traffic Device: TRAFFIC SIGNALS Speed Limit: < 30 Diagram: REAR END Officer: Reliability: CONFIDENT # of Vehicles: 2.00 Unit 2
Trav Dir:
W
W
Veh Act:
STRAIGHT AHEAD
START TRAFFIC
PICKUP TRUCK
PASSENGER CAR
21
19
M
M
NORMAL
NORMAL
Cont Fact
WEATHER
NO IMPROPER DRIVING
Cont Fact
NOT SPECIFIED
NOT SPECIFIED
Age: Gender: Cond:
10/19/2012
000+00.000
First Event: ON ROADWAY
2 LANES UNDIV 2_WAY STRAIGHT AND LEVEL COLL W/MV IN TRANSPORT SNOW DARK - STREET LIGHTS ON SNOW NOT SPECIFIED
Unit 1
Veh Type:
Sys: 05-MSAS Route: 10400156
Severity: PROPERTY DAMAGE Road Type:
000+00.510
First Event: ON ROADWAY
2 LANES UNDIV 2_WAY STRAIGHT AT HILLCREST COLL W/MV IN TRANSPORT SNOW SUNSET SNOW CLOUDY
Unit 1
Veh Type:
Sys: 05-MSAS
MnCMAT 1.0.0
Unit 3
Page 13 of 21
Crash ID: 090630236 County: ST LOUIS
Time: 2222
Date: 03/04/2009 City: DULUTH
Route: 10400155
Severity: POSSIBLE INJURY Road Type: Road Char: Crash Type: Surf Cond: Light Cond: Weather 1: Weather 2:
To Junction: T-INTERSECTION Traffic Device: TRAFFIC SIGNALS Speed Limit: 30 Diagram: LEFT TURN INTO TRAFFIC Officer: Reliability: CONFIDENT # of Vehicles: 2.00 Unit 2
Trav Dir:
N
W
Veh Act:
LEFT TURN
STRAIGHT AHEAD
PASSENGER CAR
PASSENGER CAR
20
23
F
M
NORMAL
NORMAL
Cont Fact
FAIL TO YIELD ROW
NO IMPROPER DRIVING
Cont Fact
NOT SPECIFIED
NOT SPECIFIED
Age: Gender: Cond:
Crash ID: 090690267 County: ST LOUIS
Road Char: Crash Type: Surf Cond: Light Cond: Weather 1: Weather 2:
Unit 3
Time: 1551
Date: 03/10/2009 City: DULUTH
To Junction: NON-JUNCTION Traffic Device: NOT APPLICABLE Speed Limit: 30 Diagram: REAR END Officer: Reliability: CONFIDENT # of Vehicles: 2.00 Unit 2
Trav Dir:
EAST
E
Veh Act:
SLOWING TRAFFIC
SLOWING TRAFFIC
PICKUP TRUCK
PASSENGER CAR
38
21
M
F
NORMAL
NORMAL
Cont Fact
WEATHER
NO IMPROPER DRIVING
Cont Fact
NOT SPECIFIED
NOT SPECIFIED
Age: Gender: Cond:
10/19/2012
000+00.491
First Event: ON ROADWAY
4_6 LANES UNDIV 2_WAY STRAIGHT AND GRADE COLL W/MV IN TRANSPORT SNOW DAYLIGHT SNOW BLOWING SAND/DUST/SNOW
Unit 1
Veh Type:
Sys: 05-MSAS Route: 10400155
Severity: POSSIBLE INJURY Road Type:
000+00.510
First Event: ON ROADWAY
FREEWAY MAINLINE STRAIGHT AND LEVEL COLL W/MV IN TRANSPORT SLUSH DARK - STREET LIGHTS ON CLEAR NOT SPECIFIED
Unit 1
Veh Type:
Sys: 05-MSAS
MnCMAT 1.0.0
Unit 3
Page 14 of 21
Crash ID: 092670094 County: ST LOUIS
Time: 0741
Date: 09/17/2009 City: DULUTH
Route: 10400155
Severity: PROPERTY DAMAGE Road Type: Road Char: Crash Type: Surf Cond: Light Cond: Weather 1: Weather 2:
Sys: 05-MSAS
000+00.538
First Event: ON ROADWAY
2 LANES UNDIV 2_WAY STRAIGHT AND GRADE COLL W/MV IN TRANSPORT DRY DAYLIGHT CLEAR NOT SPECIFIED
To Junction: NON-JUNCTION Traffic Device: NOT APPLICABLE Speed Limit: 30 Diagram: REAR END Officer: Reliability: CONFIDENT # of Vehicles: 3.00
Unit 1
Unit 2
Unit 3
Trav Dir:
N
N
N
Veh Act:
STRAIGHT AHEAD
SLOWING TRAFFIC
STRAIGHT AHEAD
PASSENGER CAR
PASSENGER CAR
PASSENGER CAR
28
19
22
F
F
M
NORMAL
NORMAL
NORMAL
Cont Fact
NO IMPROPER DRIVING
NO IMPROPER DRIVING
FOLLOWING TOO CLOSELY
Cont Fact
NOT SPECIFIED
NOT SPECIFIED
NOT SPECIFIED
Veh Type: Age: Gender: Cond:
Crash ID: 092980102 County: ST LOUIS
Time: 1834
Date: 10/25/2009 City: DULUTH
Route: 10400155
Severity: POSSIBLE INJURY Road Type: Road Char: Crash Type: Surf Cond: Light Cond: Weather 1: Weather 2:
To Junction: T-INTERSECTION Traffic Device: TRAFFIC SIGNALS Speed Limit: 30 Diagram: LEFT TURN INTO TRAFFIC Officer: Reliability: CONFIDENT # of Vehicles: 2.00 Unit 2
Trav Dir:
EAST
W
Veh Act:
LEFT TURN
STRAIGHT AHEAD
PICKUP TRUCK
PASSENGER CAR
17
23
M
M
NORMAL
NORMAL
Cont Fact
FAIL TO YIELD ROW
NO IMPROPER DRIVING
Cont Fact
NOT SPECIFIED
NOT SPECIFIED
Age: Gender: Cond:
10/19/2012
000+00.510
First Event: ON ROADWAY
4_6 LANES UNDIV 2_WAY STRAIGHT AND LEVEL COLL W/MV IN TRANSPORT WET DARK - STREET LIGHTS ON RAIN NOT SPECIFIED
Unit 1
Veh Type:
Sys: 05-MSAS
MnCMAT 1.0.0
Unit 3
Page 15 of 21
Crash ID: 093030148 County: ST LOUIS
Time: 1310
Date: 10/30/2009 City: DULUTH
Route: 10400156
Severity: PROPERTY DAMAGE Road Type: Road Char: Crash Type: Surf Cond: Light Cond: Weather 1: Weather 2:
Sys: 05-MSAS
000+00.018
First Event: ON ROADWAY
2 LANES UNDIV 2_WAY STRAIGHT AND LEVEL COLL W/MV IN TRANSPORT DRY DAYLIGHT CLEAR CLEAR
To Junction: INTERSECTION-RELATED Traffic Device: TRAFFIC SIGNALS Speed Limit: 30 Diagram: REAR END Officer: Reliability: CONFIDENT # of Vehicles: 3.00
Unit 1
Unit 2
Unit 3
Trav Dir:
S
S
S
Veh Act:
STRAIGHT AHEAD
STRAIGHT AHEAD
STRAIGHT AHEAD
PASSENGER CAR
PASSENGER CAR
PASSENGER CAR
18
44
21
F
M
M
NORMAL
NORMAL
NORMAL
Cont Fact
NOT SPECIFIED
NOT SPECIFIED
NO IMPROPER DRIVING
Cont Fact
NOT SPECIFIED
NOT SPECIFIED
NOT SPECIFIED
Veh Type: Age: Gender: Cond:
Crash ID: 100250017 County: ST LOUIS
Time: 2102
Date: 01/24/2010 City: DULUTH
Route: 10400156
Severity: PROPERTY DAMAGE Road Type: Road Char: Crash Type: Surf Cond: Light Cond: Weather 1: Weather 2:
Trav Dir:
S
Veh Act:
LEFT TURN
Veh Type: Age: Gender: Cond:
To Junction: 4-LEGGED INTERSECTION Traffic Device: TRAFFIC SIGNALS Speed Limit: 30 Diagram: RAN OFF ROAD - RIGHT SIDE Officer: Reliability: CONFIDENT # of Vehicles: 1.00 Unit 2
Unit 3
PASSENGER CAR 18 F NORMAL
Cont Fact
WEATHER
Cont Fact
NOT SPECIFIED
10/19/2012
000+00.000
First Event: OFF ROADWAY ON ROADSIDE
2 LANES UNDIV 2_WAY STRAIGHT AND LEVEL COLL W/TRAFFIC SIGNAL SLUSH DAYLIGHT SLEET/HAIL/FREEZE-RAIN SNOW
Unit 1
Sys: 05-MSAS
MnCMAT 1.0.0
Page 16 of 21
Crash ID: 100260023 County: ST LOUIS
Time: 1057
Date: 01/25/2010 City: DULUTH
Route: 10400156
Severity: PROPERTY DAMAGE Road Type: Road Char: Crash Type: Surf Cond: Light Cond: Weather 1: Weather 2:
To Junction: INTERSECTION-RELATED Traffic Device: STOP SIGN OTHER Speed Limit: 30 Diagram: LEFT TURN INTO TRAFFIC Officer: Reliability: BEST GUESS # of Vehicles: 2.00 Unit 2
Trav Dir:
N
W
Veh Act:
STRAIGHT AHEAD
LEFT TURN
PASSENGER CAR
PASSENGER CAR
23
21
F
F
NORMAL
NORMAL
Cont Fact
SKIDDING
FAIL TO YIELD ROW
Cont Fact
WEATHER
IMPROPER TURN
Age: Gender: Cond:
Crash ID: 100510098 County: ST LOUIS
Road Char: Crash Type: Surf Cond: Light Cond: Weather 1: Weather 2:
Unit 3
Time: 1246
Date: 02/20/2010 City: DULUTH
To Junction: NON-JUNCTION Traffic Device: NOT APPLICABLE Speed Limit: 30 Diagram: OTHER Officer: Reliability: BEST GUESS # of Vehicles: 2.00 Unit 2
Trav Dir:
EAST
W
Veh Act:
STRAIGHT AHEAD
STRAIGHT AHEAD
PASSENGER CAR
PICKUP TRUCK
53
49
F
M
NORMAL
NORMAL
Cont Fact
OTHER
NO IMPROPER DRIVING
Cont Fact
NOT SPECIFIED
NOT SPECIFIED
Age: Gender: Cond:
10/19/2012
000+00.000
First Event: ON ROADWAY
2 LANES UNDIV 2_WAY STRAIGHT AND LEVEL COLL W/DEER DRY DAYLIGHT CLOUDY NOT SPECIFIED
Unit 1
Veh Type:
Sys: 05-MSAS Route: 10400156
Severity: PROPERTY DAMAGE Road Type:
000+00.000
First Event: ON ROADWAY
2 LANES UNDIV 2_WAY STRAIGHT AT HILLCREST COLL W/MV IN TRANSPORT SNOW DAYLIGHT SLEET/HAIL/FREEZE-RAIN CLOUDY
Unit 1
Veh Type:
Sys: 05-MSAS
MnCMAT 1.0.0
Unit 3
Page 17 of 21
Crash ID: 102860237 County: ST LOUIS
Time: 1354
Date: 10/13/2010 City: DULUTH
Route: 10400155
Severity: PROPERTY DAMAGE Road Type: Road Char: Crash Type: Surf Cond: Light Cond: Weather 1: Weather 2:
To Junction: INTERSECTION-RELATED Traffic Device: TRAFFIC SIGNALS Speed Limit: 30 Diagram: REAR END Officer: Reliability: CONFIDENT # of Vehicles: 2.00 Unit 2
Trav Dir:
W
W
Veh Act:
STOPPED TRAFFIC
STRAIGHT AHEAD
PASSENGER CAR
PICKUP TRUCK
21
30
F
M
NORMAL
NORMAL
Cont Fact
NO IMPROPER DRIVING
FOLLOWING TOO CLOSELY
Cont Fact
NOT SPECIFIED
NOT SPECIFIED
Age: Gender: Cond:
Crash ID: 103000125 County: ST LOUIS
Road Char: Crash Type: Surf Cond: Light Cond: Weather 1: Weather 2:
Unit 3
Time: 1634
Date: 10/21/2010 City: DULUTH
To Junction: NON-JUNCTION Traffic Device: TRAFFIC SIGNALS Speed Limit: 30 Diagram: REAR END Officer: Reliability: CONFIDENT # of Vehicles: 2.00 Unit 2
Trav Dir:
S
S
Veh Act:
STRAIGHT AHEAD
STRAIGHT AHEAD
PASSENGER CAR
PASSENGER CAR
19
72
F
F
NORMAL
NORMAL
Cont Fact
DISTRACTION
NO IMPROPER DRIVING
Cont Fact
NOT SPECIFIED
NOT SPECIFIED
Age: Gender: Cond:
10/19/2012
000+00.000
First Event: ON ROADWAY
2 LANES UNDIV 2_WAY STRAIGHT AND LEVEL COLL W/MV IN TRANSPORT DRY DAYLIGHT CLEAR NOT SPECIFIED
Unit 1
Veh Type:
Sys: 05-MSAS Route: 10400156
Severity: POSSIBLE INJURY Road Type:
000+00.524
First Event: ON ROADWAY
2 LANES UNDIV 2_WAY STRAIGHT AND LEVEL COLL W/PARKED MV DRY DAYLIGHT CLEAR NOT SPECIFIED
Unit 1
Veh Type:
Sys: 05-MSAS
MnCMAT 1.0.0
Unit 3
Page 18 of 21
Crash ID: 103370327 County: ST LOUIS
Time: 1650
Date: 12/03/2010 City: DULUTH
Route: 10400155
Severity: POSSIBLE INJURY Road Type: Road Char: Crash Type: Surf Cond: Light Cond: Weather 1: Weather 2:
To Junction: INTERSECTION-RELATED Traffic Device: TRAFFIC SIGNALS Speed Limit: 30 Diagram: REAR END Officer: Reliability: CONFIDENT # of Vehicles: 2.00 Unit 2
Trav Dir:
S
S
Veh Act:
STRAIGHT AHEAD
STRAIGHT AHEAD
PASSENGER CAR
PASSENGER CAR
24
20
M
F
NORMAL
NORMAL
Cont Fact
NO IMPROPER DRIVING
NO IMPROPER DRIVING
Cont Fact
NOT SPECIFIED
NOT SPECIFIED
Age: Gender: Cond:
Crash ID: 103600226 County: ST LOUIS
Road Char: Crash Type: Surf Cond: Light Cond: Weather 1: Weather 2:
Unit 3
Time: 0930
Date: 12/21/2010 City: DULUTH
To Junction: NON-JUNCTION Traffic Device: NOT APPLICABLE Speed Limit: 30 Diagram: SIDESWIPE OPPOSING Officer: Reliability: BEST GUESS # of Vehicles: 2.00 Unit 2
Trav Dir:
SE
W
Veh Act:
STRAIGHT AHEAD
STRAIGHT AHEAD
Veh Type:
VAN OR MINIVAN
PICKUP TRUCK
33
19
M
M
NORMAL
NORMAL
Cont Fact
ILLEGAL SPEED
NO IMPROPER DRIVING
Cont Fact
WEATHER
NOT SPECIFIED
Gender: Cond:
10/19/2012
000+00.000
First Event: ON ROADWAY
2 LANES UNDIV 2_WAY CURVE AND GRADE COLL W/MV IN TRANSPORT SNOW DAYLIGHT SNOW CLOUDY
Unit 1
Age:
Sys: 05-MSAS Route: 10400156
Severity: PROPERTY DAMAGE Road Type:
000+00.520
First Event: ON ROADWAY
4_6 LANES UNDIV 2_WAY STRAIGHT AND LEVEL COLL W/MV IN TRANSPORT SLUSH DARK - STREET LIGHTS ON CLOUDY NOT SPECIFIED
Unit 1
Veh Type:
Sys: 05-MSAS
MnCMAT 1.0.0
Unit 3
Page 19 of 21
Crash ID: 111040073 County: ST LOUIS
Time: 1519
Date: 04/13/2011 City: DULUTH
Route: 10400155
Severity: PROPERTY DAMAGE Road Type: Road Char: Crash Type: Surf Cond: Light Cond: Weather 1: Weather 2:
To Junction: 4-LEGGED INTERSECTION Traffic Device: TRAFFIC SIGNALS Speed Limit: 30 Diagram: REAR END Officer: Reliability: CONFIDENT # of Vehicles: 2.00 Unit 2
Trav Dir:
W
W
Veh Act:
STRAIGHT AHEAD
STRAIGHT AHEAD
PASSENGER CAR
PASSENGER CAR
20
51
F
F
NORMAL
NORMAL
Cont Fact
DISTRACTION
NO IMPROPER DRIVING
Cont Fact
NOT SPECIFIED
NOT SPECIFIED
Age: Gender: Cond:
Crash ID: 113550140 County: ST LOUIS
Road Char: Crash Type: Surf Cond: Light Cond: Weather 1: Weather 2:
Unit 3
Time: 1343
Date: 12/16/2011 City: DULUTH
To Junction: SCHOOL CROSSING Traffic Device: OTHER Speed Limit: 30 Diagram: REAR END Officer: Reliability: CONFIDENT # of Vehicles: 2.00 Unit 2
Trav Dir:
S
S
Veh Act:
STRAIGHT AHEAD
STRAIGHT AHEAD
PASSENGER CAR
PASSENGER CAR
18
20
F
M
NORMAL
NORMAL
Cont Fact
FOLLOWING TOO CLOSELY
NO IMPROPER DRIVING
Cont Fact
DISTRACTION
NOT SPECIFIED
Age: Gender: Cond:
10/19/2012
000+00.018
First Event: OFF ROADWAY ON ROADSIDE
2 LANES UNDIV 2_WAY STRAIGHT AT HILLCREST COLL W/MV IN TRANSPORT DRY DAYLIGHT CLEAR CLEAR
Unit 1
Veh Type:
Sys: 05-MSAS Route: 10400156
Severity: PROPERTY DAMAGE Road Type:
000+00.510
First Event: ON ROADWAY
2 LANES UNDIV 2_WAY STRAIGHT AND LEVEL COLL W/MV IN TRANSPORT DRY DAYLIGHT CLEAR NOT SPECIFIED
Unit 1
Veh Type:
Sys: 05-MSAS
MnCMAT 1.0.0
Unit 3
Page 20 of 21
Selection Filter:
WORK AREA: COUNTY_CODE('69') - FILTER: CRASH_YEAR('2002','2003','2004','2005','2006','2007','2008','2009','2010','2011') - SPATIAL FILTER APPLIED Analyst:
Notes:
Ryan Loos
10/19/2012
MnCMAT 1.0.0
Page 21 of 21
Warrants Analysis - Existing (Year 2012) Volumes
Results
Warrants Analysis
Data
Intersection Control Evaluation Planning Study - College St / Junction Ave / 19th Ave E Arrowhead Regional Development Commission / Duluth-Superior Metropolitan Interstate Council Assumptions Date: Population < 10,000: 70% Factor Used: Minor Approach Right-turns Included: Hour 6 - 7 AM 7 - 8 AM 8 - 9 AM 9 - 10 AM 10 - 11 AM 11 - 12 AM 12 - 1 PM 1 - 2 PM 2 - 3 PM 3 - 4 PM 4 - 5 PM 5 - 6 PM 6 - 7 PM 7 - 8 PM 8 - 9 PM 9 - 10 PM
10/24/2012 No No 100%
Major Major Minor Minor Approach 1 Approach 3 Approach 2 Approach 4 129 5 44 46 511 10 189 75 340 11 146 92 247 38 170 104 264 107 143 131 280 191 138 155 303 215 169 154 353 205 147 134 298 204 155 141 345 280 225 205 403 270 278 253 333 232 221 201 275 177 174 158 207 85 146 133 196 41 130 118 162 16 108 98
Warrant Criteria Warrant 1A: Minimum Vehicular Volume Warrant 1B: Interruption of Continuous Traffic Warrant 1C: Combination of Warrants Warrant 2: Four-hour Vehicular Volume Warrant 3B: Peak Hour Warrant 7: Crash Experience Multi-way Stop Applications (MWSA)
Major Approach 1: Major Approach 3: Minor Approach 2: Minor Approach 4: Total 1+3 134 521 351 285 371 471 518 558 502 625 673 565 452 292 237 178
Total 2+4 90 264 238 274 274 293 323 281 296 430 531 422 332 279 248 206
Approach EB College St WB College St NB 19th Ave SB Junction Ave Largest Minor Appr. 46 189 146 170 143 155 169 147 155 225 278 221 174 146 130 108 Hours Met 2 0 0 0 0 N/A 11
Speed (mph) 30 30 30 30
Conditon A 600 200
X X
Condition B 900 100
X X X
Hours Required 8 8 8 4 1 8 8
X X X X X X X X X X X X X X X
Condition C 720 160 X X
X
X X X X
Warrant 7 N/A N/A
Lanes 2 or more 2 or more 2 or more 2 or more MWSA 300 200 X X X X X X X X X X X
Met/Not Met Not Met Not Met Not Met Not Met Not Met N/A Met - Multiway Stop Applications
X X X X X X X X X X X X X X X
Warrants Analysis - Existing (Year 2012) Volumes
Intersection Control Evaluation Planning Study - College St / Junction Ave / 19th Ave E Arrowhead Regional Development Commission / Duluth-Superior Metropolitan Interstate Council
WARRANT 2: Four-hour Vehicular Volume 500
Largest Minor Approach Volume (vph)
400
300
200
100
0 0
100
200
300
400
500
600
700
800
900
1,000
1,100
1,200
1,300
1,400
Major Street Total Approach Volume (vph) 2 or More Lanes (Major) / 2 or More Lanes (Minor)
Approach Volumes
Note: 115 vph applies as the lower threshold volume for a minor-street approach with two or more lanes and 80 vph applies as the lower threshold volume for a minor-street approach with one lane.
1,500
Warrants Analysis - Existing (Year 2012) Volumes
Intersection Control Evaluation Planning Study - College St / Junction Ave / 19th Ave E Arrowhead Regional Development Commission / Duluth-Superior Metropolitan Interstate Council
WARRANT 3B: Peak Hour 500
Largest Minor Approach Volume (vph)
400
300
200
100
0 0
100
200
300
400
500
600
700
800
900
1,000
1,100
1,200
1,300
1,400
Major Street Total Approach Volume (vph) 2 or More Lanes (Major) / 2 or More Lanes (Minor)
Approach Volumes
Note: 150 vph applies as the lower threshold volume for a minor-street approach with two or more lanes and 100 vph applies as the lower threshold volume for a minor-street approach with one lane.
1,500
APPENDIX B
Future Year 2035 Conditions
Intersection Control Evaluation College Street at Junction Avenue and 19th Avenue E
Intersection Control Evaluation Planning Study for the Duluth Area September 2012 to February 2013 Traffic Forecasting Year 2035 daily traffic and peak hour turning movement forecasts were developed at each study intersection. Daily traffic forecasts were developed by referencing: • • •
Historic MnDOT AADTs between year 1995 and year 2011 Year 2012 SRF daily traffic counts Year 2035 daily traffic forecasts published in the Duluth-Superior Long Range Transportation Plan
A trend analysis was conducted to identify outliers in historic traffic counts and observe how well past changes in traffic volumes support the published traffic forecasts. When historic traffic volumes implied that the published forecast is low, the forecast was adjusted up; otherwise the published traffic forecast was assumed. When an adjustment was warranted, a yearly growth rate based on the published forecast was applied to the year 2012 SRF traffic count. Peak hour turning movement forecasts were developed based on: • •
Year 2012 SRF daily and peak hour turning movement traffic counts Year 2035 daily traffic forecasts
Year 2035 turning movements were forecasted using TurnsW32 and engineering judgment. Forecast growth was then compared against changes in local land use plans for reasonability.
North Approach College St/Junction Ave/19th Ave E ‐ Duluth, St. Louis County, MN 30,000
25,000
Daily Volume
20,000
MIC Forecasted Daily Volume
15,000
Historical Daily Volumes Forecasted Trendline Historical Trendline
10,000
5,000
0 1995
2005
2015
2025
Year
2035
2045
South Approach College St/Junction Ave/19th Ave E ‐ Duluth, St. Louis County, MN 30,000
25,000
Daily Volume
20,000
MIC Forecasted Daily Volume
15,000
Historical Daily Volumes Forecasted Trendline Historical Trendline
10,000
5,000
0 1995
2005
2015
2025
Year
2035
2045
East Approach College St/Junction Ave/19th Ave E ‐ Duluth, St. Louis County, MN 30,000
25,000
Daily Volume
20,000
MIC Forecasted Daily Volume
15,000
Historical Daily Volumes Forecasted Trendline Historical Trendline
10,000
5,000
0 1995
2005
2015
2025
Year
2035
2045
West Approach College St/Junction Ave/19th Ave E ‐ Duluth, St. Louis County, MN 30,000
25,000
Daily Volume
20,000
MIC Forecasted Daily Volume
15,000
Historical Daily Volumes Forecasted Trendline Historical Trendline
10,000
5,000
0 1995
2005
2015
2025
Year
2035
2045
Timings 1: College St & Junction Ave
Lane Group Lane Configurations Volume (vph) Turn Type Protected Phases Permitted Phases Detector Phase Switch Phase Minimum Initial (s) Minimum Split (s) Total Split (s) Total Split (%) Yellow Time (s) All-Red Time (s) Lost Time Adjust (s) Total Lost Time (s) Lead/Lag Lead-Lag Optimize? Recall Mode Act Effct Green (s) Actuated g/C Ratio v/c Ratio Control Delay Queue Delay Total Delay LOS Approach Delay Approach LOS
Year 2035 No-Build - AM Peak 1/31/2013
EBL
EBT
WBL
WBT
NBT
SBT
190 pm+pt 5 2 5
335
10 pm+pt 1 6 1
230
140
20
6
8
4
6
8
4
5.0 14.0 15.0 14.6% 3.0 2.0 0.0 5.0 Lead Yes None 32.8 0.43 0.49 18.9 0.0 18.9 B
10.0 34.5 39.5 38.5% 3.5 2.0 0.0 5.5 Lag Yes None 30.7 0.40 0.57 22.4 0.0 22.4 C 21.3 C
5.0 10.0 15.0 14.6% 3.0 2.0 0.0 5.0 Lead Yes None 23.4 0.31 0.03 13.6 0.0 13.6 B
10.0 21.5 28.5 27.8% 3.5 2.0 0.0 5.5 Lag Yes None 17.7 0.23 0.67 34.8 0.0 34.8 C 34.1 C
10.0 22.5 25.5 24.9% 3.5 2.0 0.0 5.5
10.0 22.5 22.5 22.0% 3.5 2.0 0.0 5.5
None 20.7 0.27 0.84 47.3 0.0 47.3 D 47.3 D
None 10.6 0.14 0.35 18.6 0.0 18.6 B 18.6 B
2 2
Intersection Summary Cycle Length: 102.5 Actuated Cycle Length: 76.3 Natural Cycle: 90 Control Type: Actuated-Uncoordinated Maximum v/c Ratio: 0.84 Intersection Signal Delay: 31.2 Intersection Capacity Utilization 65.8% Analysis Period (min) 15 Splits and Phases:
Intersection LOS: C ICU Level of Service C
1: College St & Junction Ave
College St/Junction Ave/19th Ave E SRF Consulting Group, Inc.
Page 1
Timings 1: College St & Junction Ave
Lane Group Lane Configurations Volume (vph) Turn Type Protected Phases Permitted Phases Detector Phase Switch Phase Minimum Initial (s) Minimum Split (s) Total Split (s) Total Split (%) Yellow Time (s) All-Red Time (s) Lost Time Adjust (s) Total Lost Time (s) Lead/Lag Lead-Lag Optimize? Recall Mode Act Effct Green (s) Actuated g/C Ratio v/c Ratio Control Delay Queue Delay Total Delay LOS Approach Delay Approach LOS
Year 2035 No-Build - PM Peak 1/31/2013
EBL
EBT
WBL
WBT
NBT
SBT
145 pm+pt 5 2 5
225
45 pm+pt 1 6 1
395
65
70
6
8
4
6
8
4
5.0 14.0 15.0 14.6% 3.0 2.0 0.0 5.0 Lead Yes None 37.7 0.42 0.58 25.2 0.0 25.2 C
10.0 34.5 39.5 38.5% 3.5 2.0 0.0 5.5 Lag Yes None 31.5 0.35 0.64 29.4 0.0 29.4 C 28.2 C
5.0 10.0 15.0 14.6% 3.0 2.0 0.0 5.0 Lead Yes None 30.5 0.34 0.16 16.6 0.0 16.6 B
10.0 21.5 28.5 27.8% 3.5 2.0 0.0 5.5 Lag Yes None 23.9 0.27 0.91 56.5 0.0 56.5 E 52.6 D
10.0 22.5 25.5 24.9% 3.5 2.0 0.0 5.5
10.0 22.5 22.5 22.0% 3.5 2.0 0.0 5.5
None 18.0 0.20 0.83 55.3 0.0 55.3 E 55.3 E
None 17.2 0.19 0.96 66.6 0.0 66.6 E 66.6 E
2 2
Intersection Summary Cycle Length: 102.5 Actuated Cycle Length: 90 Natural Cycle: 90 Control Type: Actuated-Uncoordinated Maximum v/c Ratio: 0.96 Intersection Signal Delay: 48.3 Intersection Capacity Utilization 84.2% Analysis Period (min) 15 Splits and Phases:
Intersection LOS: D ICU Level of Service E
1: College St & Junction Ave
College St/Junction Ave/19th Ave E SRF Consulting Group, Inc.
Page 1
Warrants Analysis - Future (Year 2035) Volumes
Results
Warrants Analysis
Data
Intersection Control Evaluation Planning Study - College St / Junction Ave / 19th Ave E Arrowhead Regional Development Commission / Duluth-Superior Metropolitan Interstate Council Assumptions Date: Population < 10,000: 70% Factor Used: Minor Approach Right-turns Included: Hour 6 - 7 AM 7 - 8 AM 8 - 9 AM 9 - 10 AM 10 - 11 AM 11 - 12 AM 12 - 1 PM 1 - 2 PM 2 - 3 PM 3 - 4 PM 4 - 5 PM 5 - 6 PM 6 - 7 PM 7 - 8 PM 8 - 9 PM 9 - 10 PM
10/24/2012 No No 100%
Major Major Minor Minor Approach 1 Approach 3 Approach 2 Approach 4 183 8 42 52 725 15 182 86 482 17 141 106 350 59 164 119 374 165 138 151 396 294 133 178 430 331 163 177 500 316 142 154 423 314 149 162 489 431 217 235 570 416 268 291 471 357 213 231 390 273 168 182 293 131 141 153 278 63 125 136 229 25 104 113
Warrant Criteria Warrant 1A: Minimum Vehicular Volume Warrant 1B: Interruption of Continuous Traffic Warrant 1C: Combination of Warrants Warrant 2: Four-hour Vehicular Volume Warrant 3B: Peak Hour Warrant 7: Crash Experience Multi-way Stop Applications (MWSA)
Major Approach 1: Major Approach 3: Minor Approach 2: Minor Approach 4: Total 1+3 191 740 499 409 539 691 761 816 737 920 986 829 662 424 341 254
Total 2+4 95 268 246 283 288 311 340 295 311 452 559 444 350 293 261 217
Approach EB College St WB College St NB 19th Ave SB Junction Ave Largest Minor Appr. 52 182 141 164 151 178 177 154 162 235 291 231 182 153 136 113 Hours Met 3 2 6 2 0 N/A 14
Speed (mph) 30 30 30 30
Conditon A 600 200
Condition B 900 100
X
X X X X X X X X
X X X
X X
Hours Required 8 8 8 4 1 8 8
X X X X X X X X X X X X X X X
Condition C 720 160 X
X X
X X X X X X
X X X X X X X
Warrant 7 N/A N/A
Lanes 2 or more 2 or more 2 or more 2 or more MWSA 300 200 X X X X X X X X X X X X X X
Met/Not Met Not Met Not Met Not Met Not Met Not Met N/A Met - Multiway Stop Applications
X X X X X X X X X X X X X X X
Warrants Analysis - Future (Year 2035) Volumes
Intersection Control Evaluation Planning Study - College St / Junction Ave / 19th Ave E Arrowhead Regional Development Commission / Duluth-Superior Metropolitan Interstate Council
WARRANT 2: Four-hour Vehicular Volume 500
Largest Minor Approach Volume (vph)
400
300
200
100
0 0
100
200
300
400
500
600
700
800
900
1,000
1,100
1,200
1,300
1,400
Major Street Total Approach Volume (vph) 2 or More Lanes (Major) / 2 or More Lanes (Minor)
Approach Volumes
Note: 115 vph applies as the lower threshold volume for a minor-street approach with two or more lanes and 80 vph applies as the lower threshold volume for a minor-street approach with one lane.
1,500
Warrants Analysis - Future (Year 2035) Volumes
Intersection Control Evaluation Planning Study - College St / Junction Ave / 19th Ave E Arrowhead Regional Development Commission / Duluth-Superior Metropolitan Interstate Council
WARRANT 3B: Peak Hour 500
Largest Minor Approach Volume (vph)
400
300
200
100
0 0
100
200
300
400
500
600
700
800
900
1,000
1,100
1,200
1,300
1,400
Major Street Total Approach Volume (vph) 2 or More Lanes (Major) / 2 or More Lanes (Minor)
Approach Volumes
Note: 150 vph applies as the lower threshold volume for a minor-street approach with two or more lanes and 100 vph applies as the lower threshold volume for a minor-street approach with one lane.
1,500
APPENDIX C
Phase I – Scoping
Intersection Control Evaluation College Street at Junction Avenue and 19th Avenue E
Intersection Control Evaluation Planning Study for the Duluth Area September 2012 to February 2013 Scoping – Phase I 1. Data Collection 2. Traffic Forecasts 3. Year 2012 Existing Conditions • What is the existing intersection control? • What is the existing functional classification? • What are the posted approach speeds? • Where are the nearest signalized intersection(s)? • Is there any site specific considerations? • Are existing operations acceptable? • Is all-way stop control or traffic signal control warranted? • What is the existing crash history? • Is the existing crash rate higher than the average? 4. Year 2030 No-Build Conditions • Are future no-build operations acceptable? • Is all-way stop control or traffic signal control warranted? 5. Concept Development • All-way Stop Control (assumes no more than 2-lanes of approach) • Roundabout Control o Single-lane Roundabout o Hybrid Roundabout (assumes 2-lanes entering, 1-lane exiting) o Multi-lane Roundabout • Traffic Signal Control (assumes left-turn lanes on all approaches at minimum) • Alternative Intersections (FHWA) o Median U-Turn(s) o Restricted Crossing U-Turn(s) o Others? 6. Year 2035 Preliminary Screening • Are the concept operations acceptable (V/C < 0.85)? 7. Prospective Alternative(s) • Identify alternative(s) to be evaluated in Alternatives Selection – Phase II 8. Phase II Considerations • Identify additional evaluation criteria for Alternatives Selection – Phase II
3/22/2013
College St/Junction Ave/19th Ave E Intersection Control Evaluation Planning Study ARDC/Duluth‐Superior MIC Intersection Control Evaluation (ICE) Scoping – Phase I
1
College St/Junction Ave/19th Ave E
Study Intersection
2
1
3/22/2013
College St/Junction Ave/19th Ave E
Background • • • • • • • • •
Jurisdiction is City of Duluth (all MSA routes). Coordinate with UMD for potential gateway to campus. The fire station (NE quadrant) is exploring potential relocation. Intersection is particularly busy during school hours and has heavy pedestrian and bicycle volumes. Consider campus connectivity. Evaluate impacts to access to Aftenro Home in SW quadrant. Building has been removed in NW quadrant. College St striped as two lane with dedicated bike lane. Currently has a WB to NB channelized right‐turn with yield condition.
3
College St/Junction Ave/19th Ave E
Existing Year 2012 Conditions V/C (A.M. Peak)
V/C (P.M. Peak)
Northbound
0.69
0.70
Southbound
0.27
0.75
Eastbound
0.47
0.59
Westbound
0.57
0.71
Approach
4
2
3/22/2013
College St/Junction Ave/19th Ave E
Crash History Crash History (2002‐2011)
Total Crashes =
40
Existing Crash Rate =
0.9 / MEV
Expected Rate =
0.6 / MEV
5
College St/Junction Ave/19th Ave E
Year 2035 No‐Build Conditions Approach
V/C (A.M. Peak)
V/C (P.M. Peak)
Northbound
0.84
0.83
Southbound
0.35
0.96
Eastbound
0.57
0.64
Westbound
0.67
0.91
6
3
3/22/2013
College St/Junction Ave/19th Ave E
Warrants Analysis Type of Control
Existing Year 2012
Future Year 2035
All‐way Stop Control
Warranted
Warranted
Traffic Signal Control
Not Warranted
Not Warranted
Assumptions: • 100% Volume Thresholds • 2 Lanes (Major Approach)/2 Lanes (Minor Approach)
7
College St/Junction Ave/19th Ave E
Concept Development 1. All‐way Stop – NB/SB Realigned (left‐turn/thru, thru/right‐turn) 2. Single‐lane Roundabout 3. Hybrid Roundabout (2‐lanes entering, 1‐lane exiting) 4. Multi‐lane Roundabout 5. Traffic Signal – NB/SB Realigned (left‐turn, thru/right‐turn)
8
4
3/22/2013
College St/Junction Ave/19th Ave E
Year 2035 Preliminary Screening Concept
V/C (A.M. Peak)
V/C (P.M. Peak)
1. All‐way Stop Realigned (LT/T, T/RT)
0.75
0.66
2. Single‐lane Roundabout
0.67
0.69
3. Hybrid Roundabout (2‐entry, 1‐exit)
0.56
0.66
4. Multi‐lane Roundabout
0.36
0.45
5. Traffic Signal Realigned (LT, T/RT)
0.58
0.75
9
College St/Junction Ave/19th Ave E
Prospective Alternative(s) 1. All‐way Stop – NB/SB Realigned (left‐turn/thru, thru/right‐turn) 2. Single‐lane Roundabout 3. Hybrid Roundabout (2‐lanes entering, 1‐lane exiting) 4. Multi‐lane Roundabout 5. Traffic Signal – NB/SB Realigned (left‐turn, thru/right‐turn)
10
5
3/22/2013
College St/Junction Ave/19th Ave E
Phase II Considerations… • • • • •
Reduce rear end crashes System consistency Pedestrian/bicycle accommodations Off‐peak operations Other?
11
6
APPENDIX D
Phase II – Alternative Selection
Intersection Control Evaluation College Street at Junction Avenue and 19th Avenue E
Intersection Control Evaluation Planning Study for the Duluth Area September 2012 to February 2013 Alternative Selection – Phase II 1. Site Specific Considerations • Operations • Volume patterns • Crash history • Pedestrian/bicycle needs • System considerations • Adjacent land use considerations • Topography/sight distance issues 2. Prospective Alternative(s) • Identify alternative(s) carried forward from Scoping – Phase I 3. Detailed Operations Analysis • Conduct Synchro/SimTraffic and/or VISSIM analysis • How long will existing conditions operate acceptably? • When is traffic signal control warranted? • How long could a scaled-back alternative operate acceptably? 4. Comparison of Alternatives • Identify advantage(s) and disadvantage(s) • Compare site specific considerations 5. Recommendation(s)
1/31/2013
College St/Junction Ave/19th Ave E Intersection Control Evaluation Planning Study ARDC/Duluth‐Superior MIC Intersection Control Evaluation (ICE) Alternative Selection – Phase II
1
College St/Junction Ave/19th Ave E
Site Specific Considerations • Existing traffic signal is not operationally acceptable long term (10‐15 years) without geometric improvements. • High crash rate with mostly rear end crashes. • All legs are designated on‐street bike routes. • Heavy pedestrian and bicycle volumes. • Fire station in NE quadrant (pre‐empts traffic signal).
2
1
1/31/2013
College St/Junction Ave/19th Ave E
Site Specific Considerations (cont.) • West entrance to UMD campus. • Consider access impacts to Afterno Home in SW quadrant.
3
College St/Junction Ave/19th Ave E
Prospective Alternatives 1. Roundabout Alternative (Single‐lane)* 2. Revised Traffic Signal Alternative • • •
Realign NB/SB approaches Eliminate channelized WBR Eliminate split phasing
* Hybrid roundabout control was carried forward from the scoping phase; however, further analysis indicated the reduced‐lane design is adequate. 4
2
1/31/2013
Alternative 1: Roundabout Alternative (Single‐lane)
5
Alternative 2: Revised Traffic Signal Alternative
6
3
1/31/2013
Comparison
7
College St/Junction Ave/19th Ave E
Comparison of Alternatives Alternative 1 Roundabout (Single‐lane) Advantage(s) •
•
•
Proven safety strategy to reduce crash severity Reduces pedestrian crossing exposure Opportunity for “gateway” to UMD campus
Alternative 2 Revised Traffic Signal
Disadvantage(s) •
Could impact emergency response times (no exclusive pre‐emption)
•
Impacts access to Afterno Home
•
High ROW impacts
Advantage(s) •
Similar control to existing conditions
•
Allows for emergency vehicle pre‐emption
•
Minimal ROW impacts
Disadvantage(s) •
Warranted in 10‐15 years
•
Can increase rear end crashes
8
4
1/31/2013
College St/Junction Ave/19th Ave E
Summary 1. Roundabout Alternative (Single‐lane) • • •
Proven safety strategy to reduce crash severity Reduces pedestrian crossing exposure Opportunity for “gateway” to UMD campus
2. Revised Traffic Signal Alternative • •
Warranted in 10‐15 years Can increase rear end crashes
9
5
APPENDIX E
Alternatives Analysis
Intersection Control Evaluation College Street at Junction Avenue and 19th Avenue E
Single-Lane Roundabout Alternative (Year 2035) Intersection Control Evaluation Planning Study - College St / Junction Ave / 19th Ave Arterial MOEs (A.M. Peak Hour)
Approach
Northbound
Southbound
Eastbound
Westbound
Movement Left Thru Right Left Thru Right Left Thru Right Left Thru Right
Volume (vph) 169 140 68 10 18 65 194 327 49 10 225 34
Average Queue (ft) 24 24 25 1 1 1 0 0 0 7 7 8
Maximum Queue (ft) 199 200 199 36 37 38 31 32 28 94 99 107
Movement Delay (sec/veh) 12.1 12.2 11.7 2.7 3.2 2.9 3.5 3.4 2.7 7.8 7.2 6.3
Movement LOS B B B A A A A A A A A A
Approach Delay (sec/veh)
Approach LOS
12.0
B
2.9
A
Overall Delay (sec/veh)
6.6 3.4
A
7.1
A
Overall LOS
A
Target Volume (vph) 175 140 65 10 20 65 190 335 50 10 230 35
Simulated Volume (vph) 169 140 68 10 18 65 194 327 49 10 225 34
Difference
% Difference
GEH
(vph) -6 0 3 0 -2 0 4 -8 -1 0 -5 -1
-3.4% 0.0% 4.6% 0.0% -10.0% 0.0% 2.1% -2.4% -2.0% 0.0% -2.2% -2.9%
0.5 0.0 0.3 0.1 0.5 0.0 0.3 0.5 0.2 0.1 0.3 0.1
11/27/2012
Single-Lane Roundabout Alternative (Year 2035) Intersection Control Evaluation Planning Study - College St / Junction Ave / 19th Ave Arterial MOEs (P.M. Peak Hour)
Approach
Northbound
Southbound
Eastbound
Westbound
Movement Left Thru Right Left Thru Right Left Thru Right Left Thru Right
Volume (vph) 168 68 34 34 71 247 150 226 140 46 390 18
Average Queue (ft) 5 4 4 41 42 43 1 1 1 16 17 20
Maximum Queue (ft) 84 78 82 219 226 228 55 54 54 185 199 228
Movement Delay (sec/veh) 5.7 5.3 5.3 15.9 17.8 18.1 4.2 4.1 3.6 10.0 9.5 9.3
Movement LOS A A A C C C A A A A A A
Approach Delay (sec/veh)
Approach LOS
5.6
A
17.8
C
Overall Delay (sec/veh)
8.9 4.0
A
9.5
A
Overall LOS
A
Target Volume (vph) 175 65 35 35 70 250 145 225 150 45 395 20
Simulated Volume (vph) 168 68 34 34 71 247 150 226 140 46 390 18
Difference
% Difference
GEH
(vph) -7 3 -1 -2 1 -3 5 1 -10 1 -5 -2
-4.0% 4.6% -2.9% -5.7% 1.4% -1.2% 3.4% 0.4% -6.7% 2.2% -1.3% -10.0%
0.5 0.4 0.2 0.3 0.1 0.2 0.4 0.1 0.8 0.2 0.2 0.5
11/27/2012
SimTraffic Performance Report Traffic Signal Alternative (Year 2035) - AM Peak
11/18/2012
1: College St & Junction Ave Performance by movement Movement Delay / Veh (s)
EBL 18.6
EBT 13.3
EBR 8.7
WBL 16.3
WBT 20.2
WBR 14.9
NBL 22.0
NBT 18.4
NBR 10.9
SBL 25.6
SBT 28.5
SBR 7.8
1: College St & Junction Ave Performance by movement Movement Delay / Veh (s)
All 16.7
Total Network Performance Delay / Veh (s)
College St / Junction Ave / 19th Ave SRF Consulting Group/LGarnass
18.5
SimTraffic Report Page 1
Queuing and Blocking Report Traffic Signal Alternative (Year 2035) - AM Peak
11/18/2012
Intersection: 1: College St & Junction Ave Movement Directions Served Maximum Queue (ft) Average Queue (ft) 95th Queue (ft) Link Distance (ft) Upstream Blk Time (%) Queuing Penalty (veh) Storage Bay Dist (ft) Storage Blk Time (%) Queuing Penalty (veh)
EB L 149 70 117
215 0 0
EB TR 287 113 199 994
WB L 34 7 29
WB TR 246 108 201 957
215 1 1
NB L 145 74 122
NB TR 174 76 145 897
215 0 0
SB L 45 9 32
SB TR 96 43 77 860
215 0 0
Network Summary Network wide Queuing Penalty: 1
College St / Junction Ave / 19th Ave SRF Consulting Group/LGarnass
SimTraffic Report Page 2
SimTraffic Performance Report Traffic Signal Alternative (Year 2035) - PM Peak
11/18/2012
1: College St & Junction Ave Performance by movement Movement Delay / Veh (s)
EBL 29.4
EBT 21.1
EBR 14.2
WBL 22.6
WBT 30.6
WBR 25.0
NBL 40.6
NBT 23.0
NBR 9.4
SBL 23.9
SBT 32.6
SBR 20.2
1: College St & Junction Ave Performance by movement Movement Delay / Veh (s)
All 26.0
Total Network Performance Delay / Veh (s)
College St / Junction Ave / 19th Ave SRF Consulting Group/LGarnass
27.9
SimTraffic Report Page 1
Queuing and Blocking Report Traffic Signal Alternative (Year 2035) - PM Peak
11/18/2012
Intersection: 1: College St & Junction Ave Movement Directions Served Maximum Queue (ft) Average Queue (ft) 95th Queue (ft) Link Distance (ft) Upstream Blk Time (%) Queuing Penalty (veh) Storage Bay Dist (ft) Storage Blk Time (%) Queuing Penalty (veh)
EB L 153 74 128
215 0 0
EB TR 300 143 254 994
WB L 126 27 61
WB TR 429 215 360 957
215 2 3
9 4
NB L 221 106 191
215 0 0
NB TR 145 52 105 897
SB L 70 22 54
SB TR 332 145 258 860
215 2 1
Network Summary Network wide Queuing Penalty: 8
College St / Junction Ave / 19th Ave SRF Consulting Group/LGarnass
SimTraffic Report Page 2
Appendix C – Listening Session Meeting Notes (May 6, 2015)
132
Memo
Listening Session #1 Time: 9:00a.m. (5/6/15) Group: Lisa Erwin, Vice Chancellor for Student Life Attendance: Corbin Smyth (Student Life); Lisa Erwin (Student Life); Patrick Keenan (Student Life); Lance Bernard (SRF); BrieAnna Simon (SRF)
Key Talking Points
Lance questioned what staff is intending to hear from the public. o Need to recognize each campus is unique in developing parking solutions. o Provided a brief summary of what SRF does and past experiences in relation to parking.
Future Presentations: o Corbin proposed highlighting “pink and purple” permits in the threshold table in order to clarify which permit areas are being referenced. o Important to note individuals may use common lot descriptors over designated lot names. o The new science building (CAMS) and its parking impacts should be discussed. o Key department staff will provide a unique outlook on parking needs to meet departmental/institutional needs.
Threshold Data: o Corbin questioned low utilization of on-street parking shown within the graphic. Lance described the analysis process moving forward to clean up any anomalies that might occur since this area is “out of our control.” o Patrick agreed that since the City of Duluth owns and maintains the onstreet parking this area is out of the campus’s control. However, it is important to understand this tends to be one of the first places people go to park since it is free parking all day long – except overnight (Nov. – May)
Traffic Counts from the City and MnDOT:
o Figures do not address capacity, but capacity issues may be an additional area to look into. o Lisa asked what percentage is relative to traffic entering the campus shown in the traffic count figure. Lance explained traffic counts are representing a corridor utilization.
Parking Structure: o The study needs to address the possibility of a parking structure or other viable solutions over a ramp. The Chancellor is very interested in a ramp. o However, Lisa feels a parking ramp is out of reach due to the cost.
Forecast Enrollment: o Understand the given project equates to 1 – 2% annual average growth over the next 10 years. o Lisa feels this is an optimistic enrollment projection, which would not meet the demand for a parking ramp. o This projection poses other concerns in addition to parking, such as classroom capacity. o Projection numbers need to be refined.
Future Opportunities: o Concerns were expressed with where CAMS and University Ave will be located. The relocation of University Ave could result in a greater reduction in parking. Scenario testing and phasing of implementation strategies will help address these concerns. o Recreational area (baseball fields) will be an issue to overcome for potential parking facility locations. o Encourage electronic solutions for meters. The study needs to explore how electronic solutions fit within the big picture. Electronic solutions may be feasible, but will need to redesign lots in order to close access points.
Lance asked staff what the feasibility of alternative modes of transportation such as transit, bike and pedestrian are on campus. o The strategic plan encourages the utilization of other modes of transportation; however, push back will be seen due to culture, weather, and terrain. o Lance also asked what opportunities may be feasible to intentionally reduce parking capacity to focus on transit or other non-car dependent solutions with benchmarking goals.
Would need to compare competitors in a peer review to determine what typical benchmarking is being used for other campuses of this size.
Additional Information o Lisa requested a study update, which could be presented to the cabinet. Lance will work with Patrick and Corbin to pull together this update.
Listening Session #2 Time: 10:00 a.m. (5/6/15) Group: Campus Partners Departments in Attendance: Housing and Residence Life; Career & Internship Services; Athletics; Recreational Sports Outdoor Program; Parking Services; Police Department; Kirby Student Center; Office of Admissions; Dining Services; and, UMD Stores
Key Talking Points
Signage: o Biggest concern for admissions tends to be signage and way finding signs. o Would like clear signing for entrances into buildings from parking lots. Main entrances into buildings are often locked, especially in buildings near Lot B where visitors tend to park. o Have noticed signage pollution (too many signs) along College Street. o Aesthetics related to parking is lacking to help promote a positive first experience when welcoming visitors and the every-day user.
Bus Parking (large events, school groups, athletics, bands, etc.) o Planetarium provides some bus parking; however, this area is not clearly marked for large vehicle parking. o Bagley Nature Area often hosts nature hikes and activities that require bus transportation. o Kirby Drive provides bus access to campus activities throughout the day, which poses some congestion concerns as there are no clear drop off zones. o The question is often raised where buses are to be directed once bus parking is full. Administration often struggles with these questions during both day and evening events. o Would like to see clearly designated areas for vendors with multiple vehicles to pick up, drop off and park.
Pedestrian Infrastructure o Campus master plan outlines specific targets for accessibility in relation to bicycle and pedestrian opportunities. o Would like to see an inviting area created for any type of visits to campus. New entry way into campus would be great! o Area in front of Chester Park has horrible pedestrian infrastructure that tends to reduce encouragement for pedestrian travel. Highest pedestrian mobility point to enter campus tends to be the corner of College Street and Woodland Avenue. However, this is not a clear entrance to campus. o Need to post campus maps (wayfinding signage) highlighting key destinations. Locating these maps in parking facilities will help visitors find their destinations.
Carbon Footprint/Promoting Alternative Modes of Transportation o Currently there have been no high level university decisions made supporting or dismissing sustainable parking caps. o Transportation to and from campus has been identified as a part of the campus’s greenhouse cap. o Concerned with the population’s lack of education for bike/car relationships. o Lance asked what is being done on campus to promote alternative modes of transportation. It is pretty aggressive in pocket areas of campus; however, it is not a priority for the campus due to financial reasons.
Retail parking in front of Kirby Plaza (e.g., K Lot) o Campus residents often park in metered spots, since these spots are not monitored over the weekend. o Faculty have heard from community residents that they would shop at the campus more often; however, it is hard to find short-term parking. o “Farmers Market Wednesdays” often results in summer congested parking near Kirby Plaza outside of the bus hub area.
Security/Safety o For campus residents, a common walk occurs from Darland Administration Building to Kirby Student Center. These walkways are not properly lit at night and do not have blue phones. o Blue phones promote the feeling of security. o UMD has a “Safe Walk Program” to help promote security on campus. o There have been parking lots with identified lighting concerns and lack of security cameras (campus police department can provide). o UMD should increase the size of parking stalls to reduce property damage.
o Students have noted the walk between Lot Q-1 and campus housing feels unsafe due to distance. o Large amount of pedestrians crossing at St. Marie Street near the White Lots pose safety concerns. The amount of pedestrians crossing St. Marie Street often creates traffic and queuing concerns. Students tend to cross midblock between vehicles when traffic is stopped. o DTA bus stop at College Street and Lawn Street pose safety and traffic concerns. Would like to see this stop removed. Traffic and pedestrians cannot see around busses due to angle of Lawn Street.
Parking Lot B o Tends to be the main lot where faculty and students park. o Snow storage in the back of lot can take up 20 plus spaces. Due to the popularity of this lot, this often presents a concern for students and faculty.
Event Parking o Allowing free parking after 5:00pm and on weekends in Gold Lots has been an inviting draw for events on campus. o Athletics and tailgating (primarily football games) Concerned with the amount of trash following tailgating events and the lack of public trash facilities. Tailgating has put an increased demand by fans on the Pay Lot and Maroon Lots near the sports facilities. Staff have noticed cars parked at the ends of the parking lots which prevent turn/loop around travel within the lot. Facility staff indicated UMD staff are on site to help direct traffic. Parking for football games occurs on the surface lots near the field; however, does not allow individuals to park in lots past the tennis courts. Parking staff direct individuals to come in off St. Marie Street. Signs indicate both event parking and lot costs. Parking Lot E and D provide free event parking. This is the 3rd year staff are monitoring and charging for athletic events. Staff has found people also utilizing parking lot R2 for athletic events.
Seem to have enough supply for parking. Parking Lot C usually sells out early on in the year. o Summer Camps/Theater Events Ordean Court turnaround area often hosts 40 plus vehicles picking up/dropping off individuals, which presents a trouble area by blocking the fire lane.
University for Seniors o Drop off/pick up area near Kirby Plaza, along with DTA movements causes some concerns for pedestrians accessing buildings. o Lack of adequate and handicap parking near the University for Seniors often expresses concerns. o Individuals tend to want to leave Kirby Plaza and be picked up at the door.
Metered Parking o University for Seniors with handicap parking permits can park at metered spots for 4 hours, which causes some confusion. o Faculty asked how you can monitor and adjust metered parking to allow for permits. o Faculty questioned what considerations are being looked into for electronic pay stations over single head meters. o On-street parking has a gap in available spots between St. Marie, Junction Ave., and Maplewood Court (view marked map).
“Free” Parking o Key to know parking is never free. Different funding alternatives. o What is the result of non-free busses for faculty and staff versus more cars on campus? (waiting on DTA numbers) At capacity for parking permit sales.
Day Passes o Individuals with Gold Passes have expressed concerns with day pass sales. Tends to be a lack of information provided to pass holders. Used to have visitors parking in White Lots.
Additional Information: o Would like more information on where the annual growth factor came from. o Morning rush around 8:50 a.m. presents the feeling of campus wide congestion.
o Commonly heard from community members, parking is a disincentive for any activity at UMD. o Expectation of students and faculty that parking should be a door-to-door service. o Visitors have provided positive feedback about residential parking opportunities and pricing.
Listening Session #3 Time: 12:00 p.m. (5/6/15) Group: Facilities Subcommittee Attendance: Patrick Keenan (
[email protected]), Mindy Granley (
[email protected]), Gina Pudlick (
[email protected]), Harlan Stech (
[email protected]), Alek Mintz (
[email protected]), Laurie Fosnacht (
[email protected]), David Worley (
[email protected]), Laura Lott (
[email protected]), Jane Hovland (
[email protected]), Mark Nierengarten (
[email protected]), Rebecca Teasley (
[email protected]), BreAnn Graber (Staff Support—
[email protected])
Key Talking Points
Master Plan: o The Master Plan suggests new buildings will be located in current parking lots. Staff asked where these parking spaces will be relocated. o Master plan recommends parking ramps, however not sure a structured parking facility seems to be a feasible option. Faculty asked what opportunity for low-cost/high-benefit solutions are available. o CAMS New Facility Faculty are concerned that the loss of parking will increase pressure on Lot B with this new facility.
Traffic Capacity: o Clarification was asked for on the directional distribution percentages. Lance Bernard, SRF, described the purpose of the figure is to determine the roadway capacity needs around campus. o Lance described how the functionality of each major corridor was used to evaluate corridors within this study. o Staff asked if traffic volumes correlated with the specific time periods used to count parking utilization around campus. Traffic volumes are full day volumes.
Parking Counts: o Request for more detail on count data and pressure points. Lance discussed the process used for collecting, cleaning data, along with the preliminary results found.
Peak Parking Times: o Students and faculty tend to be concerned with the availability of parking during peak times if they must leave a lot then come back to campus. Often occurs in Lot C and D. o Medical students have learned to come to campus early in order to find parking over peak times in Lots A and B. Some staff do not see any difficulties with Lot A since they have not heard any complaints from students not being able to find parking in this lot.
Entrances: o Staff asked if alternate entrances and the removal of multiple entrances to these lots have been considered. Ingres and egress will have to be considered in order to determine the impact on main corridors throughout campus.
Various Modes of Transportation: o Staff asked how seasonal transportation alternatives, such as scooters, are captured within this study. This study takes into account special use and seasonal parking. During seasonal periods, metered areas are used as free parking for both scooters and motorcycle parking.
Campus Facilities: o Medical Patients and Visitors Staff have heard from students and visitors that the lack of metered parking around medical buildings is an inconvenience. Individuals visiting are usually looking for one to two hour parking. Staff have experienced difficulties in providing one-day gold permits for patients/interviewees. o College of Science and Engineering Find it difficult to find parking during peak times for both visitors and alumni utilizing campus. No evident place where speakers or visitors can park for a few hours, which may be a supply issue. Some faculty have found the spots reserved for speakers in the Gold Lots to be pricey. o Planetarium See the need for labeled bus parking near the planetarium for any event. o Residence Halls/Dorms Faculty questioned if we know how many students living on campus have vehicles.
Approximately 1/3 of individuals living in student housing have vehicles. Staff asked about the consideration of a more remote parking solution for students living on campus who do not use their vehicles other than to travel home. How do students living on campus currently view parking? Students want to have door-to-door parking opportunities. However staff’s views on parking does not align. o Example: One solution may be restricting student parking passes to residents living within a few blocks. Faculty questioned if there are opportunities to have a shuttle running to and from remote lots. o Need to consider if individuals are willing to pay for these lots along with shuttle costs. Will have to do a cost analysis to determine the feasibility of having a shuttle. Staff asked what other opportunities to offer incentives to promote other modes of transportation are feasible. o Shuttle busses to local residential areas would be beneficial. o University of Seniors Individuals have expressed concerns about walking long distances due to parking far away. o Baseball Fields Concerns with students running through fields in order to have a straight path to campus. Baseball fields are used during the summer months for camps and community recreation activities.
Special Events o Students and faculty are concerned about leaving/coming to campus during events. o Special events tend to present clashing needs for event visitors verses faculty/students in the search for adequate access and parking during events.
Permitting o See the second half of Lot A as underutilized. Faculty asked if there are opportunities to designate this area as a Maroon Lot. o Free parking on evenings and weekends Great amenity for this campus and for individuals visiting the campus.
Weather Restrictions o Winter parking in Lot B tends to be a concern since snow piles cover a large portion of this lot. Students have had to park in White Lots or Lot W as a result.
Aesthetics/School Identity o No clear identifiers found presenting campus identity or location on campus. o Would like to see green islands, trees, buffers, and storm water solutions incorporated in order to break up surface lots. Faculty asked how are you going to find funding for these investments preserving the environmental features, storm water quality, and aesthetics.
Listening Session #4 Time: 2:30p.m. (5/6/15) Group: Open House for all Students, Faculty and Staff Attendance: 15 total individuals in attendance (2 additional Student Life staff members)
Key Talking Points
Parking Counts o Participants asked what kind of method was used to count the vehicles. Manual labor and cameras. o Participants asked how count times were determined. Most faculty arrive around 8:00a.m. however count times started at 9:00a.m. How strict were count start times? o Participants asked if the metered spaces counted as well. SRF has count detail by lot if data is needed. o Students asked if the number of maroon passes parked in White Lots were considered. Lance explained a more comprehensive look of these lots was a concern. This detail was not taken into consideration.
Permit Structure o A student asked if permitted individuals are accounted for when parking in other lots if the designated lot is at capacity. Lance explained permitting type and policies are being looked into in order to develop a solution for capacity concerns Lance asked the group what type of parking policy the campus is looking for? (For example: a specific lot or color lot or area) o Participants asked if other areas within Duluth, besides other campuses, are being analyzed in comparison to permitting and pricing. Lance discussed how lessons learned from areas such as Macys, however campuses serve other land uses that need to be considered. o Students and faculty often feel as though parking lots are being over sold since often times a permit does not guarantee a spot in certain lots. Inconvenient to drive to other side of campus to try and find a spot if lots are full. o Participants asked if permitting for Maroon Parking Lots within the study area will be accounted for or is a policy going to come into play in order to ensure people get a spot. o Like the idea of the white permit, however weather often prevents the sale of these permits. o Some staff have found they cannot afford the gold parking permit prices.
Parking Goals o Participants questioned what assumptions or given goals are used for each of the lot types. Example does the campus want 100% of faculty to be able to park in Gold Lot or what student percentage is desired in each lot? Faculty also asked what the goals for campus are in order to provide adequate parking for a campus. o Would like job type to be considered for faculty passes. Historically it is perceived passes are dictated by job title over job type. Would like job type taken into consideration if a certain position requires staff to come/go from campus verses staff wanting the conveniences of coming/going from campus.
Pay Lot Facilities o Participants asked what various pay solutions have been evaluated through the study process such as pay machines verses staffing individuals to collect payments. o Participants also asked if it would be beneficial to have someone in the pay lot directing parking in the winter in order to help avoid the loss of parking due to snow.
Parking Lot B o Students and faculty have found if not in Lot B before 8:00a.m. they will not be able to find parking. o Students and faculty see parking Lot B as a popular lot due to its location on campus and proximity to buildings. o Often times individuals feel they cannot leave parking Lot B in the middle of the day because they will not be able to find a parking spot when they return. Convenience to come and go also plays a factor for gold lots. This concern does not come into play in gold lots near Lot B. The extra price is worth it for the convenience factor ensuring a spot if have to leave in the middle of the day.
Bus Services o Participants in attendance questioned if bus use is being considered in this study and how much bus fares affected ridership. However, many individuals traveling to campus do not always live within the service area. o Knowledge about the bus system may be a limiting factor for students.
Think it would be beneficial to have a seminar on available routes, how to ride the bus, along with an orientation on how to move about campus. A seminar or orientation may help alleviate driving due to individuals fear or lack of knowledge of the bus system. Orientations to educate on all available options at UMD such as bus, parking, bicycle etc. o Participants asked if any work with the DTA is being done through this study process for park-and-rides to encourage ridership of individuals outside of the city service area. Would be willing to use a park-and-ride to get to campus if the option was available. o Students asked if any thought was given to having a shuttle to/from campus to the white lots.
Additional Information: o Many students and faculty prefer a door-to-door service due to weather. o A student in attendance noted they would like to see the supply to demand ratio for Maroon Lots. Feel there is a large demand for the maroon lot, even as a student, and is willing to pay more for these lots. Was surprised with automated system was still able to get a maroon lot pass four days after the pass sales opened. o Attendees stated they would not like to see additional parking lots built on the immediate campus area. Would like the promotion of other alternatives such as walking encouraged. o Faculty in attendance asked what other studies are being looked at in relation to traffic. o UMD campus tends to be unfriendly for guest parking on campus.
Listening Session Debrief Time: 4:00 p.m. (5/6/15) Attendance: Lisa Erwin (Student Life); Patrick Keenan (Student Life); Erik Larson (Facilities); Jay Halling (Student Housing); Lance Bernard (SRF); BrieAnna Simon (SRF)
Key Talking Points
Understanding what campus is going to look like in the next 5-10 years (PMT meeting) o Note: Housing wide campus is 200 counts down from last year but still at 100% capacity. o Major piece in next step assessments in order to dial into a range of parking need. This number will provide direction to LHB, along with where additional lots/creative solutions may be needed.
Parking permits o Lisa asked if student life has tracked the number of students turned away for a student pass.
Potential Parking Areas o Matrix to identify pros and cons of each site by scoring or color coordination. o Patrick stated they would like to add the Solon Campus Center lot, which has been identified within the master plan as a potential parking structure location. o Consider “developable acreage” or buildable size for each potential lot. o Concerned with the master plan since shows what is actually feasible. Would like to see only feasible areas identified on the map (do not present anything that is not possible). Work with PMT members in order to ensure developable acreage is identified in an efficient manner. o Lot D – Note the sand pit in the south-east corner is used as the water runoff area for that area.
Schedule: o SRF requested the opportunity to adjust the schedule in order to complete a high quality report. o Patrick feels comfortable extending schedule as long as regular conference calls occur as check-ins (July acceptable). July seems like an appropriate timeframe. August 15th is the drop dead date
There are currently no restrictions with this report being complete by the end of the fiscal year. PMT noted an extended timeframe will alleviate any coordination concerns with consultants and PMT staff in order to make key decisions.
Next Steps: o Patrick will reconfirm the 1-2% average growth rate for students and faculty. Faculty growth was determined by faculty/student ratio. Anticipating faculty count will remain fairly steady to current staff counts. o 95 percent report is the next mile stone Lance determined “deadline” for when this report could be complete o Lance determined deliverables and coordinate with LHB on a detailed schedule Include internal deadlines and 30 min check-ins (determine which PMT members, if not all, need to be included in each meeting) Include a one week review period for PMT members and a video/in-person conference to review comments. Take into consideration any additional PMT meeting needed o Lance and Patrick will conduct a phone call week the week of 5/11 to discuss schedule o Listening session notes return to PMT week of 5/14
w w w.sr fconsulting.com In partnership with: LHB & Architecture Advantage