Molecular Ecology (2006) 15, 4659– 4665
doi: 10.1111/j.1365-294X.2006.03111.x
What should we weigh to estimate heterozygosity, alleles or loci? Blackwell Publishing Ltd
J . M . A P A R I C I O , J . O R T E G O and P . J . C O R D E R O Grupo de Investigación de la Biodiversidad Genética y Cultural, Instituto de Investigación en Recursos Cinegéticos — IREC (CSIC-UCLM-JCCM), Ronda de Toledo s/n, E-13005 Ciudad Real, Spain
Abstract The interest to study the effects of inbreeding in natural populations has increased in the last years. Several microsatellite-derived metrics have recently been developed to infer inbreeding from multilocus heterozygosity data without requiring detailed pedigrees that are difficult to obtain in open populations. Internal relatedness (IR) is currently the most widespread used index and its main attribute is that allele frequency is incorporated into the measure. However, IR underestimates heterozygosity of individuals carrying rare alleles. For example, descendants of immigrants paired with natives (normally more outbred) bearing novel or rare alleles would be considered more homozygous than descendants of native parents. Thus, the analogy between homozygosity and inbreeding that generally is carried out would have no logic in those cases. We propose an alternative index, homozygosity by loci (HL) that avoids such problems by weighing the contribution of each locus to the homozygosity index depending on their allelic variability. Under a wide range of simulated scenarios, we found that our index (HL) correlated better than both IR and uncorrected homozygosity (HO), measured as proportion of homozygous loci) with genome-wide homozygosity and inbreeding coefficients in open populations. In these populations, which are likely to prevail in nature, the use of HL instead of IR reduced considerably the sample sizes required to achieve a given statistical power. This is likely to have important consequences on the ability to detect heterozygosity fitness correlations assuming the relationship between genome-wide heterozygosity and fitness traits. Keywords: heterozygosity, homozygosity by loci, homozygosity indexes, inbreeding, internal relatedness, molecular markers Received 8 April 2006; revision received 29 June 2006; accepted 25 July 2006
Introduction Since the advent and application of DNA polymorphic markers, researches have been interested in designing adequate metrics to estimate inbreeding by analysing markers heterozygosity as an indirect estimate and surrogate of inbreeding coefficients (Coulson et al. 1998; Coltman et al. 1999; Amos et al. 2001; Aparicio et al. 2001; Slate & Pemberton 2002). More broadly and intuitively, researches have also been using DNA polymorphic markers as an extended way to estimate individual heterozygosity and its possible association with fitness components, yielding a large amount of positive results on this respect (e.g. Hansson Correspondence: Joaquín Ortego, Fax: +34 926295 451; E-mail:
[email protected] © 2006 The Authors Journal compilation © 2006 Blackwell Publishing Ltd
et al. 2001; Höglund et al. 2001; Acevedo-Whitehouse et al. 2003; Cordero et al. 2004; Roberts et al. 2006; see, however, Coltman & Slate 2003). Various indexes have been developed to date to improve simple measures of multilocus heterozygosity. Coulson et al. (1998) proposed a measure, d2, based on microsatellite genetic distance using the squared difference in the number of repeats for the two alleles at a locus within an individual, arguing that this measure could distinguish between ‘highly outbreed’ and ‘moderately outbreed’ individuals by incorporating information of coalescence time of microsatellite alleles (Coulson et al. 1998). However, empirical and theoretical evidences suggest that d2 is weakly correlated with inbreeding (e.g. Hedrick et al. 2001; Tsitrone et al. 2001; Goudet & Keller 2002), probably because such a measure may be better suited to situations involving
4660 J . M . A P A R I C I O , J . O R T E G O and P . J . C O R D E R O
Sample
Genotype
Remarkable attributes
IR
Individual 1 Individual 2 Individual 3 Individual 4 Individual 5 Individual 6 Individual 7 Individual 8 Individual 9
A1-A2; B1-B1 A1-A2; B3-B3 A1-A1; B1-B2 A1-A1; B3-B4 A1-A1; B1-B1 A1-A1; B3-B3 A1-A2; B1-B2 A1-A2; B1-B3 A1-A2; B3-B4
common alleles in homozygosis rare alleles in homozygosis common alleles in heterozygosis rare alleles in heterozygosis all loci are homozygous all loci are homozygous all loci are heterozygous all loci are heterozygous all loci are heterozygous
0.09 0.29 0.09 0.29 1 1 − 0.82 − 0.60 − 0.43
population admixture rather than effects present in otherwise homogeneous populations (Pemberton et al. 1999; Tsitrone et al. 2001). The crude estimate of heterozygosity as the proportion of loci that are heterozygous could also be used, but it may be inappropriate when the number of genetic markers is small, and loci differ in number and frequency of alleles, or when not all individuals are typed with the same panel of marker loci. To avoid this last problem, Coltman et al. (1999) proposed to standardize individual heterozygosity (Hs) such that Hs = (proportion of heterozygous typed loci/mean heterozygosity of typed loci). Nevertheless, this method gives equal weight for all loci examined regardless of their allelic frequencies and, furthermore, it assumes a linear relationship between locus-specific heterozygosity and number of alleles. If this is nonlinear (e.g. exponential) the standardization may severely underestimate the effect of variable loci. Amos et al. (2001) proposed a measure based on allele sharing where the frequency of each allele counts towards the final score, thereby allowing the sharing of rare alleles to be weighted more than the sharing of common alleles. This method is based on Queller & Goodnight’s (1989) measure of genetic relatedness between two groups or individuals. Although usually applied to comparisons between pairs of individuals, here the method is applied to compare two alleles rather than two pairs of alleles. Since the quantity being measured is between parental halfgenotypes within an individual, this index refers to the measure as internal relatedness (IR), and the formula simplifies to IR = (2H – Σ fi)/(2N – Σ fi); where H is the number of loci that are homozygous, N is the number of loci and fi is the frequency of the ith allele contained in the genotype. Negative IR values indicate higher heterozygosity, whereas positive values indicate higher homozygosity. IR can vary between 1 and −1. However, it presents asymmetries in its distribution. Whereas, the maximum value, 1, can be obtained when all loci are homozygous regardless allelic frequencies; the minimum value, −1, is only reachable when all loci present only two alleles and the individual is heterozygous for all them. The IR index weighs on the
Table 1 Examples illustrating the different weight given to rare vs. common alleles by internal relatedness (IR) in nine simulated genotypes composed by two loci which combine different allele frequencies. Allelic frequencies in the population for locus A: A1 (0.5), A2 (0.5); and for locus B: B1 (0.4), B2 (0.4), B3 (0.1), B4 (0.1)
basis of the frequency of the alleles. However, the weight is different depending on whether there is homozygosity or heterozygosity in that locus. To be homozygous in some loci bearing low frequent alleles overvalues the homozygosity estimate, precisely because the probability of finding this event in the population is rare. In the same way, one would expect that being heterozygous of two rare alleles overvalues heterozygosity estimate; however, IR makes just the contrary. Also, when an individual is homozygous in all loci, its IR value will be always one independent of the frequency of its alleles in the population. However, if it is completely heterozygous, IR will vary depending on the frequency of the alleles involved (Table 1). In short, except when homozygosity is complete, the IR index attributes higher values (i.e. more homozygosis) to individuals bearing low frequency alleles than to individuals bearing common ones. Those asymmetries in the treatment of allele frequency could be even more problematic when there is immigration, especially, if immigrants bear some alleles that are novel or rare in the host population. When using IR, offspring resulting of crosses between immigrant and native individuals would be considered more homozygous than offspring of native parents. Thus, the analogy between homozygosity and inbreeding that is generally carried out would here lack any logic, and this shortcoming would weaken the relation between homozygosity indexes and inbreeding coefficients in open populations even more. We think that a way to solve some of the above-mentioned problems would be to estimate homozygosity or heterozygosity weighing for the contribution of each locus to the homozygosity index, rather than the contribution of each allele. This may be particularly important when only a few microsatellite markers are used, and these markers differ in their allelic diversities. Most of genetic studies of wild species normally use less than 15–20 microsatellite markers (Balloux et al. 2004), which may vary from including two to several dozens of alleles. To better understand this, imagine the worst of the cases, a marker with only one allele. It is obvious that a monomorphic locus in a population is © 2006 The Authors Journal compilation © 2006 Blackwell Publishing Ltd
E S T I M A T I N G H E T E R O Z Y G O S I T Y F R O M N E U T R A L M A R K E R S 4661 useless to estimate differences in homozygosity index among individuals because all individuals would bear the same allele. Therefore, these markers are normally excluded as long as their value to estimate genome-wide homozygosity is really zero. Suppose that after analysing several hundreds of individuals, we find a new allele for that locus with a very low frequency in the population. What to do then, to include or not to include this locus? If we decide to exclude it, a difficult question arises: what is the minimum variability of a locus to be considered? By contrast, if we decide to include it, we should be cautious because its value to assess genome-wide heterozygosity is still very low in comparison with other loci with several alleles evenly distributed in the population. A solution may be to weigh the contribution of each locus to estimate a homozygosity index, giving more weight to more informative loci. The weight given to the loci may be proportional to their expected heterozygosity (E) as suggested by Queller & Goodnight (1989) to estimate relatedness among groups or individuals. That is, E = 1 − Σ fi2 , where fi is the frequency of the ith allele in the population. On that basis, we propose a homozygosity index that weighs the contribution of loci depending on their allelic variability (i.e. E). Taking into account this term, an individual index of homozygosity weighing by loci (homozygosity by loci, hereafter HL) would be:
∑ Eh HL = ∑ Eh + ∑ Ej where Eh and Ej are the expected heterozygosities of the loci that an individual bears in homozygosis (h) and in heterozygosis ( j), respectively. This index varies between 0 when all loci are heterozygous and 1 when all loci are homozygous. Intermediate values depend on the expected heterozygosity of the loci involved in homozygosis or heterozygosis. A locus will have more weight in HL when their alleles are more evenly frequent, and there are more alleles in the locus. Moreover, in this study, we performed a set of simulations to compare the HL index, IR, and the crude homozygosity (HO) and see what index, and under what circumstances, correlates better with inbreeding and genome-wide homozygosity. We do not include Coltman’s standardized index because it is only appropriate for datasets with some missing values. Our simulations consider populations with and without immigration, and with a wide array of genetic variability.
Materials and methods Simulations We performed 1067 simulations varying initial genetic diversity, effective population size, immigration rates, genetic © 2006 The Authors Journal compilation © 2006 Blackwell Publishing Ltd
dissimilarity between native and immigrant individuals, and mutation rates. Our simulations were designed in excel (Microsoft), and run using the macros of this program. Each individual carried 1100 unlinked loci, a thousand of them were coding loci, and the rest were neutral loci which can be marked and used to infer individual genetic characteristics. Each locus has a variable number of alleles, up to a maximum of 20, whose initial frequencies in the population are randomly assigned. For each locus, alleles are named from 1 to 20. The allele 1 is assigned with a factor-frequency 1, and for subsequent alleles, the factorfrequency is given as: fij = fij−1 ⋅ rij ⋅ ds where fij is the factor-frequency of the allele j at the locus i, rij is a random number for this particular allele, which may vary from 0 to 1 (including fractions), and ds is a parameter of initial genetic diversity, which is fixed in each simulation, s, within a range of values from 0.5 to 3 to simulate different scenarios of initial genetic variability. Therefore, the probability of finding the allele ij in the initial population will be equal to: pij =
fij 20
∑ fij i =1
On the basis of these probabilities, each founder individual is randomly assigned with a genome. Therefore, all allelic frequencies were equal, genotypic frequencies were in Hardy–Weinberg equilibrium and linkage equilibrium existed between loci. Each simulation started with a population of 100 founder individuals. To generate different degrees of inbreeding, subdivisions of the population were simulated by arranging the individuals in one deme of 100 individuals, two of 50 or five of 20 individuals. Within these demes, individuals were randomly mated, and each pair bred two offspring in an only reproductive attempt. The descents randomly received an allele from the mother and another from the father for each locus. Individuals of the new generation were again randomly mated within their deme, and so up to 10 generations. In our simulations, we included the possibility of immigration from an external population. Native and immigrant populations might differ in their allelic frequency in a range from 0% to 25% of loci. These immigrants might arrive individually and mate with native individuals or arrive in pairs. In both cases, migration rates simulated varied from 0 to 0.03. Also, we simulated the possibility of mutation. Mutations occurred according to a K-allele model, with mutation rates ranging from 0 to 10−3.
4662 J . M . A P A R I C I O , J . O R T E G O and P . J . C O R D E R O
Analyses In each simulation, pedigrees were treated with the software pedigree viewer, by Brian and Sandy Kinghorn (available at: www-personal.une.edu.au/∼bkinghor/pedigree.htm), to estimate individual inbreeding coefficients, F. In the last generation, besides F, individual genome-wide homozygosity (Hg), and marker homozygosity were estimated. Hg was assessed as the proportion of homozygous loci of those 1000 coding loci. We use this crude index for coding loci because effects of homozygosity (e.g. the expression of deleterious recessive alleles) occur at the individual, irrespectively of the loci or allele frequencies in the population. Markers homozygosity was estimated using the 100 simulated neutral loci, which were randomly grouped into five sets of 5, 10, 15, 20 and 50 marker loci. Using Pearson’s correlation method we estimated the correlation coefficients between homozygosity indexes obtained with these variable number of markers and F and Hg (ρF |H , ρF | IR , ρF | HL , ρH | H , ρH | IR and ρH | HL ) . O O The parameters handled in the simulations such as immigration rate, genetic dissimilarity between immigrants and natives, initial genetic diversity, group size, etc. are difficult to measure in wild populations. These parameters, with the exception of number of markers, are intimately associated with the genetic variability of the population (data not shown), and thus genetic variability per se could be a key factor for the evaluation and performance of HO, IR and HL. The genetic variability of a locus is normally measured as its expected heterozygosity. That is, 1 − Σ fi2 , where fi is the frequency of the ith allele. We measured genetic variability for a set of loci in a population as the mean of their expected heterozygosities, and examined the efficiency of HO, IR and HL in relation to the genetic variability and the number of marker loci. From correlation coefficients, we estimated the necessary sample size to obtain a certain statistical significant level following Walpole & Myers (1978): 2
⎤ ⎡ 2z n⎢ ⎥ +3 ⎛ ⎞ ⎢ ln 1 + ρ ⎥ ⎢ ⎜⎝ 1 − ρ ⎟⎠ ⎥ ⎦ ⎣ where n is sample size, z is the statistic for a normal distribution, and ρ is the correlation coefficient. The necessary sample sizes to obtain correlations with a certain significant level and a particular marker homozygosity index were log-transformed to ensure normality and homoscedasticity (Zar 1984), and the relative sample size, i.e. the difference between their logarithms, was used to compare their relative sample sizes under different scenarios of genetic variability. Note that, relative sample size is practically independent of the signification level, z, because when the sample size is large we could consider n + 3 ≈ n.
Table 2 General linear model for correlation coefficients between inbreeding coefficients (F) and markers homozygosity in relation to type of index (HO, HL, IR), expected heterozygosity, and number of markers. (Model: F8,15996 = 459, P << 0.0001)
Variable
Mean square
Homozygosity index type 0.32 Expected heterozygosity 39.17 No. of markers 51.15 Index × Expected heterozygosity 0.36 Index × No. of markers 0.02
F
d.f. P
12.9 1564 2042 14.3 1.05
2 1 1 2 2
< 0.0001 < 0.0001 < 0.0001 < 0.0001 0.35
All statistical analyses were carried out with spss 7.5 with two tails and a significance level of 0.05.
Results We performed a general linear model (GLM) to analyse the coefficient of correlations between markers homozygosity indexes and inbreeding coefficients (F hereafter) in relation with genetic variability, number of markers and index type (i.e. HO, HL or IR). These correlation coefficients were significantly different among indexes, and also positively associated with both genetic variability and number of markers. Moreover, the interaction between index type and genetic variability had a significant effect (Table 2). This interaction was significant because IR index was a better predictor of F when genetic variability of markers was low, whereas when it was high, HL index predicted F better than both HO and IR (Fig. 1a). Similar results were obtained for the correlation coefficients between markers and genome-wide heterozygosity (Table 3, Fig. 1b). Because either HL or IR showed a better performance than HO in most of simulated scenarios, we carried out a more detailed analysis comparing differences between HL and IR in relation with factors generated through our simulations, such as initial genetic diversity (i.e. ds in the simulations), individual and pair immigration rates, mutation rate, and number of markers. A multiple regression analysis showed that differences between correlation coefficients of HL and IR with F (ρF | HL – ρF | IR) were positively related to initial genetic diversity (β = 0.21, t = 15.42, P < 0.0001), individual (β = 0.04, t = 2.94, P = 0.003) and pair immigration rates (β = 0.18, t = 12.13, P < 0.0001), and negatively related to the number of loci used to estimate markers homozygosity (β = −0.07, t = 5.09, P < 0.0001). Other independent variables such as genetic dissimilarity between immigrant and native individuals, reproductive group size, or mutation rate were not significant (in all cases β ≤ 0.02, t ≤ 1.31, P ≥ 0.19). We also performed a similar regression analysis, but this time with differences between correlation coefficients of HL and IR with genome-wide homozygosity © 2006 The Authors Journal compilation © 2006 Blackwell Publishing Ltd
E S T I M A T I N G H E T E R O Z Y G O S I T Y F R O M N E U T R A L M A R K E R S 4663
Fig. 2 Sample size differences between internal relatedness (IR) and homozygosity by loci (HL) required to obtain a significant correlation in relation with expected heterozygosity characterizing 50 neutral markers. Table 3 General linear model for correlation coefficients between genome-wide homozygosity (Hg) and markers homozygosity in relation to type of index (HO, HL, IR), expected heterozygosity and number of markers. (Model: F8,15996 = 459, P << 0.0001)
Fig. 1 Correlation coefficients between markers homozygosity indexes (HO, HL and IR) and (a) inbreeding coefficients and (b) genome-wide homozygosity in relation with expected heterozygosity. For illustrative purposes, data are only shown for 10 and 50 markers and three ranges of expected heterozygosity.
(Hg) as dependent variable. We obtained that differences between correlation coefficients of HL and IR with H (ρΗ | HL – ρH | I R ) were positively associated to initial genetic diversity (β = 0.34, t = 26.8, P < 0.0001), individual immigration rate (β = 0.14, t = 10.2, P < 0.0001), and pair immigration rate (β = 0.10, t = 6.9, P < 0.0001). We also obtained significant and positive effects of number of loci used (β = 0.04, t = 3.41, P = 0.001), genetic dissimilarity between immigrant and native individuals (β = 0.06, t = 4.55, P < 0.0001), and group size (β = 0.05, t = 4.2, P < 0.0001), but again mutation rate was nonsignificant (β = 0.00, t = 0.02, P = 0.99). © 2006 The Authors Journal compilation © 2006 Blackwell Publishing Ltd
Variable
Mean square
F
d.f.
P
Homozygosity index type Expected heterozygosity No. of markers Index × Expected heterozygosity Index × No. of markers
0.85 175.5 84.7 1.32 0.06
20.4 4221 2038 31.7 1.34
2 1 1 2 2
< 0.0001 < 0.0001 < 0.0001 < 0.0001 0.26
From our correlation coefficients, we estimated the sample size needed to obtain significant correlations at a level of 0.05 with HL and IR. With both HL and IR, the sample sizes needed to obtain significant correlations with F and Hg decreased with the number of markers used and with the genetic variability of the population (in all cases βs < −0.22, Ps < 0.0001). We also examined how those sample sizes varied in relative terms [i.e. log(nIR) – log(nHL)] to decide what index performs better to estimate F and Hg. A multiple regression analysis showed that the relative sample sizes to attain significant correlates with F or Hg were positively dependent on genetic variability (model for F: β = 0.08, t = 6.05, P < 0.0001; model for Hg: β = 0.10, t = 7.45, P < 0.0001) and also decrease with the number of marker loci in the case of F (β = −0.05, t = −3.35, P = 0.001), but no significant effect of the number of markers was detected for the model obtained for Hg (β = 0.002, t = 0.15, P = 0.879). Thus, the higher the genetic variability is the greater sample size is needed for IR relative to HL (Fig. 2). Finally and given that the relative efficiency of IR and HL depended mainly on genetic variability, we revised the recent literature to see what range of genetic variability occurred in wild populations. All papers published in Molecular Ecology Notes in 2005 on microsatellite characterization in
4664 J . M . A P A R I C I O , J . O R T E G O and P . J . C O R D E R O
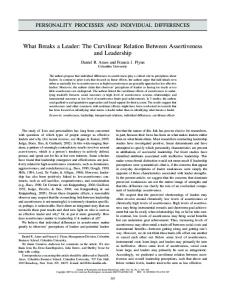
Fig. 3 Distribution of expected heterozygosity for microsatellite markers published for insects and vertebrates in Molecular Ecology Notes (2005).
vertebrates and insects were examined, and the mean expected heterozygosity for each species was obtained. Mean heterozygosities per locus did not differ between zoological classes (F5,163 = 0.77; P = 0.57). Therefore, we pooled data for all species (Fig. 3). Eighty percent of species presented a mean heterozygosity per locus higher than 0.5, suggesting that HL could be the best choice in most of these cases.
Discussion We propose a new homozygosity measure, the homozygosity by loci index (HL), which considers the contribution of each locus instead of allele estimates that neglect loci. Using a wide range of simulated scenarios, we found that HL generates higher significant correlations between markers and genome-wide homozygosity than HO and IR when average heterozygosity is relatively high. Similarly, correlations between inbreeding coefficients and markers homozygosity are higher for HL when genetic variability is also elevated, making HL a better estimator of inbreeding than other indexes not correcting for loci when establishing allelic frequencies. HL correlated better than IR with genome-wide homozygosity and inbreeding coefficients in populations with immigration because HL does not discriminate against less frequent and rare alleles. Also, for marker heterozygosities that are typically seen in wild populations, HO performed better than IR with genome-wide homozygosity. The negative effect of immigration on the ability of IR to predict inbreeding/genome-wide homozygosity is probably derived from the fact that this index overestimates homozygosity in individuals carrying rare alleles. In open populations, for which multilocus heterozygosity indexes are normally
developed, immigrants are likely to bring rare or even novel alleles to the local population (e.g. Hansson et al. 2003). IR overestimates homozygosity values attributed to immigrants bearing rare alleles and their ‘hybrid’ offspring, which are more outbreed than local ones, will be also scored as more homozygous merely because they bear rare alleles. Under these circumstances, that could be relatively frequent in nature, HL appears to be a better alternative whereas the IR index could still perform better in populations showing low immigration rates. Immigration and other factors affecting the relative suitability of both indexes are hard to determine in natural populations, making difficult to decide which index to use for a given species and population. As expected, we found that initial genetic diversity, immigration, mutation rate and group size were positively associated with genetic variability estimated from the simulated set of neutral markers (i.e. expected heterozygosity). Thus, all these variables can be acceptably summarized by expected heterozygosity, a parameter that can be easily calculated from the panel of microsatellite loci available for the study species. Analysing the suitability of the three indexes, we found that HL correlated better with both genome-wide homozygosity and inbreeding than IR and HO when expected heterozygosity was above 0.4–0.6 (Tables 2, 3; Fig. 1) and available data suggest that this scenario of genetic variability is the commonest for most panels of microsatellite loci developed for both vertebrates and insects (Fig. 3; see also Balloux et al. 2004). On the other hand, IR predicted better than HL at low expected heterozygosities especially when the number of markers used is relatively high (Fig. 1). In absolute terms, differences in correlation coefficients between IR and HL were normally lower than 0.1 (see Fig. 1). Although these differences appear to be small, it may represent a considerable improvement because the expected correlation coefficients between inbreeding and multilocus heterozygosity are usually very low (e.g. Balloux et al. 2004; Slate et al. 2004). This improvement is more obvious in terms of statistical power. For instance, considering a population with modal expected heterozygosity of 0.75 (see Fig. 3), differences between indexes in coefficient of correlations were only around 0.07. However, IR index requires approximately a sample size 50% higher than HL to obtain the same significant correlation with both inbreeding and genome-wide homozygosity (Fig. 2). This is likely to have important consequences on the ability to detect heterozygosity fitness correlations, especially on the light of recent empirical and theoretical studies which strongly suggest that estimates of inbreeding from multilocus heterozygosity data are, at best, very weak (Balloux et al. 2004; Pemberton 2004; Slate et al. 2004). In short, we sustain that HL may be a good estimator of genome-wide heterozygosity and inbreeding coefficients in open populations with migration, admixture of founders © 2006 The Authors Journal compilation © 2006 Blackwell Publishing Ltd
E S T I M A T I N G H E T E R O Z Y G O S I T Y F R O M N E U T R A L M A R K E R S 4665 or other processes that increase genetic variability, whereas in populations with high inbreeding, indexes based on direct allelic frequencies (i.e. IR) may be more efficient. Given that heterozygosity is usually high for most microsatellites developed all around the zoological scale, we believe that HL may be a good alternative to study heterozygosityfitness correlations using a standard number of markers (around 10–15) in open natural populations.
Acknowledgements This work received financial support from the projects: CGL200505611-C02-02/BOS (Ministerio de Educación Ciencia) and PAI05053 (Junta de Comunidades de Castilla-La Mancha). During this work J.O. was supported by a predoctoral fellowship from the Junta de Comunidades de Castilla-La Mancha and the European Social Fund. We acknowledge to J. Slate and three anonymous referees for their useful comments and improvement of an earlier version of the manuscript.
References Acevedo-Whitehouse K, Gulland F, Greig D, Amos W (2003) Disease susceptibility in California sea lions. Nature, 422, 35–35. Amos W, Wilmer J, Fullard K et al. (2001) The influence of parental relatedness on reproductive success. Proceedings of the Royal Society of London. Series B, Biological Sciences, 268, 2021–2027. Aparicio JM, Cordero PJ, Veiga JP (2001) A test of the hypothesis of mate choice based on heterozygosity in the spotless starling. Animal Behaviour, 62, 1001–1005. Balloux F, Amos W, Coulson T (2004) Does heterozygosity estimate inbreeding in real populations? Molecular Ecology, 13, 3021–3031. Coltman DW, Pilkington JG, Smith JA, Pemberton JM (1999) Parasite-mediated selection against inbred Soay sheep in a freeliving, island population. Evolution, 53, 1259 –1267. Coltman D, Slate J (2003) Microsatellite measures of inbreeding: a meta-analysis. Evolution, 57, 971– 983. Cordero PJ, Aparicio JM, Veiga JP (2004) Parental genetic characteristics and hatching success in the spotless starling, Sturnus unicolor. Animal Behaviour, 67, 637– 642. Coulson, TN, Pemberton JM, Albon SD et al. (1998) Microsatellites reveal heterosis in red deer. Proceedings of the Royal Society of London. Series B, Biological Sciences, 268, 2021–2027. Goudet J, Keller L (2002) The correlation between inbreeding and fitness: does allele size matter? Trends in Ecology & Evolution, 17, 201–202.
© 2006 The Authors Journal compilation © 2006 Blackwell Publishing Ltd
Hansson B, Bensch S, Hasselquist D, Akesson M (2001) Microsatellite diversity predicts recruitment of sibling great reed warblers. Proceedings of the Royal Society of London. Series B, Biological Sciences, 268, 1287–1291. Hansson B, Bensch S, Hasselquist D (2003) A new approach to study dispersal: immigration of novel alleles reveals female biased dispersal in great reed warblers. Molecular Ecology, 12, 631– 637. Hedrick P, Fredrickson R, Ellegren H (2001) Evaluation of d2, a microsatellite measure of inbreeding and outbreeding, in wolves with a known pedigree. Evolution, 55, 1254–1260. Höglund J, Piertney SB, Alatalo RV, Lindell J, Lundberg A, Rintamaki PT (2001) Inbreeding depression and male fitness in black grouse. Proceedings of the Royal Society of London. Series B, Biological Sciences, 269, 711–715. Pemberton J (2004) Measuring inbreeding depression in the wild: the old ways are the best. Trends in Ecology & Evolution, 19, 613 –615. Pemberton J, Coltman D, Coulson T, Slate J (1999) Using microsatellites to measure the fitness consequences of inbreeding and outbreeding. In: Microsatellites, Evolution and Applications (eds Goldstein D, Schlotterer C), pp. 151–164. Oxford University Press, Oxford. Queller DC, Goodnight KF (1989) Estimating relatedness using genetic markers. Evolution, 43, 258–275. Roberts SC, Hale ML, Petrie M (2006) Correlations between heterozygosity and measures of genetic similarity: implications for understanding mate choice. Journal of Evolutionary Biology, 19, 558–569. Slate J, David P, Dodds KG et al. (2004) Understanding the relationship between the inbreeding coefficient and multilocus heterozygosity: theoretical expectations and empirical data. Heredity, 93, 255–265. Slate J, Pemberton JM (2002) Comparing molecular measures for detecting inbreeding depression. Journal of Evolutionary Biology, 15, 20–31. Tsitrone A, Rousset F, David P (2001) Heterosis, marker mutational processes and population inbreeding history. Genetics, 159, 1845–1859. Walpole RE, Myers RH (1978) Probability and Statistics for Engineers and Scientists, 2nd edn. MacMillan Publishing Co, New York. Zar JH (1984) Biostatistical Analysis. Prentice Hall International, Englewood Cliffs, New Jersey.
Now, J.M.A. is also interested in the relationship between heterozygosity and fitness in natural populations. J.O. is studying genetic aspects of mating and dispersal and the importance of genetic variation on different fitness components as a PhD student at the University of Castilla-La Mancha. P.J.C. is interested in the role of environment and genetic variation on evolution.