Statistical modelling and analysis of the aerobic oxidation of benzyl alcohol over K-Mn/C catalysts Qinghu Tang1, 2, Yuanting Chen1, Caixia Jasmine Zhou 1, Tao Chen1, Yanhui Yang1* 1
School of Chemical and Biomedical Engineering, Nanyang Technological University, Singapore, 637459 2 Department of Chemistry, Henan Normal University, Xinxiang 453007, China * To whom correspondence should be addressed. Email address:
[email protected] Tel: +65 6316 8940, Fax: +65 6794 7553 Abstract We report the application of statistical multivariate analysis to optimize the process parameters (including temperature, O2 pressure, concentration of benzyl alcohol, Mn content, and K:Mn molar ratio) in the oxidation of benzyl alcohol using molecular oxygen over K-Mn/C catalysts. This multi-regression model, based on 38 experimental runs, shows reasonably accurate prediction on the benzyl alcohol conversion and turnover frequency (TOF). Moreover, the synergistic effects between reaction parameters are revealed, in particular, it is found that the benzyl alcohol conversion and TOF are in positive correlation with temperature, O2 pressure and K:Mn molar ratio, with temperature having the most significant impact. In contrast, the concentration of benzyl alcohol and Mn content affect the conversion and TOF in a complex and opposite way. We hope to achieve a comprehensive understanding of the reaction process and provide valuable guidance for industrial scale-up of the reaction with the objective of optimal operations. Keywords: Aerobic oxidation; Benzyl alcohol; K-Mn/C; Statistical analysis; Multiple regression model 1. Introduction Oxidation of alcohols into the corresponding aldehydes or ketones, in particular benzyl alcohol to benzaldehyde, is one of the most important functional group transformations in organic synthesis [1-3]. The traditional non-catalytic methods of alcohol oxidation require stoichiometric oxidants such as dichromate and permanganate [4]. These oxidants are usually expensive, hazardous, and toxic; they produce a large amount of inorganic waste. From the standpoints of atom economy and environmental demand, much attention has been paid to the development of effective catalytic systems for oxidation of alcohols using environmentally benign and inexpensive oxidants [5-7]. Significant effort has been made to develop homogeneous catalysts [5, 6]. However, most of these catalytic systems require large quantities of additives such as NaOAc, NaOH, and K2CO3 which generate aqueous effluents containing inorganic salts [8]. Heterogeneous catalysis possesses significant advantages in product separation and catalyst recovery; it has attracted considerable interests during the past decades [7]. Many highly efficient systems have been developed for catalytic aerobic alcohol oxidation using Ru, Pd, Pt, Au, V, Mo, Ni, Cu and Mn as active species [7, 9, 10]. Most of these 1
reports focus on the synthesis of catalyst and catalytic performances; studies on the process of the aerobic oxidation of alcohols are limited [11]. It is highly desirable to optimize the oxidation process, through investigating the effects of the process parameters (factors) on the performance (response). However, the optimization task is challenging because the aerobic oxidation of alcohol consists of many process parameters. The common “trial-and-error” method is to adjust each factor in turn while keeping others constant in order to study how the response varies with respect to that particularly adjusted factor. This approach essentially ignores the interactions between the factors and typically results in a suboptimal process performance [12]. The “trial-and-error” approach is unable to achieve a comprehensive understanding of the synergist effects between the factors. In addition, extensive data has to be collected as the number of factors increases and the approach becomes impractical. Recently, the use of statistical methodology in optimization has been becoming increasingly attractive [13-15]. Statistical multivariate analysis allows all the factors of interest to be assessed simultaneously, especially when a large number of factors are involved in a complex reaction process. By using a proper design of experiments (DoE), a comprehensive understanding of the effect of individual factor and their interactions can be derived with a small number of experiments. One of the most commonly used DoE for optimization purpose is the Response Surface Design (RSD) [16, 17] because RSD is capable of identifying an optimal response within the factor range and predict a response with a given factor setting. In this work, the intention is to build a statistical model to investigate the catalytic process of aerobic oxidation of benzyl alcohol over the K-Mn/C catalysts recently developed [18] by using the RSD method. Five factors of interest, i.e., reaction temperature, oxygen pressure, concentration of benzyl alcohol, percentage of manganese content and K:Mn ratio, will be assessed for the benzyl alcohol conversion and turnover frequency (TOF, indicators of catalytic activity). Moreover, multivariate analysis will be performed to study the effects of reaction parameters and reveal their interaction with emphases on the detailed description of the process of the statistical design and modeling. The statistical model obtained will also be used to predict the catalytic activity of K-Mn/C catalysts in the aerobic oxidation of benzyl alcohol. 2. Experimental 2.1 Catalyst synthesis and characterization K-Mn/C catalysts were prepared by co-impregnating aqueous solutions of potassium and manganese nitrates onto a commercially available activated carbon (Sigma-Aldrich). After the impregnation, the samples were first dried at 70 oC overnight then calcined at 400 oC in helium for 3 h. By varying the amount of potassium and manganese nitrates used and the Mn:K ratios, different compositions of catalysts were obtained. Powder X-ray diffraction (XRD) patterns were recorded with a Bruker Advance 8 X-ray diffractometer equipped with a rotating anode using Cu Kα radiation (λ = 0.154 nm), operating at 40 kV and 40 mA. N2 adsorption isotherms were measured at -196 oC in a static volumetric Autosorb 6 (Quanta Chrome). Prior to measurements, samples were outgassed at 200 oC to a residual pressure below 10-4 Torr. The specific surface area was calculated by the standard Brunauer-Emmett-Teller method (BET). The content of manganese and potassium was determined by ICP analysis. Detail Raman and X-ray absorption characterization can be found elsewhere [18]. 2.2 Statistical design From a recent study of the aerobic oxidation of benzyl alcohol over K-Mn/C catalysts [18], five main factors, i.e., reaction temperature, oxygen pressure, concentration of benzyl alcohol, 2
percentage of manganese content, and K:Mn ratio, were quantitatively shown to strongly influence the catalytic activity. The factors and their design ranges, as well as the responses of interest for this study, are listed in Table 1. Each individual variable is investigated over a wide range within laboratory experimental limit. Benzyl alcohol conversion and TOF are two responses we want to maximize as they are indicators of catalyst performance. An effective method to investigate the impact of the factors on the process response is to develop a second-order regression model that includes both the linear and quadratic terms [19]. It is possible to include cubic or even higher-order terms; however this approach requires a considerably larger number of experiments for model-fitting. The adoption of a second-order model may also be justified by the observation that high-order terms typically contribute insignificantly to the process response in practice [19]. To collect the data for model development, a set of 38 experimental points with different factor settings was generated using the central composite design of the RSD, as shown in Table 2. The design table is a combination of two-level fractional factorial points, centre points and axial points. Prior to model development, standard normalization method is applied to all the factors to improve numerical accuracy as follows: xi − ( x max + x min ) / 2 , ( x max − x min ) / 2 where xi is the actual variable, xmax and xmin are the maximum and minimum value of the variable range [12]. 2.3 Response collection The catalytic oxidation of benzyl alcohol was carried out using a bath-type reactor operated under atmospheric pressure. For each experiment, benzyl alcohol and toluene were fed into the flask with 0.2 g of K-Mn/C catalysts. The concentration of benzyl alcohol was varied as different amount of benzyl alcohol (in mmol) was diluted in a fixed 10 mL of toluene. The reaction mixture was heated to the desired reaction temperature under vigorous stirring. A total gas flow of 20 ml/min was bubbled into the reaction, consisting of oxygen balanced with nitrogen. Dodecane was used as an internal standard. The reaction mixture was magnetically stirred at 800 rmp. After the reaction, the solid catalyst was filtered off by centrifuging the recaction mixture, and the liquid organic products were analyzed by an Agilent gas chromatograph 6890 equipped with a flame ionisation detector (FID) and a HP-5 capillary column (30 m long and 0.32 mm in diameter, packed with silica-based supel cosil). The conversion and turnover frequency (TOF) were calculated as follows: (initial mol%) - (final mol%) Conversion (mol%) = × 100% (1) (initial mol%) number of moles of aldehyde formed TOF = (2) number of moles of manganese in the catalyst × reation time After performing a total of 38 independent experiments with different factor settings, the benzyl alcohol conversions and turnover frequencies were collected, and tabulated in Table 2 as y responses. The tabulated results were modeled and analyzed via the response surface design interface using the JMP software (ver. 4.04) [20]. 3. Results and discussion 3.1 Structure features of K-Mn/C catalysts Figure 1 shows the XRD patterns of a series of K-Mn/C catalysts with different manganese loadings and K:Mn molar ratios. For the samples with a K:Mn ratio of 0.5, only broad diffraction 3
peaks ascribed to activated carbon appear; no any manganese crystalline phase can be discerned with Mn content below 4.5% because of the nature of highly dispersed manganese species. Our recent X-ray absorption study indicated that these highly dispersed manganese oxide species, which have strong interaction with the incorporated potassium and the activated carbon support, are coexistence of Mn2+ and Mn3+ [18]. As Mn loadings is higher than 7.5 wt%, diffraction peaks at 35, 41 and 59o assignable to crystalline MnO (JCPDS 01-078-0424) can be observed, suggesting the majority Mn species are aggregation of crystalline MnO particles in these samples, although X-ray absorption spectra can trace the existence of Mn3+ species. K:Mn molar ratio also plays an important role for the structure features of K-Mn/C catalysts. For the samples with Mn content of 4.5, no peak assigned to any manganese oxide or potassium species can be observed when K:Mn ratio is lower than 1.0, suggesting manganese and potassium species are highly dispersed on activated carbon. However, weak diffraction peaks at 35, 41 and 59o assignable to crystalline MnO can be seen as the K:Mn ratio is higher than 1.5. The intensity of these diffraction lines increases when the K: Mn ratio is higher than 3.0. Moreover, other crystalline phases possibly ascribed to potassium species also can be discerned. These results suggest both manganese loadings and K:Mn ratios affect the structure features of K-Mn/C catalysts. As shown in Figure 1, the BET surface area of K-Mn/C samples decrease gradually with increase of manganese loading or K:Mn ratio. High manganese loadings and K:Mn ratios remarkably decrease the surface area of K-Mn/C catalysts. 3.2 Statistical modeling After obtaining the experimental data, a second-order multi-regression model is developed to fit the data for each of the responses, and the model for the conversion of benzyl alcohol is shown in Table 3. The estimated parameter shows how the response changes with the term (factor or factor interaction) while the other terms remain constant. The standard error is the estimated standard deviation of the error. The t-ratio (the ratio between parameter estimates and standard errors) in conjunction with the p-value based on the methodology of hypothesis testing, are utilized to gauge the predictability of each term to the response. With the assumption that the errors are normally distributed, a t-ratio with large magnitude (and a small p-value) indicates that the regression parameter is significantly different from zero, i.e. the corresponding term should be included in the regression model. Therefore, by removing the regression terms that have small t-ratio and large p-value, the regression model could give improved prediction of the responses. Specifically, the following thresholds are adopted to determine the terms that have small t-ratio and large pvalue and thus should be removed: |t-ratio| < 1.5 and p-value > 0.1[12]. Alternatively, the widely used stepwise procedures, including forward inclusion, backward elimination and stepwise regression, can be utilized to identify the regression terms to be included in the model [12, 21, 22]. The forward inclusion involves adding of terms to the initial model based on the most significant p-values until further additions do not show any appreciable significance [23]. The stepwise regression method is to add variables in the earlier stage and eliminate unimportant variables subsequently. In contrast to the first two methods, the backward elimination procedure successively eliminates the terms with the least significant p-values from the full model. The model is refitted after successive elimination until an unsatisfactory fit occurred as indicated by a decrease in the adjusted R-square value. The backward elimination is adopted in this study since it is less probable to miss significant predictors that exhibit significant effect only in the presence of some other variables [12]. Detailed illustration of the backward elimination procedures was reported by Du et al. [12]. In addition, a constrained version of the 4
back elimination procedure was adopted in which the elimination of the main variables, i.e., temperature (T), oxygen pressure (P), benzyl alcohol concentration (C), Mn content (M) and K:Mn ratio (R) as given in Table 1, is not allowed even if these variables have high p-value and/or low t-ratio. It is necessary to retain the main variables because some of the cross terms which includes these main variables are significant and removing these main variables would remove the corresponding cross terms. Table 3 clearly shows that not all the terms are statistically significant in the regression, and the insignificant terms can be removed using backward elimination. A total of 8 steps were taken to eliminate the least significant variables in the sequence of P×R, P×C, T2 , C×R, T×P, P×M and C×M from the original model, until a slight decrease in the adjusted R-square value of the refitted model was observed (from 0.9456 to 0.9452). The improved model for the conversion of benzyl alcohol (y1), shown in Table 4, consists of all the main variables, significant second order variables and cross terms. Note that terms T×C, T×R and R×R were not eliminated according to the reference p-value (>0.1) because further elimination would result in a poorer fit to the data and thus these terms were believed to be statistically significant to the model. The constrained backward elimination procedure was also applied to improve the regression for turnover frequency (y2) and the parameter estimates of the improved model are given in Table 5. All the main variables were retained despite C, M and R having relatively high p-values. It is essential to keep these main variables because their cross terms like M×R and second-order terms like P×P and M×M have shown significant predictability. Removing these main variables will result in the removal of the significant quadratic terms, thus giving an inaccurate model. The improved model given in Table 4 and 5 forms the basis of statistical analysis discussed subsequently. 3.3 Statistical Analysis 3.3.1 Prediction Profiler In contrast to the traditional trial-and-error method, the prediction profiler provides an efficient way of changing one variable while keeping others constant to study the individual effects on the responses. It shows how each variable influences the responses in the specified range and the trends can be seen in Figure 2. Reaction temperature plays an important role in the kinetics of the reaction. In previous study [18], reaction only occurs at a temperature higher than 70 °C. According to thermodynamic equilibrium calculations, the equilibrium constant will increase with temperature for an endothermic reaction which is as such in this literature [16]. As a result, the reaction shifts to the right and increase the equilibrium conversion of benzyl alcohol and also the turnover frequency. An increase in the partial pressure of oxygen will also increase both the conversion of benzyl alcohol and turnover frequency, but only in the lower range. The significance of oxygen pressure diminishes when the reaction has reached equilibrium. An increase in concentration of benzyl alcohol, on the other hand, will decrease conversion but increase turnover frequency as explained by Equation (1) and (2) respectively. The effect of %Mn is just the opposite. When %Mn increases, conversion will increase because there are more active sites available for reaction while turnover frequency will decrease as depicted from Equation (2). The increase in K:Mn ratio will increase both responses because the amount of promoter in the catalysts increased. The promoter can have increased the response by improving dispersion of the Mn species in the catalysts and thus improving the catalytic activity. Characterization of Raman and X-ray absorption fine structure (XAFS) evidenced that potassium ions induce a large local distortion to Mn-O octahedrons in supported manganese 5
oxides, which has been suggested to be a vital factor to enhance the activation of O2 for the oxidation of benzyl alcohol [18]. However, large amount of promoter will dilute the Mn active sites as reported by Passos et al. [24], thus causing the effect on the responses to decline at high K:Mn ratio. Therefore, the prediction profilers are able to show the trend of the response resulted from the variation of one factor at a time. In the aerobic selective oxidation of benzyl alcohol, the effect of individual process parameter on the conversion of benzyl alcohol and turnover frequency was revealed and proved to be consistent with experimental results. 3.3.2 Contour Profilers Other than the individual effect contributed by each main variable, the responses were also influenced by the interaction variables. The effects contributed by these interactions can be observed from the response surface plots generated by the contour profiler. The contour profiler is an interactive facility used to optimize response surface graphically. The three dimensional response surfaces and contour plots were used to facilitate a straightforward examination of the influence of experimental variables on the responses [16, 17, 19]. Each response surface and contour plot was created by keeping two out of five variables constant at their centre points. Note that only the contour profilers of significant interaction variables will be studied here because insignificant interaction variables do not result in much variation in the response within the factor region. In general, the shape of the contour plots are either straight, circular, elliptical or in the form of minimax [16]. If the shape of the contour is elliptical or inclined, the interaction between variables is evident. The following Figure 3 to Figure 7 reveal that all the contour plots are shaped incline, thus the interaction effects are significant. Figure 3 shows the response surface plot of conversion of benzyl alcohol over the process parameters (concentration of benzyl alcohol and reaction temperature) with other variables fixed at centre point. The response surface plot reveals useful information for optimization in a qualitative way. Figure 3 exhibits that conversion of benzyl alcohol increase due to an increase in the reaction temperature and a decrease in benzyl alcohol concentration. Figure 4 shows that at high K:Mn ratio and high temperature, the conversion will be the highest in the region; while Figure 5 shows that at high %Mn and high temperature, conversion will increase. Thus, a high conversion of benzyl alcohol can be obtained with high temperature, high K:Mn ratio and high %Mn. However, from Figure 6 that to obtain high conversion at high K:Mn ratio, the %Mn has to be kept low and vice versa. This simply means that the %Mn and K:Mn ratios are two factors which can be adjusted within the range to obtain a high conversion of benzyl alcohol. Figure 7 shows the surface response and contour plot of M x R, which is the only interaction variable that remained after the backward elimination of the turnover frequency model. The surface plot shows that at high K:Mn ratio, the %Mn has to be kept low in order to obtain high turnover frequency. The same trend was reflected in the conversion of benzyl alcohol and thus the values chosen for K:Mn ratio and %Mn will affect both the responses significantly. 3.3.3 Regression models The relationship between the actual experimental data and the fitted values is shown by the regression model. A good fit of the data is indicated by an R-square value that is close to 1.0. The closer the value is to 1.0, the better the fit. The quality of the models is judged from the adjusted R-square value. As shown in Figure 8, the adjusted R-square value for conversion of benzyl alcohol increased from 0.93 to 0.95, which means that the fit has improved. The regression model also showed a closer distribution of data points along the y = x line, which indicates a stronger relationship between the predicted values and the actual values. The same applies for 6
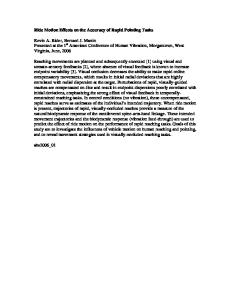
the regression model for turnover frequency (Figure 9), in which the adjusted R-square increased from 0.87 to 0.90. The larger adjusted R-square values for both models proved that the models have good predictive capability. 3.3.4 Prediction formula The prediction formulas listed in the following are derived from the improved model for conversion of benzyl alcohol (y1, Table 4) and turnover frequency (y2, Table 5). These quadratic polynomial equations were developed to predict the response as a function of the main variables and their interaction variables [12, 16]. The main variables (as defined in Table 1) in the prediction formulas have been subjected to a standard normalization process for simplification purposes and expressed in the form: xi − ( x max + x min ) / 2 , ( xmax − x min ) / 2 Based on the normalized variables, the prediction formulas are as follows: y1 = 40.24 + 29.56x1 + 15.40x2 - 17.88x3 + 26.32x4 + 4.94x5 - 9.41x1x3 + 15.74x1x4 + 8.16x1x5 - 8.95x4x5 - 16.42x22 + 8.43x32 - 6.53x42 - 0.29x52 (3) y2 = 0.97 + 0.70x1 + 0.37x2 + 0.18x3 - 0.09x4 + 0.18x5 - 0.52x4x5 - 0.35x22 - 0.50x42 - 0.02x52 (4) The prediction formulas obtained from the improved models can be used to determine the conversion of benzyl alcohol and turnover frequency quantitatively, given any combination of factor settings in the specified range shown in Table 1. In addition, these regression models offer clear interpretation of the impact of process parameters on the responses. As an example we consider the effect temperature (x1), and ignore the other factors by setting them to their middle value of ( x max + xmin ) / 2 , which is equivalent to setting them to zero in the normalized scale. Therefore, an increase of temperature from 60 to 110 ̊C (equivalent to -1 to 1 in the normalized scale) would give an increase of 29.56 × (1 − ( −1)) = 59.12 in conversion (y1, %). Similarly this increase of 50 ̊C would result in 0.70 × (1 − ( −1)) = 1.40 increase in TOF (y2, h-1). The same analysis can be applied to other factors to obtain an interpretation of the models. 3.4 Experimental evaluation A comparison between the actual experimental data and predicted data was done to evaluate the predictability of the models for benzyl alcohol conversion and turnover frequency. The purpose is to show that the improved models are able to predict the responses qualitatively and quantitatively, given a set of process parameters. Using the prediction profiler, four data points with different %Mn were randomly chosen to compare the experimental and predicted values. At the temperature of 110 °C, partial pressure of oxygen of 1, concentration of benzyl alcohol of 4 mmol, K:Mn ratio of 1, the predicted values for the benzyl alcohol conversion show similar trend with the actual experimental data obtained. It is evident from Figure 10 that the predictability of conversion is more accurate at higher % Mn as shown by the increasingly small difference between the actual and predicted values. At lower %Mn, the larger difference between prediction and experimental value is still within the range of experimental error. Thus, the experimental data has shown that the improved model is accurate in predicting the conversion of benzyl alcohol. In addition, a comparison was also drawn between the actual and predicted values for the turnover frequency. As shown in Figure 11, the experimental values of turnover frequency are in general agreement with the predicted values between 7~12 wt% of Mn. Larger differences between the prediction and the 7
experimental results can be observed when manganese loading is as low as 3 wt% and as high as 15 wt%. There are three possible reasons to explain the large differences between the prediction and the experimental results. The manganese loadings for these two particular experimental validations are approaching to the limit of Mn content range in this model and it may result in larger uncertainty in the predicting results. Second, there are strong and complex interactions between active species and the support due to the complex nature of manganese component at such manganese loadings. Third, a linear fitting is used for modeling the experimental results. The turnover frequency may be affected by many factors including the chemical component and structure features of the catalyst, the simple linear fitting model may be less effective. Currently the investigation of non-linear modeling methodology, such as non-parametric statistics [25], is in progress. 4. Conclusion Statistical design of experiment has been used to generate quantitative models for the aerobic oxidation of benzyl alcohol based on five independent variables that have significant influence on the catalytic activity of K-Mn/C catalysts. The improved model has been applied to reveal the effects of the process parameters on the performance of the oxidation process. The predictability of the model was tested by the comparison between experimental results and the predicted results. Reasonable agreement was obtained for benzyl alcohol conversion. The prediction of the model based on only 38 experimental runs proves that it is practicable to achieve a statistical model using the design of experiment approach. The impact of the five process parameters on the reaction, as discovered from this work, provides important guidance for the practical implementation of the process, and it could significantly reduce the time and resource in the plant trial stage. For example, since temperature has a prominent positive effect on both conversion and TOF, the temperature value of lower than, e.g. 90 ̊C, does not need to be tried (refer to Figure 2). In contrast, since %Mn has opposite effect on conversion and TOF, an intermediate value of 7.0 could be reasonable to keep a balance of maximal conversion and TOF. In summary, the proposed statistical modelling and analysis facilitate to characterize how the responses vary as the factors are changed, as well as the relative importance of the factors, and the methodology is capable of discovering the direction to be explored and the major factors to be focused on in later development of the process. Acknowledgement This work is supported by AcRF tier 2 grant ARC 13/07 M45120006. We also thank to Science Research Foundation for Young Skeleton Teachers in the Universities of Henan Province of China for partial financial support. References [1] R.A. Sheldon and J.K. Kochi, Metal-Catalyzed Oxidation of Organic Compounds, (Academic Press, New York, 1981). [2] R.A. Sheldon, I.W.C.E. Arends, G.J. ten Blink and A. Dijksman, Acc. Chem. Res. 35 (2002) 774. [3] R.A. Sheldon, I.W.C.E. Arends and A. Dijksman, Catal. Today 57 (2000) 157. [4] M. Hudlucky, Oxidations in Organic Chemistry, (ACS Mongraph Series, American Chemical Society, Washinton DC, 1990). [5] R.A. Sheldon, I.W.C.E. Arends and A. Dijksman, Catal. Today 57 (2000) 157. [6] M.J. Schultz and M.S. Sigman, Tetrahedron 62 (2006) 8227. [7] T. Mallat and A. Baiker, Chem. Rev. 104 (2004) 3037. 8
[8] A. Dijksman, A. Marino-Gonzalez, A.M.I. Payeras, I.W.C.E. Arends, R.A. Sheldon, J. Am. Chem. Soc. 123 (2001) 6826. [9] B.-Z. Zhan and A. Thompson, Tetrahedron 60 (2004) 2917. [10] G.J. Hutchings, Chem. Commun. (2008) 1148. [11] V.D. Makwana, Y.C. Son, A.R. Howell and S.L. Suib, J. Catal. 210 (2002) 46. [12] G. Du, Y.Yang, W. Qiu, S. Lim, L. Pfefferle and G. L. Haller, Appl. Catal. A 313 (2006) 1. [13] S. L. C. Ferreira, R.E. Bruns, E. G. P. da Silva, W. N. L. dos Santos, C. M. Quintella, J. M. David, J. B. de Andrade, M.C. Breitkreitz, I. C.S. F. Jardin and B. B. Neto, J. Chromatogr. A 1158 (2007) 2. [14] S.A. Hutchens, R.V. Leon, H.M. O'Neill and B.R. Evans, Lett. Appl. Microbiol. 44 (2006) 175. [15] L.E. Vanatta and D.E. Coleman, J. Chromatogr. A 804 (1998)161. [16] Istadi and N.A.S. Amin, Fuel Process. Technol. 87 (2006) 449. [17] N.A.S. Amin and D.D. Anggoro, Fuel 83 (2004) 487. [18] Q. Tang, T. Liu and Y. Yang, Catal. Commun. 9 (2008) 2570. [19] C.Ye, J. Liu, F. Ren and N. Okafo, J. Pharm. Biomed. Anal. 23 (2000) 581. [20] JMP, The Statistical Discovery Software, User's Guide. USA: SAS, 2001. [21] J. Pearce and S. Ferrier, Ecol. Model. 128 (2000) 127. [22] L. Xu and W.-J. Zhang, Anal. Chim. Acta 446 (2001) 477. [23] H. B. Lawal, Categorical Data Analysis with SAS and SPSS Applications, (Lawrence Erlbaum Associates, London, 2003). [24] F.B. Passos, D.A.G. Aranda and M. Schmal, J. Catal. 178 (1998) 478. [25] T. Chen, J. Morris and E. Martin, Chemom. Intell. Lab. Syst. 87 (2007) 59.
9
Table 1 The process factor and responses Process factor Temperature, x1 (°C) Partial pressure of oxygen, x2 Concentration of benzyl alcohol, x3 (mmol) Percentage of manganese, x4 (%) K:Mn ratio, x5
Range 60 - 110 0-1 1 – 4* 1 - 15 0–4
Response Goal Benzyl alcohol conversion, y1 (%) Maximize -1 Turnover frequency, y2 (h ) Maximize *Concentration of benzyl alcohol is expressed in mmol for simplification purposes as it is diluted with a fixed amount of toluene (10 mL) each time.
Table 2 Custom design of experiment, including the main factors and the responses Run 1 2 3 4 5 6 7 8 9 10 11 12 13 14 15 16 17 18 19
x1 95 85 85 85 85 95 85 95 60 85 95 75 95 75 85 85 95 75 75
x2 0.7 0.5 0.5 0.5 0.5 0.7 0.5 0.7 0.5 0.5 0.7 0.3 0.3 0.3 0.5 0.5 0.3 0.7 0.7
x3 3.1 2.5 2.5 2.5 2.5 3.1 2.5 1.9 2.5 2.5 1.9 3.1 3.1 3.1 2.5 2.5 1.9 1.9 1.9
x4 10.5 0.0 7.5 7.5 4.5 4.5 7.5 4.5 7.5 7.5 10.5 10.5 4.5 4.5 7.5 4.5 10.5 10.5 4.5
x5 0.3 0.5 1.0 0.5 4.0 0.7 0.5 0.3 0.5 0.5 0.7 0.3 0.3 0.7 0.0 2.0 0.3 0.3 0.7
y1 56.0 0.3 48.3 39.3 68.9 39.2 39.5 49.4 10.8 40.9 77.8 20.8 25.6 13.5 37.5 55.9 61.9 44.7 25.3
y2 1.135 0.000 1.106 0.900 2.629 1.855 0.904 1.432 0.247 0.936 0.967 0.422 1.211 0.639 0.858 2.133 0.769 0.555 0.734
Run 20 21 22 23 24 25 26 27 28 29 30 31 32 33 34 35 36 37 38
10
x1 75 75 85 85 75 95 85 85 75 85 85 85 85 110 85 85 85 85 95
x2 0.3 0.7 0.5 0.5 0.7 0.3 0.5 0.5 0.3 0.0 0.5 0.5 0.5 0.5 1.0 0.5 0.5 0.5 0.3
x3 1.9 3.1 2.5 2.5 3.1 3.1 2.5 2.5 1.9 2.5 2.5 4.0 1.0 2.5 2.5 2.5 2.5 2.5 1.9
x4 10.5 10.5 4.5 7.5 4.5 10.5 4.5 4.5 4.5 7.5 15.0 7.5 7.5 7.5 7.5 7.5 4.5 7.5 4.5
x5 0.7 0.7 3.5 0.5 0.3 0.7 2.5 1.5 0.3 0.5 0.5 0.5 0.5 0.5 0.5 0.5 3.0 0.5 0.7
y1 30.6 29.7 73.6 40.6 19.1 48.5 59.2 39.5 20.5 4.3 67.0 28.0 69.5 67.0 43.5 37.8 66.3 39.2 42.3
y2 0.380 0.602 2.808 0.929 0.904 0.983 2.259 1.507 0.594 0.098 0.767 1.026 0.636 1.534 0.996 0.865 2.530 0.897 1.227
Table 3 The parameter estimates of the regression for benzyl alcohol conversion (y1) Term Intercept T P C M R T×P T×C P×C T×M P×M C×M T×R P×R C×R M×R T×T P×P C×C M×M R×R
Estimate 40.617 29.561 15.395 -17.882 26.338 4.899 4.180 -9.414 -2.461 15.742 5.977 -7.773 8.164 -1.289 3.867 -8.769 -1.733 -16.733 8.117 -6.855 -0.281
Standard error 1.663 2.403 2.403 2.403 2.386 2.025 8.017 8.017 8.017 8.017 8.017 8.017 8.017 8.017 8.017 5.577 4.002 4.002 4.002 4.022 0.292
11
t-Ratio 24.425 12.304 6.407 -7.443 11.037 2.419 0.521 -1.174 -0.307 1.964 0.746 -0.970 1.018 -0.161 0.482 -1.573 -0.433 -4.181 2.028 -1.704 -0.963
p-Value <0.0001 <0.0001 <0.0001 <0.0001 <0.0001 0.0270 0.6088 0.2565 0.7626 0.0661 0.4661 0.3458 0.3228 0.8741 0.6357 0.1343 0.6704 0.0006 0.0585 0.1065 0.3491
Table 4 The parameter estimates of improved regression for benzyl alcohol conversion (y1) using back elimination
Term Intercept T P C M R T×C T×M T×R M×R P×P C×C M×M R×R
Estimate 40.242 29.561 15.395 -17.882 26.324 4.940 -9.414 15.742 8.164 -8.951 -16.424 8.426 -6.534 -0.291
Standard error 1.274 2.155 2.155 2.155 2.140 1.814 7.190 7.190 7.190 4.988 3.532 3.532 3.546 0.261
t-Ratio 31.590 13.717 7.144 -8.298 12.300 2.723 -1.309 2.189 1.135 -1.794 -4.650 2.386 -1.843 -1.112
p-Value <0.0001 <0.0001 <0.0001 <0.0001 <0.0001 0.0119 0.2028 0.0385 0.2674 0.0853 0.0001 0.0253 0.0778 0.2770
Table 5 The parameter estimates of improved regression for turnover frequency (y2) using back elimination
Term Intercept T P C M R M×R P×P M×M R×R
Estimate 0.974 0.699 0.369 0.181 -0.088 0.180 -0.520 -0.345 -0.497 -0.017
Standard error 0.053 0.104 0.104 0.104 0.103 0.087 0.239 0.168 0.168 0.013
12
t-Ratio 18.480 6.749 3.562 1.752 -0.857 2.068 -2.175 -2.055 -2.955 -1.339
p-Value <.0001 <.0001 0.0013 0.0907 0.3987 0.0480 0.0382 0.0493 0.0063 0.1912
*
*
2
SBET= 457 m /g
2
(i)
*
(e)
*
*
SBET= 405 m /g
* 2
Intensity /a.u.
(c)
Intensity /a.u.
SBET= 596 m /g
(d)
2
SBET= 641 m /g
(b)
2
SBET= 689 m /g
2
(h)
SBET= 485 m /g
(g)
SBET= 564 m /g
2
(a) (f)
2
SBET= 663 m /g
2
SBET= 850 m /g
10
20
30
40
50
60
10
70
20
2θ / degree
30
40
50
60
70
2θ / degree
Conversion
Figure 1 XRD patterns of KMn/C catalysts: (a) Active carbon; (b) K0.5Mn/C (Mn, 4.5 wt%); (c) K0.5Mn/C (Mn, 7.5 wt%); (d) K0.5Mn/C (Mn, 10.5 wt%); (e) K0.5Mn/C (Mn, 15 wt%); (f) K1.0Mn/C (Mn, 4.5 wt%); (g) K1.5 Mn/C (Mn, 4.5 wt%); (h) K3.0Mn/C (Mn, 4.5 wt%); (i) K4.0Mn/C (Mn, 4.5 wt%)
89.8 42.32 -4 60
85
110 0
0.5
1
1
2.5
4
0
Temperature (60,110) O2 Pressure (0, 1) Concentration (1, 4)
7.026
15
0
% Mn (0, 15)
0.855
4
Ratio (0, 4)
TOF
2.05 0.97 -0.11 60
85
110
0
0.5
1
1
2.5
4
Temperature (60,110) O2 Pressure (0, 1) Concentration (1, 4)
0
7.026
15
% Mn (0, 15)
0
0.855
4
Ratio (0, 4)
Figure 2 Prediction Profiler showing the influence of each variable on the responses; Top: Conversion of Benzyl Alcohol, Bottom: Turnover Frequency.
13
4 Concentration (1, 4)
Conversion
9.98 Concentration (1, 4) 19.67 29.36 68.11
39.05 58.42
0
Temperature (60,110)
48.73 1 60
Temperature (60,110)
110
Figure 3 Contour plot (left) and surface plot (right) of benzyl alcohol conversion as a function of concentration of benzyl alcohol and reaction temperature at fixed process parameters.
4
Ratio (0, 4)
Conversion
68.11 0.3
Ratio (0, 4)
48.73 39.05 29.36
0
9.98
Temperature (60,110)
19.67 0 60
Temperature
110
Figure 4 Contour plot (left) and surface plot (right) of benzyl alcohol conversion as a function of K:Mn ratio and reaction temperature at fixed process parameters.
14
15
Conversion 68.11
% Mn (0, 15)
58.42 48.73 39.05 29.36
% Mn (0, 15)
19.67 9.98
0 Temperature (60,110)
0 60
Temperature (60,110)
110
Figure 5 Contour plot (left) and surface plot (right) of benzyl alcohol conversion as a function of %Mn and reaction temperature at fixed process parameters.
4
Conversion 68.11
Ratio (0, 4)
58.42
Ratio (0, 4)
48.73 39.05 29.36
0
19.67
% Mn (0, 15)
9.98
0 0
% Mn (0, 15)
15
Figure 6 Contour plot (left) and surface plot (right) of benzyl alcohol conversion as a function of K:Mn and % Mn at fixed process parameters.
15
4
Ratio (0, 4)
TOF
Ratio (0, 4)
2.45 2.10
1.75 1.40 1.05 0.70 0.35 0 0 0
0
% Mn (0, 15)
15
% Mn (0, 15)
80
80
70
70 60
60
Conversion Actual
Conversion Actual
Figure 7 Contour plot (left) and surface plot (right) of turnover frequency as a function of K:Mn ratio and % Mn at fixed process parameters.
50 40 30 20
50 40 30 20 10
10
0
0 0
10
20
30
40
50
60
70
0
80
10
20
30
40
50
60
70
80
Conversion Predicted P<.0001 Adj. R-Sq=0.93 RMSE=5.131
Conversion Predicted P<.0001 Adj. R-Sq=0.95 RMSE=4.602
Figure 8 Regression models of benzyl alcohol conversion. Left: Initial model; Right: Improved model
16
90
2.5
2.5
1.5
TOF Actual
2
l
3
TOF A t
3
2 1.5
1
1
0.5
0.5
0
0
-0.5
-0.5 0
0.5
1.0
1.5
2.0
2.5
3.0
0
TOF Predicted P<.0001 Adj. R-Sq=0.87 RMSE=0.266
0.5
1.0
1.5
2.0
TOF Predicted P<.0001 Adj. R-Sq=0.90 RMSE=0.221
Figure 9 Regression models of turnover frequency. Left: Initial model; Right: Improved model
Conversion of benzyl alcohol
100 80 60 40 Actual Predicted
20 0 2
2.5
7
12
17
%Mn Figure 10 Comparison of the predicted value and actual value of conversion of benzyl alcohol at different %Mn.
17
3.0
5 Actual Predicted
Turnover Frequency
4 3 2 1 0 2
7
12
17
%Mn Figure 11 Comparison of the predicted value and actual value of turnover frequency at different %Mn.
18