BUY SUHANI ADILABADKAR RESEARCH REPORT Q2 FY18
DABUR INDIA LTD CONSOLIDATED
QUARTERLY OUTLOOK & RECOMMENDATION DABUR India Ltd reported spectacular sequential growth for the September quarter FY18 but with mild yearly numbers. Revenue or Income From Operations fell 1% YOY at Rs. 19589 Mn in September quarter against Rs. 19816 Mn same period previous year. Sequential growth was reported at 9% in September quarter driven by 10% domestic & volume growth of 7.2% with international business growing at 3.9% in constant currency. Domestic & international business contributed 68% & 29% respectively in September quarter FY18. EBDITA grew 1% and stood at Rs. 5042 Mn against Rs. 4979 Mn corresponding quarter previous year. On quarterly basis EBDITA growth was 29% in Q2 FY18. Profit After Tax grew 37% QOQ at Rs. 3627 Mn against Rs. 3584 Mn corresponding quarter previous year with yearly growth of just 1%. Operating Expenditure declined 2% YOY from Rs. 15730 Mn in Q2 FY17 to Rs. 15390 Mn in September quarter FY18. Other expenditure fell from 12.1% of sales to 10.8% of sales on the back of cost synergies and declined 12% YOY supporting expenditure degrowth. On quarterly basis, operating expenditure jumped 4% QOQ in Q2 FY18. EBDITA margin expanded 394 basis points QOQ and 61 basis points yearly at 25.74% in the current quarter. Net Profit Margin too followed suit, rising 372 basis points sequentially and 43 basis points YOY. Net Profit Margin was reported at 18.51% against 18.08% same period previous quarter. Taxation was almost constant at Rs. 880 Mn where as finance costs declined 20% and were reported at Rs. 133 Mn YOY buttressing the bottom-line. Depreciation on the other hand jumped 12% at Rs. 401 Mn in September quarter. Other Income fell 6% YOY and rose 4% on quarterly basis. Other Income was reported at Rs. 843 Mn compared to Rs.893 Mn corresponding quarter previous year. Dabur India Ltd is one of the most trusted Indian brand and world’s largest Ayurvedic and Natural Health Care Company. Dabur operates in key consumer product categories like Hair Care, Oral Care, Health Care, Skin Care, Home Care and Foods. The company has wide distribution network of about 6 million retail outlets in both urban and rural markets. The company’s revenue basket is broadly divided into consumer care, food & retail business. Consumer care business contributing 83% of total revenues de-grew 2% YOY with positive sequential growth of 13% in the September quarter. Food business contributes the next biggest chunk of about 14% exhibiting 5% YOY growth. Retail business reported negative growth both yearly & sequentially. Consumer Care, Food & Retail revenues were reported at Rs 16147 Mn, Rs. 2828 Mn & Rs. 265 Mn respectively in September FY18. DABUR Ltd has weathered GST disruption and is expected to perform better with an uptick in the domestic rural economy and global growth. The company has collaborated with Amazon to increase its online and overseas presence and aims to double its ecom volumes which are currently about 1.5% of domestic sales. The company has improved its bottom-line in September quarter with strong volume growth of 7% without any beneficial restocking impact. With respect to product category, Real juices witnessed margin improvement with market share of 55% in Q2 FY18, Dabur Honey grew by 8.6% reversing the declining trend of previous quarters and oral care growth was around 23%. Dabur seems to have stabilized its business model and is expected to take competition head on in the coming quarters. We recommend BUY for the stock for medium & long term investment with target price of Rs. 550 and PE multiple of 45.62 x FY18E & 42.96 x FY19E.
CMP
Rs. 358.65
TARGET
Rs.550.00
INDUSTRY
PERSONAL PRODUCTS
SCRIP CODE
500096
FACE VALUE
Rs.1.00
MARKET Rs. 631762 Mn CAP 52 WEEK Rs.362.00 /Rs.263.10 HIGH/LOW SHAREHOLDING PATTERN (%) 68.05 PROMOTER PUBLIC 31.95 OTHERS TOTAL 100.00 Q2 FY18 Q2 FY17 CHN% In Mn REVENUE 19589.30 19816.20 -1% PAT
3626.70
3583.50
1%
EBDITA EPS
5042.20
4979.20
1%
2.06
2.03
1%
FY17A
FY18E
FY19E
REVENUE
77014.40
79324.83
83291.07
PAT
12803.10
13848.56
14707.03
EBDITA
18072.90
19484.29
20458.51
EPS
7.27
7.86
8.35
PE
49.34
45.62
42.96
In Mn
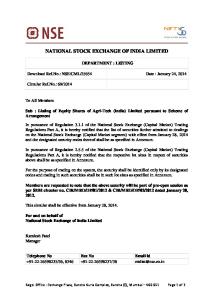
DABUR LTD V/S S&P BSE SENSEX
PERFORMANCE METRICS (September Quarter FY18) Profitability Analysis EBDITA (Rs. In Mn)
REVENUE GROWTH (Rs. In Mn) 20000
19816
19589
Q2 FY18
5042
19500 19147 Q1 FY18
19000 18500 18000
3902
18529 Q4 FY17
4826
17901 Q3 FY17
17500 17000
4169
Q2 FY17
16500
0
Q2 FY17 Q3 FY17 Q4 FY17 Q1 FY18 Q2 FY18
DABUR reported strong sequentially growth rebuffing GST impact and is back on the growth track after a lackluster June quarter. Revenue declined mildly YOY by 1% whereas sequential growth was 9% in September quarter. PAT & EBDITA grew 1% YOY whereas on quarterly basis growth was in double digits. PAT stood at Rs. 3627 Mn against Rs. 2649 Mn in Q1 FY18 rising 37% QOQ. EBDITA quarterly growth was 29% at Rs. 5042 Mn in Q2 FY18 compared to Rs. 4979 Mn same period previous year. Operating cost stood at Rs. 15390 Mn against Rs. 15730 Mn same period previous year declining 2% YOY and increasing 4% QOQ. The company reported strong revenue growth on the back of strong growth witnessed in oral care, skin care and digestives segment. Apart from domestic business, international business has also grown strongly especially in Egypt, Nigeria and Turkey. The company is gaining positive momentum from rural uptick and receding GST impact. With consumer demand for nature and Ayurveda-based products on the rise, Dabur has positioned itself as the ‘Science-based Ayurveda’ specialist which will pave its way for long term future growth.
4979 1000
2000
3000
4000
5000
6000
NET PROFIT GROWTH (Rs. In Mn) 4000 3627
3584 3337
3500 3000
2938 2649
2500 2000 1500 1000 500 0 Q2 FY17 Q3 FY17 Q4 FY17 Q1 FY18 Q2 FY18
OTHER INCOME (Rs. In Mn)
NET PROFIT MARGIN
843 Q2 FY18
20.00%
18.51% 18.08%
17.43%
18.00% 16.00%
Q1 FY18
813
14.00%
15.85% 14.80%
12.00% Q4 FY17
650
10.00% 8.00%
Q3 FY17
6.00%
831
4.00% Q2 FY17
893
2.00% 0.00%
0
200
400
600
800
1000
Q2 FY17 Q3 FY17 Q4 FY17 Q1 FY18 Q2 FY18
Expenditure Analysis
Rs. In Mn
Q2 FY18
Q2 FY17
CHG%
Cost Of Materials
7721.50
8012.20
-4%
Purchases of Stock In Trade
1266.90
1945.20
-35%
Employee Benefit Expense
COST OF MATERIAL (Rs. In Mn) 8200 8000
8068
8012
7722
7800 2037.30
2158.10
-6%
7420
7600 7400
Advertisement
1457.10
1494.10
-2%
7200
7042
7000
6800 Other Expense
2124.50
2402.90
-12%
Depreciation & Amortization
400.80
357.40
12%
6600 6400 Q2 FY17 Q3 FY17 Q4 FY17 Q1 FY18 Q2 FY18
Material consumed accounted for the biggest chunk, 53% of operating expenditure fell 4% YOY at Rs. 7722 Mn and jumped 4% QOQ in September quarter. Stock in trade constitutes 9% of total operating expenditure and stood at Rs. 1267 Mn against Rs. 1945 Mn corresponding quarter previous year. Employee benefit expense declined 6% YOY at Rs. 2037 Mn and was stagnant quarterly accounting 14% of operating expenditure in the Q2 FY18. Expenditure on advertisement fell 3% QOQ at Rs. 1457 Mn in September quarter and declined 2% YOY. Other Expenses were reported at Rs. 2125 Mn declining 12% YOY against Rs. 2403 Mn corresponding quarter previous year. .
DEPRECIATION (Rs. In Mn)
INTEREST EXPENSE (Rs. In Mn) 180
450 400
395
391
401
357
350
160 140
333
300
120
250
100
200
80
150
60
100
40
50
20
0
TAXATION EXPENSE (Rs. In Mn) 1200
800
600
139
133
133
117
0 Q2 FY17 Q3 FY17 Q4 FY17 Q1 FY18 Q2 FY18
1000
166
977 880
873 753 589
400 200 0 Q2 FY17 Q3 FY17 Q4 FY17 Q1 FY18 Q2 FY18
Q2 FY17 Q3 FY17 Q4 FY17 Q1 FY18 Q2 FY18
EBDITA margin for the current quarter stood at 25.74% compared to 25.13% same period previous year. On yearly basis, EBDITA margins jumped 61 basis points whereas sequential expansion was 394 basis points. Operating expenditure de-growth was at 2% YOY but on quarterly basis it jumped 4% in September quarter. Higher EBDITA expansion was due to higher revenue and stable other income. Depreciation has been on the rise over the past three quarters rising 3% QOQ and 12% YOY. Depreciation stood at Rs. 401 Mn in Q2 FY18 against Rs. 357 Mn corresponding quarter previous year. Interest expense plunged 20% YOY in the current quarter at Rs. 133 Mn. On absolute basis decline was Rs. 33 Mn but was stagnant sequentially. Interest Expenses constituted 3.67% of the total Net Profit in Q2 FY18. Taxation expenditure accounted 4% of total revenue in Q2 FY18. The YOY rise was just 1% from Rs. 873 Mn to Rs. 880 Mn in the September quarter. Total expenditure including interest cost and taxation constituted 86% of the total revenue in the September quarter same as the corresponding quarter previous year.
Segment Revenue Rs. In Mn Consumer Care Business Food Business
Q2 FY18
Q2 FY17
CHG%
16146.90
16483.70
-2%
2828.20
2697.20
5%
264.90
284.30
-7%
Retail Business Other Segments
309.30
292.00
6%
Other Operating Revenue
40.00
59.00
-32%
DOMESTIC FMCG SALES - CATEGORY WISE
Foods 19%
Hair Care 20%
OTC & Ethicals 9% Digestives 6%
Health Supplement Home 15% Care 8%
Oral Care 19%
Skin Care 5%
SEGMENT REVENUE Retail business 1%
Other Segments 2%
Food Business 14%
Consumer care business 83%
After the disruption in Q1 FY18, business seems to have stabilized as evident to improved margins and strong volume growth. Domestic contribution has increased from 65% in Q2 FY17 to 68% in Q2 FY18. Oral care category posted growth of 22.8% with toothpaste and toothpowder category reporting 26% & 5% growth respectively. Dabur launched red gel in August 2017 and is witnessing good traction. Hair oil & Skin care jumped 2% & 16% respectively in Q2 FY18. Homecare category also reported strong growth of 10% YOY due strong performance of odomos and odonil. Shampoos & post wash category declined 14.9% YOY. On the whole share of hair care category fell from 22% to 20% in September quarter FY18. Health supplements grew 3% YOY driven by Honey growing 9% and digestives posting growth of 12% in Q2 FY18. OTC category jumped 6% whereas ethicals declined 2.5% mainly due to disruption caused by GST and higher contribution of wholesale channel. Food category witnessed strong growth driven by beverages. Market share of Real improved 176 basis points and achieved 55.1% market share. Activ coconut water performed well reporting good performance
during the quarter. International Business contributed 28.5% as compared to 31.6% last year. International Business posted 3.9% growth in constant currency terms during Q2 FY18. Severe devaluation of Egyptian Pound, Naira and Turkish Lira led to significant translation loss of about Rs. 970 Mn impacting about 5% of consolidated sales. Egypt on the other hand reported strong growth of 38% and Hobi grew at 27% in constant currency. Sub Saharan Africa market reported 18% growth driven by localization and distribution expansion initiatives in Nigeria, South Africa and East Africa.GCC markets were under pressure due to shutdown in Algeria because of import quota embargo and added pressure on sales.
Corporate Profile Dabur India Ltd. is one of India’s leading FMCG Companies with a legacy of quality and experience of over 133 years. Dabur is India’s one of the most trusted brands and the world’s largest Ayurvedic and Natural Health Care Company. The 132-year-old ayurvedic company, promoted by the Burman family, started operating in 1884 as an Ayurvedic medicines company. From its humble beginnings in the bylanes of Calcutta, Dabur India Ltd has come a long way to become one of the biggest Indian-owned consumer goods companies with the largest herbal and natural product portfolio in the world. Overall, Dabur has successfully transformed itself from being a family-run business to a professionally managed enterprise. Dabur is also a world leader in Ayurveda with a portfolio of over 250 Herbal/Ayurvedic products. Dabur's FMCG portfolio includes five flagship brands with distinct brand identities -- Dabur as the master brand for natural healthcare products, Vatika for premium personal care, Hajmola for digestives, Réal for fruit juices and beverages and Fem for fairness bleaches and skin care products. Dabur operates in key consumer product categories like Hair Care, Oral Care, Health Care, Skin Care, Home Care and Foods. The ayurvedic company has a wide distribution network, covering 6 million retail outlets with a high penetration in both urban and rural markets. Dabur's products also have huge presence in the overseas markets and are available in over 120 countries across the globe. Its brands are highly popular in the Middle East, SAARC countries, Africa, US, Europe and Russia.
Financial Analysis QUARTERLY PROFIT & LOSS STATEMENT OF DABUR INDIA LTD FROM 31st March 2017 TO 31st Dec 2017E VALUE
31-March-17
30- June-17
30-Sep-17
31-Dec-17E
Rs. In Million
3 months
3 months
3 months
3 months
19146.80
17900.60
19589.30
20372.87
OTHER INCOME
650.40
812.80
843.20
927.52
TOTAL INCOME
19797.20
18713.40
20432.50
21300.39
EXPENDITURE
-14971.20
-14811.70
-15390.30
-16159.82
EBDITA
4826.00
3901.70
5042.20
5140.58
DEPRECIATION
-395.40
-390.60
-400.80
-420.84
PROFIT BEFORE INTEREST & TAX
4430.60
3511.10
4641.40
4719.74
INTEREST
-116.60
-132.80
-133.20
-139.86
EXCEPTIONAL ITEM
0.00
-145.40
0.00
0.00
PROFIT BEFORE TAX
4314.00
3232.90
4508.20
4579.88
TAX
-976.70
-588.80
-879.50
-809.14
PROFIT AFTER TAX
3337.30
2644.10
3628.70
3770.74
EQUITY CAPITAL
1761.50
1761.50
1761.50
1761.50
FACE VALUE
1.00
1.00
1.00
1.00
EPS
1.89
1.50
2.06
2.14
INCOME FROM OPERATIONS
ANNUAL PROFIT & LOSS STATEMENT OF DABUR INDIA LTD FROM 2016 TO 2020E VALUE
31- Mar-16
31- Mar-17
31- Mar-18E
31-Mar-19E
31-Mar 20E
Rs. In Million
12 months
12 months
12 months
12 months
12 months
INCOME FROM OPERATIONS
78687.70
77014.40
79324.83
83291.07
87039.17
OTHER INCOME
2171.90
2983.50
3013.34
3164.00
3322.20
TOTAL INCOME
80859.60
79997.90
82338.17
86455.08
90361.37
EXPENDITURE
-63504.90
-61925.00
-62853.88
-65996.57
-68768.42
EBDITA
17354.70
18072.90
19484.29
20458.51
21592.95
DEPRECIATION
-1331.90
-1428.60
-1571.46
-1681.46
-1765.54
PROFIT BEFORE INTEREST & TAX
16022.80
16644.30
17912.83
18777.04
19827.41
-484.80
-540.30
-551.11
-567.64
-596.02
EXCEPTIONAL ITEM
0.00
0.00
-145.40
0.00
0.00
PROFIT BEFORE TAX
15538.00
16104.00
17216.33
18209.41
19231.39
TAX
-2999.00
-3303.40
-3369.47
-3504.25
-3609.37
PROFIT AFTER TAX
12539.00
12800.60
13846.86
14705.16
15622.02
MINORITY INTEREST
-0.10
-33.70
0.00
0.00
0.00
SHARE OF PROFIT/LOSS OF JV
-27.40
2.50
1.70
1.87
2.06
NET PROFIT
12511.50
12769.40
13848.56
14707.03
15624.08
EQUITY CAPITAL
1759.10
1761.50
1761.50
1761.50
1761.50
RESERVES
39947.00
46712.40
56989.13
63827.82
70210.61
FACE VALUE
1.00
1.00
1.00
1.00
1.00
EPS
7.11
7.27
7.86
8.35
8.87
INTEREST
Ratio Analysis Year
FY 16A
FY 17A
FY18E
FY19E
FY20E
7.11
7.27
7.86
8.35
8.87
NPM
15.90%
16.58%
17.46%
17.66%
17.95%
EBDITA MAGIN
22.06%
23.47%
24.56%
24.56%
24.81%
ROE
30.07%
26.41%
23.57%
22.42%
21.71%
DEBT EQUITY
0.19
0.19
0.18
0.17
0.17
EV/EBDITA
35.90
34.42
31.94
30.41
29.38
BOOK VALUE
23.71
27.52
33.35
37.23
40.86
P/BV
15.13
13.03
10.75
9.63
8.78
PE
50.43
49.47
45.62
42.96
40.44
EPS
BALANCE SHEET OF DABUR INDIA LTD FROM 2016-2020E CAPITAL & LIABILITIES (Rs. In Mn)
2016
2017
2018E
2019E
2020E
1759.10 39947.00
1761.50 46712.40
1761.50 56989.13
1761.50 63827.82
1761.50 70210.61
41706.10
48473.90
58750.63
65589.32
71972.11
Minority Interest NON CURRENT LIABILITIES
217.10
247.70
272.47
305.17
335.68
Borrowings
3424.20
4712.10
5183.31
5442.48
5714.60
Share Capital Reserves NETWORTH
Other Financial Liabilities
49.60
37.10
5.57
6.12
6.73
Provisions
508.80
534.00
598.08
669.85
736.83
Deferred Tax Liabilities TOTAL NON CURRENT LIABILITIES
882.40
1080.40
1210.05
1331.05
1450.85
4865.00
6363.60
6997.00
7449.50
7909.02
Borrowings
4497.40
4403.30
5195.89
5819.40
6517.73
Trade Payables
13301.20
13026.70
12896.43
13541.25
14624.56
Other Financial Liabilities
1203.30
1737.20
1007.58
1057.95
1142.59
Other Current Liabilities
2317.30
1754.40
1912.30
2007.91
2108.31
Provisions
905.40
918.90
1148.63
1229.03
1376.51
Current Tax Liabilities TOTAL CURRENT LIABILITIES
310.20
384.70
430.86
465.33
488.60
22534.80
22225.20
22591.69
24120.88
24881.78
TOTAL EQUITY & LIABILITIES
69323.00
77310.40
88611.79
97464.87
105098.59
12387.70
14790.20
15656.84
17941.03
19867.31
Capital Work In Progress
448.00
421.00
568.35
596.77
626.61
Investment Property
606.00
549.90
604.89
695.62
765.19
Goodwill
4105.30
4105.30
4228.46
4439.88
4661.88
Other Intangible Assets
181.00
138.60
139.99
141.39
142.80
0.00
0.00
1.80
1.22
1.25
18809.10
24994.10
28743.22
31617.54
34146.94
131.70
123.60
185.40
222.48
255.85
CURRENT LIABILTIES
ASSETS (Rs. In Mn) NON CURRENT ASSETS Property, Plant & Equipment
Biological Assets Investments Others
497.60
1023.00
1012.77
1053.28
1084.88
37166.40
46145.70
51141.71
56567.82
61408.65
Inventories
10965.00
11067.10
11288.44
11831.24
12304.93
Investments
7492.30
7407.50
11111.25
12387.46
13254.58
Trade Receivables
8092.00
6504.20
7805.04
8975.80
9873.38
Cash & Cash Equivalents
1311.50
1632.20
1795.42
1939.05
2055.40
Bank balances
886.70
1415.90
1585.81
1728.53
1832.24
Others
290.60
341.10
562.82
647.24
711.96
Current Tax Asset
30.60
0.00
0.00
0.00
0.00
Other Current Assets
3087.90
2796.70
3300.11
3366.11
3635.40
Assets Held For Sale
0.00
0.00
21.20
21.62
22.06
32156.60
31164.70
37470.08
40897.05
43689.94
69323.00
77310.40
88611.79
97464.87
105098.59
Other Non Current Assets TOTAL NON CURRENT ASSETS CURRENT ASSETS
TOTAL CURRENT ASSETS TOTAL ASSETS
Comparative Analysis
Q2 FY 18
EPS (Rs)
REVENUE (Rs. In Mn)
PAT (Rs. In Mn)
EBDITA (Rs. In Mn)
MKT CAP (Rs. In Mn)
DABUR LTD
2.06
19589
3627
5042
631762
MARICO LTD
1.41
15362.90
1850
2805
405431
HUL LTD Standalone
5.90
81990
12760
18860
2975076
GODREJ CONSUMER PRODUCTS LTD
5.31
25066
4680
5508
672132
SUHANI ADILABADKAR
[email protected] 9701063320
Disclaimer The information and opinions contained in the research reports have been compiled or arrived at from sources believed reliable but no representation or warranty, express or implied, is made as to their accuracy or completeness. The research report does not constitute a personal recommendation or take into account the particular investment objectives, financial situations, or needs of individual clients. Clients should consider whether any advice or recommendation in this research is suitable for their particular circumstances and, if appropriate, seek professional advice, including but not limited to tax advice. The reports do not take into account the particular investment objectives, financial situations, risk profile or needs of individual clients. The user assumes the entire risk of any use made of this information. This report is not to be relied upon in substitution for the exercise of independent judgment. The price and value of investments referred to in this research and the income from them may fluctuate. Past performance is not a guide to future performance, future returns are not guaranteed, and a loss of original capital may occur. Research data and reports published/ emailed/ text messaged via Short Messaging Services, Online Messengers, WhatsApp etc/transmitted through mobile application/s, including but not limited to FLIP™, Video Widget, telephony networks, print or electronic media and or those made available/uploaded on social networking sites (e.g. Facebook, Twitter, LinkedIn etc) is for informational purposes only. The reports are provided for assistance and are not intended to be and must not alone be
taken as the basis for an investment decision. The user assumes the entire risk of any use made of this information. Though disseminated to clients simultaneously, not all clients may receive the reports at the same time. We will not treat recipients as clients by virtue of their receiving this report. The reports include projections, forecasts and other predictive statements which represent our assumptions and expectations in the light of currently available information. These projections and forecasts are based on industry trends, circumstances and factors which involve risks, variables and uncertainties. The actual performance of the companies represented in the report may vary from those projected. The opinions expressed in the reports are subject to change but we have no obligation to tell our clients when our opinions or recommendations change. The reports are non-inclusive and do not consider all the information that the recipients may consider material to investments. We shall not be in any way responsible for any indirect, special or consequential damages that may arise to any person from any inadvertent error in the information contained in the reports nor do they take guarantee or assume liability for any omissions of the information contained therein. Information contained therein cannot be the basis for any claim, demand or cause of action. These data, reports and information do not constitute scientific publication and do not carry any evidentiary value whatsoever. The user should consult their own advisors to determine the merits and risks of investment and also read the Risk Disclosure Documents for Capital Markets and Derivative Segments as prescribed by Securities and Exchange Board of India before investing in the Indian Markets. The securities discussed in this report may not be suitable for all investors. Investors must make their own investment decision based on their own investment objectives, goals and financial position and based on their own analysis. Prospective investors and others are cautioned that any forward-looking statements, if any, are not predictions and may be subject to change without notice. This report may provide the addresses of, or contain hyperlinks to websites. Except to the extent to which the report refers to material we take no responsibility whatsoever for the contents therein. Such addresses or hyperlinks are provided solely for your convenience and information and the content of the linked site does not in any way form part of this report. Accessing such website or following such link through this report shall be at your own risk. The author of this Research Report accepts no liability and will not in any way be responsible for the contents of this report or for any losses, costs, expenses, charges,
including notional losses/lost opportunities incurred by a recipient as a result of acting or non-acting on any information/material contained in the report. This is not an offer to sell or a solicitation to buy any securities or an attempt to influence the opinion or behavior of investors or recipients or provide any investment/tax advice. The securities described herein may or may not be eligible for sale in all jurisdictions or to certain category of investors. Persons in whose possession this document may come are required to inform themselves of and to observe such restriction.