BUY SUHANI ADILABADKAR RESEARCH REPORT Q4 FY17
WHEELS INDIA LTD
QUARTERLY OUTLOOK & RECOMMENDATION
Wheels India Ltd reported stable yearly growth in March quarter FY17. Revenue or Income From Operations rose 10% YOY from Rs. 5075 Mn in Q4 FY16 to Rs. 5567 Mn in the current Q4 FY17. PAT also performed well rising at 8% YOY and stood at Rs. 184 Mn compared to Rs. 170 Mn corresponding March quarter previous year. EBDITA stood at Rs. 499 Mn compared to Rs. 505 Mn in the same period previous year declining mildly by 1% YOY. Quarterly growth was stronger with Revenue & EBDITA rising 4% & 11% whereas Net Profit jumped a phenomenal 39% in the current Q4 FY17. Operating Expenditure jumped 11% YOY from Rs. 5076 Mn in Q4 FY16 to Rs. 5242 Mn in the current quarter. On quarterly basis there was lower jump of 3% resulting in higher sequential operating margins. As a result EBDITA margin rose 58 basis points sequentially whereas there was a decline of 99 basis points on yearly basis. EBDITA Margin was reported at 8.96% in the current March quarter. Operating costs constituted 94% of total revenues. In addition to that, higher interest or Finance costs need to be curtailed which comprise 2% of Revenues or 67% of Net Profit. Net Profit Margin was reported at 3.31% declining mildly by 4 basis points YOY but a healthy rise of 84 basis points QOQ. Other Income also supported the bottom-line by rising to Rs. 7.60 Mn in Q4 FY17 compared to Rs. 5 Mn corresponding quarter previous year, rising 52% YOY. QOQ, other Income declined 8% from Rs. 8.30 Mn in December quarter to Rs. 7.60 Mn in the current Q4 FY17. Wheels India is a leading manufacturer of steel wheels for passenger cars, utility vehicles, trucks, buses, tractors & construction equipment. Apart from wheels other company divisions are air suspension, energy equipment & heavy engineering division. The wheels division contributes 50% of revenues for the company. The Non Wheels business contributed 15% of the business for the company. The company has a diversified base with over 30 customers spread globally such as Japan, Korea, US, Brazil, China to name a few. We recommend BUY for the stock for medium & long term investment with PE multiple of 23.94 x FY18E & 20.57 x FY19E with a target price of Rs. 1638.
INDUSTRY
CMP
Rs. 1424.80
TARGET
Rs. 1638.00
AUTO PARTS & EQUIPMENT
SCRIP CODE
590073
FACE VALUE
Rs. 10.00
MARKET CAP
Rs. 17140.34 Mn
52 WEEK Rs. 1491.90 /Rs.1081.00 HIGH/LOW SHAREHOLDING PATTERN (%) PROMOTER 75.00 PUBLIC 25.00 OTHERS TOTAL 100.00 In Mn Q4 FY17 Q4 FY16 CHN% REVENUE
5567.30
5075.40
10%
PAT
184.00
169.70
8%
EBDITA
499.10
505.40
-1%
EPS
15.30
14.11
8%
FY17A
FY18E
FY19E
21728.70
22880.32
23795.53
PAT
593.00
715.95
833.35
EBDITA
1899.70
2064.66
2234.87
EPS
49.29
59.51
69.27
PE
28.90
23.94
20.57
In Mn REVENUE
WHEELS INDIA LTD V/S S&P BSE SENSEX
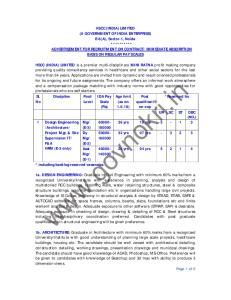
PERFORMANCE METRICS (March Quarter FY17) Profitability Analysis EBDITA (Rs. In Mn)
NET PROFIT GROWTH (Rs. In Mn) 200 180 160 140
184
Q4 FY17
499
170 146
131
Q3 FY17
450
132
120 Q2 FY17
100
459
80 Q1 FY17
60
492
40 20
Q4 FY16
505
0 Q4 FY16 Q1 FY17 Q2 FY17 Q3 FY17 Q4 FY17
400
Wheels India Ltd reported strong sequential numbers in the March quarter FY17, with stable yearly result. Revenue rose by 10% YOY from Rs. 5075 Mn to Rs. 5567 Mn in the current March quarter. Net Profit or Profit After Tax jumped 8% from Rs.170 Mn in Q4 FY16 to Rs. 184 Mn in the current Q4 FY17. Sequential growth was reported at a whopping 39% in the current March quarter. Earnings Before Depreciation, Interest, Tax & Amortization (EBDITA) grew in double digits at 11% sequentially with mild decline of 1% yearly. EBDITA was reported at Rs. 499 Mn in current March quarter against Rs. 505 Mn same period previous year. Operating cost jumped 11% YOY and 3% on quarterly basis. As a result EBDITA declined 99 basis points YOY whereas there was a jump of 58 basis points QOQ. Operating costs constitute 94% of total revenues and stood at Rs. 5242 Mn in March quarter FY17. Other Income was reported at Rs. 7.60 Mn in the current March quarter against Rs. 5 Mn corresponding quarter previous year. Non Wheels business has contributed around 15% in the current quarter and around 50% of revenue growth in FY17 came from Non Wheels Business.
420
440
460
480
500
520
REVENUE GROWTH (Rs. In Mn) 5567
5600 5457
5500
5365
5340
5400 5300 5200 5100
5075
5000 4900 4800 Q4 FY16
Q1 FY17
Q2 FY17
Q3 FY17
Q4 FY17
OTHER INCOME (Rs. In Mn)
NET PROFIT MARGIN 4.00%
Q4 FY17
7.60
3.50%
3.34%
3.31%
3.00%
Q3 FY17
2.74%
8.30
2.46%
2.50%
Q2 FY17
2.40%
2.00%
6.90
1.50%
Q1 FY17
9.10
Q4 FY16
1.00%
0.50%
5.00
0.00% 0.00
5.00
10.00
Q4 FY16
Q1 FY17
Q2 FY17
Q3 FY17
Q4 FY17
Expenditure Analysis
Rs. In Mn
Cost Of Materials
Q4 FY17
3697.80
Q4 FY16
3509.40
CHG%
5.37%
COST OF MATERIAL (Rs. In Mn) 3700 3650 3600
Employee Benefit Expenses
620.40
Depreciation & Amortization
165.90
619.60
0.13%
3550
3500 3450
154.70
7.24%
3698
3687
3509 3446 3427
3400 3350 3300
Other expenses
777.80
770.00
1.01%
3250
Q4 FY16 Q1 FY17 Q2 FY17 Q3 FY17 Q4 FY17
Operating cost for the quarter has been controlled by the company and rose 3% QOQ. Cost of Material accounts for the largest chunk i.e 70% of operating expenditure rising 5% YOY & 7% sequentially and stood at Rs. 3698 Mn in the current March quarter. Employee Benefit Expenses are almost constant at Rs. 620 Mn both yearly and quarterly in Q4 FY17. Employee Benefit Expenses constituted 12% of total operating expenditure in the current quarter. Other Expenses stood at Rs. 778 Mn compared to Rs. 770 Mn same period previous year. The quarterly jump was 4% whereas YOY basis rise was 1% in Q4 FY17.
DEPRECIATION (Rs. In Mn)
INTEREST EXPENSE (Rs. In Mn) 166
166 161
162
124 160
122
160 158
118
153
152
116
150
117
116
112
146 144 Q4 FY16
Q1 FY17
Q2 FY17
Q3 FY17
Q4 FY17
TAXATION EXPENSE (Rs. In Mn) 70
63 54
52
49
40 30
122
114
148
50
123
120
155
154
60
127
126
164
156
128
26
20 10 0 Q4 FY16 Q1 FY17 Q2 FY17 Q3 FY17 Q4 FY17
110 Q4 FY16 Q1 FY17 Q2 FY17 Q3 FY17 Q4 FY17
EBDITA margin for the current quarter stood at 8.96% compared to 9.96% same period previous year. QOQ, EBDITA margin jumped 58 basis points as margin was reported at 8.39% in Q3 FY17. EBDITA margin declining 99 basis points YOY seems to be under pressure on yearly basis as Operating Expenditure grew at 11% outpacing Revenue growth a tad lower at 10% in the current March quarter. Sequentially operating expenditure was controlled and rose just 3% leading to higher sequential margins. Depreciation constituting 3% of the total operating expenditure rose 7% YOY at Rs.166 Mn whereas on quarterly terms, rise was 8% in the current March quarter. Interest Expense was reported at Rs. 123 Mn in the current quarter compared to Rs. 127 Mn in corresponding quarter previous year. Interest or finance costs
have been declining over the previous three quarters but have risen 6% QOQ. Interest costs accounts for about 67% of the total net profit which is humungous. For taxation, on yearly basis, there is a decline of 52% and in absolute value about Rs. 28 Mn in the current Q4 FY17. On quarterly basis, Taxation expenditure declined 47% or Rs. 23 Mn in absolute terms. Net Profit Margin improved by 84 basis points QOQ as Net Profit increased 39% whereas Revenue growth was just 4% in the current quarter. Net Profit Margin stood at 3.31% in the current March quarter against 2.46% previous December quarter. The yearly decline was just 4 basis points as Net Profit Margin stood at 3.34% in corresponding March quarter previous year. Total expenditure including interest cost and taxation constituted 97% of the total revenue in the current March quarter same as corresponding period previous year.
Corporate Profile Wheels India Limited is promoted by the TVS Group, India’s largest auto component manufacturers. Starting with a bus service in 1911, the TVS Group has grown to become one of India’s largest business houses with businesses in two wheelers, vehicle dealerships & logistics and auto components. Wheels India (established in 1962) is one of the largest steel wheel manufacturers in the world. The company also manufactures air suspension kits for trucks and buses. With over 15% of its turnover coming from exports, particularly from the Construction & Earth Mover equipment segment, it is truly a global player in the auto components industry. Wheels India started production of wheels for commercial vehicles in 1962 at its plant in Padi, Chennai. The company started the production of car and tractor wheels in Padi in 1965. In 1972, the company made a foray into the construction equipment sector with Hindustan Motors (now CAT India). In 1982, the company opened its second facility in Rampur for tractor wheels. Wheels India entered the wire wheel business in 1988 and also entered the air suspension market under the brand “WILRIDE”. In 1998, the company opened a facility in Pune to cater to this growing automotive hub. This facility manufactures wheels for car, trucks and busses. Wheels India is a partner to various Global OEMs like Ford, Hyundai, Tata, Caterpillar, John Deere, Komatsu, Hyundai Heavy Industries, Case New Holland, Leyland, Tafe and Suzuki.
Financial Analysis QUARTERLY PROFIT & LOSS STATEMENT OF WHEELS INDIA LTD FROM 30th Sep 2016 TO 30th June 2017E
VALUE
30-Sep-16
31-Dec-16
31- March-17
30- June-17E
Rs. In Million
3 months
3 months
3 months
3 months
5456.60
5365.20
5567.30
5734.32
OTHER INCOME
6.90
8.30
7.60
8.36
TOTAL INCOME
5463.50
5373.50
5574.90
5742.68
EXPENDITURE
-5004.70
-4923.40
-5075.80
-5228.07
EBDITA
458.80
450.10
499.10
514.61
DEPRECIATION
-159.80
-152.60
-165.90
-162.58
PROFIT BEFORE INTEREST & TAX
299.00
297.50
333.20
352.02
INTEREST
-116.50
-116.20
-123.20
-125.66
PROFIT BEFORE TAX
182.50
181.30
210.00
226.36
TAX
-51.80
-49.20
-26.00
-32.50
PROFIT AFTER TAX
130.70
132.10
184.00
193.86
EQUITY CAPITAL
120.30
120.30
120.30
120.30
FACE VALUE
10.00
10.00
10.00
10.00
EPS
10.86
10.98
15.30
16.11
INCOME FROM OPERATIONS
ANNUAL PROFIT & LOSS STATEMENT OF WHEELS INDIA LTD FROM 2016 TO 2019E VALUE
31- Mar-16
31- Mar-17
31- Mar-18E
31-Mar-19E
Rs. In Million
12 months
12 months
12 months
12 months
20162.70
21728.70
22880.32
23795.53
OTHER INCOME
18.60
31.90
38.28
44.02
TOTAL INCOME
20181.30
21760.60
22918.60
23839.56
EXPENDITURE
-18437.70
-19860.90
-20853.95
-21604.69
EBDITA
1743.60
1899.70
2064.66
2234.87
DEPRECIATION
-604.50
-639.20
-658.38
-691.29
PROFIT BEFORE INTEREST & TAX
1139.10
1260.50
1406.28
1543.57
INTEREST
-575.80
-477.90
-487.46
-497.21
PROFIT BEFORE TAX
563.30
782.60
918.82
1046.37
TAX
-163.40
-189.60
-202.87
-213.02
PROFIT AFTER TAX
399.90
593.00
715.95
833.35
EQUITY CAPITAL
120.30
120.30
120.30
120.30
RESERVES
3961.30
4483.20
4976.35
5473.99
FACE VALUE
10.00
10.00
10.00
10.00
EPS
33.24
49.29
59.51
69.27
INCOME FROM OPERATIONS
Ratio Analysis Year
FY 16A
FY 17A
FY18E
FY19E
EPS
33.24
49.29
59.51
69.27
NPM
1.98%
2.73%
3.13%
3.50%
EBDITA MAGIN
8.65%
8.74%
9.02%
9.39%
ROE
9.80%
12.88%
14.05%
14.90%
DEBT EQUITY
0.82
0.61
0.56
0.52
EV/EBDITA
11.73
10.45
9.61
8.87
BOOK VALUE
339.29
382.67
423.66
465.03
P/BV
4.20
3.72
3.36
3.06
PE
42.86
28.90
23.94
20.57
BALANCE SHEET OF WHEELS INDIA LTD FROM 2016-2019E CAPITAL & LIABILITIES (Rs. In Mn)
2016
2017
2018E
2019E
CAPITAL
120.30
120.30
120.30
120.30
RESERVES & SURPLUS
3961.30
4483.20
4976.35
5473.99
NETWORTH
4081.60
4603.50
5096.65
5594.29
Long Term Borrowings
1885.60
1361.10
1388.33
1402.21
Deferred Tax Liabilities
665.60
671.70
678.42
698.77
Other long Term Liabilities
20.30
12.00
12.24
12.48
Long Term Provisions
38.60
37.20
39.06
40.23
2610.10
2082.00
2118.05
2153.69
Short Term Borrowings
1474.90
1462.60
1477.23
1506.77
Total Outstanding Dues Of Micro & Small Enterprises
112.30
92.90
94.76
97.60
3562.80
4070.60
4396.25
4616.06
741.50
1128.60
1354.32
1557.47
Short Term Provisions
307.60
213.00
223.65
239.31
TOTAL CURRENT LIABILITIES
6199.10
6967.70
7546.20
8017.21
12890.80
13653.20
14760.90
15765.18
5168.20
5245.00
5349.90
5436.46
NON CURRENT LIABILITIES
TOTAL NON CURRENT LIABILITIES CURRENT LIABILTIES
Total Outstanding Dues Of Creditors Other Than Micro & Small Enterprises Other Current Liabilities
TOTAL EQUITY & LIABILITIES ASSETS (Rs. In Mn) NON CURRENT ASSETS Fixed Assets
Tangible Assets
Intangible Assets
15.90
18.40
20.06
21.46
Capital Work In Progress
167.40
219.30
263.16
310.53
Non Current Investments
113.10
109.50
114.98
118.42
Long Term Loans & Advances
255.40
276.60
290.43
310.76
Other Non Current Assets
122.80
148.70
163.57
188.11
TOTAL NON CURRENT ASSETS
5842.80
6017.50
6202.09
6385.74
Inventories
2976.00
2792.30
2876.07
2933.59
Trade Receivables
3458.60
4157.90
4910.08
5597.49
Cash & Cash Equivalents
49.60
103.80
160.89
217.20
Short Term Loans & Advances
560.60
576.80
605.64
623.81
3.20
4.90
6.13
7.35
7048.00
7635.70
8558.80
9379.44
12890.80
13653.20
14760.90
15765.18
Other Current Assets TOTAL CURRENT ASSETS TOTAL ASSETS
Industry- Current Scenario The Indian auto-components industry has been exhibiting high growth over the years and accounts for almost 7.50% of our Gross Domestic Product. The industry employs about 20-22 Mn people. The Indian auto-component industry is mainly divided into un-organized & organized sector. The organized sector constitutes the Original Equipment Manufacturers (OEMs) where as the unorganized sector constitutes low-valued products. The automotive components industry has been growing both in exports and domestically driven by strong growth in the domestic market and increasing globalization around the world. The industry is expected to grow by 10 per cent in 2017-18 on account of high domestic demand by Original Equipment Manufacturers (OEM) and rising exports. The Indian automobile market is the fourth largest in the world and accounts for more than 4-5% of the global vehicle sales. India is also becoming a global hub for auto component sourcing due to low cost manufacturing base compared to other western counterparts. In addition to that India is strategically placed geographically as it is closer to key automotive markets i.e Middle East and Europe.
SUHANI ADILABADKAR
[email protected] 9701063320
Disclaimer The information and opinions contained in the research reports have been compiled or arrived at from sources believed reliable but no representation or warranty, express or implied, is made as to their accuracy or completeness. The research report does not constitute a personal recommendation or take into account the particular investment objectives, financial situations, or needs of individual clients. Clients should consider whether any advice or recommendation in this research is suitable for their particular circumstances and, if appropriate, seek professional advice, including but not limited to tax advice. The reports do not take into account the particular investment objectives, financial situations, risk profile or needs of individual clients. The user assumes the entire risk of any use made of this information. This report is not to be relied upon in substitution for the exercise of independent judgment. The price and value of investments referred to in this research and the income from them may fluctuate. Past performance is not a guide to future performance, future returns are not guaranteed, and a loss of original capital may occur. Research data and reports published/ emailed/ text messaged via Short Messaging Services, Online Messengers, WhatsApp etc/transmitted through mobile application/s, including but not limited to FLIP™, Video Widget, telephony networks,
print or electronic media and or those made available/uploaded on social networking sites (e.g. Facebook, Twitter, LinkedIn etc) is for informational purposes only. The reports are provided for assistance and are not intended to be and must not alone be taken as the basis for an investment decision. The user assumes the entire risk of any use made of this information. Though disseminated to clients simultaneously, not all clients may receive the reports at the same time. We will not treat recipients as clients by virtue of their receiving this report. The reports include projections, forecasts and other predictive statements which represent our assumptions and expectations in the light of currently available information. These projections and forecasts are based on industry trends, circumstances and factors which involve risks, variables and uncertainties. The actual performance of the companies represented in the report may vary from those projected. The opinions expressed in the reports are subject to change but we have no obligation to tell our clients when our opinions or recommendations change. The reports are non-inclusive and do not consider all the information that the recipients may consider material to investments. We shall not be in any way responsible for any indirect, special or consequential damages that may arise to any person from any inadvertent error in the information contained in the reports nor do they take guarantee or assume liability for any omissions of the information contained therein. Information contained therein cannot be the basis for any claim, demand or cause of action. These data, reports and information do not constitute scientific publication and do not carry any evidentiary value whatsoever. The user should consult their own advisors to determine the merits and risks of investment and also read the Risk Disclosure Documents for Capital Markets and Derivative Segments as prescribed by Securities and Exchange Board of India before investing in the Indian Markets. The securities discussed in this report may not be suitable for all investors. Investors must make their own investment decision based on their own investment objectives, goals and financial position and based on their own analysis. Prospective investors and others are cautioned that any forward-looking statements, if any, are not predictions and may be subject to change without notice. This report may provide the addresses of, or contain hyperlinks to websites. Except to the extent to which the report refers to material we take no responsibility whatsoever for the contents therein. Such addresses or hyperlinks are provided solely for your convenience and information and the content of the linked site does not in any way form part of this report. Accessing such website or following such link through this report shall be at your own risk.
The author of this Research Report accepts no liability and will not in any way be responsible for the contents of this report or for any losses, costs, expenses, charges, including notional losses/lost opportunities incurred by a recipient as a result of acting or non-acting on any information/material contained in the report. This is not an offer to sell or a solicitation to buy any securities or an attempt to influence the opinion or behavior of investors or recipients or provide any investment/tax advice. The securities described herein may or may not be eligible for sale in all jurisdictions or to certain category of investors. Persons in whose possession this document may come are required to inform themselves of and to observe such restriction.