HOLD SUHANI ADILABADKAR RESEARCH REPORT
Q4 FY17
INFOSYS LTD Consolidated QUARTERLY OUTLOOK & RECOMMENDATION SECTOR
INFOSYS Ltd reported subdued fourth quarter results FY17. Revenue or Income from Operations stood at Rs. 171200 Mn in the current quarter against Rs. 165500 Mn corresponding quarter previous year, rising 3.44% YOY. Profit After Tax or Net Profit stood at Rs. 36030 Mn quarter ended 31st March 2017 against Rs. 35970 Mn corresponding March quarter 2016, almost constant. EBDITA was also stagnant at Rs. 54040 Mn in Q4 FY17 compared to Rs. 54110 Mn in Q4 FY16. Profit Before Tax also declined by 0.66% YOY and was reported at Rs. 49330 Mn vis-à-vis Rs. 49910 same period previous year. On yearly basis except revenue, every parameter is stagnant and sequentially, growth is negative including revenue. Both PAT & EBDITA reported de-growth of 3% QOQ whereas revenue declined by 0.90% QOQ. Operating cost for the company has jumped 5% YOY from Rs. 123300 Mn to Rs. 129080 same period previous year. Sequentially operating cost is almost constant. All business segments except Hi- Tech & Retail have exhibited positive yearly growth with Energy & Manufacturing rising at 10% YOY. Lower revenue growth has impacted both EBDITA & Net Profit margins which have declined 113 & 69 basis points YOY. EBDITA & Net Profit Margins were reported at 31.57% & 21.05% respectively in the current Q4 FY17. The company’s utilization stood at 82% which has improved by 200 basis points same period previous year. Liquid assets including cash & cash equivalents and investments stood at Rs.387730 Mn as on March 31, 2017 Infosys is struggling in a slow growth scenario riddled with uncertain regulatory challenges especially in the US which constitutes 62% of its revenues. Global uncertainty is expected to continue whether in the form of BREXIT, political uncertainty in Europe or H1- B visa issue in US. The company will continue to face pricing pressure, high wage bill and low discretionary IT spending world over. Indian IT sector needs to gear up & face the challenges of automation & artificial intelligence. Though the company has highly credible management, stable margins, zero debt and high operating cash flow, sustainable revenue growth is the need of the hour for Infosys. We recommend HOLD for the stock with target price of Rs. 1050 for medium & long term.
CMP
Rs. 923.70
TARGET
Rs.1050.00
IT CONSULTING & SOFTWARE
SCRIP 500209 CODE FACE Rs. 5.00 VALUE MARKET Rs. 2113425 Mn CAP 52 WEEK Rs.1278.00 /Rs 900.30 HIGH/LOW SHAREHOLDING PATTERN (%) PROMOTER 12.75 PUBLIC 86.76 OTHERS 0.49 TOTAL 100.00 In Mn
Q4 FY17
Q4 FY16
CHN%
REVENUE
171200
165500
3.44%
PAT EBDITA
36030 54040
35970 54110
0.17% -0.13%
EPS
15.75
15.72
0.17%
In Mn
FY17A
FY18E
FY19E
REVENUE
684850
732790
773093
PAT
143530
150707
158216
EBDITA
216840
226415
240753
EPS
62.73
65.87
69.15
PE
14.72
14.02
13.36
INFOSYS LTD V/S S&P BSE SENSEX
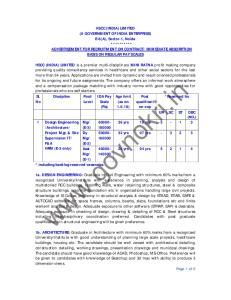
PERFORMANCE METRICS (MARCH Quarter FY17) Profitability Analysis NET PROFIT GROWTH (Rs. In Mn) 37500
REVENUE (Rs. In Mn)
37080
173100 172730
174000
37000
171200 172000
36500 36000
36060
35970
36030 170000
167820
35500
168000
35000 34500
165500 34360
166000
34000
164000
33500
162000
33000 Q4 FY16 Q1 FY17 Q2 FY17 Q3 FY17 Q4 FY17
Infosys reported subdued March quarter results reporting almost constant YOY numbers. Net profit jumped by just 0.17% YOY from Rs 35970 Mn to Rs. 36030 Mn in the current quarter. Sequential growth was lower by 3% visa-vis the previous December quarter. Revenue was on a stronger footing YOY with 3.44% rise at Rs. 171200 Mn though quarterly de-growth of 0.9% was exhibited. EBDITA was also stagnant on yearly basis declining 0.13% YOY at Rs. 54040 Mn compared to Rs. 54110 Mn same period previous year. Sequential decline was even higher at 3% in the current March quarter. The company witnessed unanticipated execution challenges and distractions in a seasonally soft quarter which affected its overall performance. Optimization was at 82% which is 2% higher than the corresponding March quarter previous year. During the quarter, rupee appreciation by 1.40% impacted the margins by 35 basis points. DSO for the quarter improved mildly from 69 days in the previous quarter to 68 days in the current March quarter.
160000
Q4 FY16
Q1 FY17
Q2 FY17
Q3 FY17
Q4 FY17
EBDITA (Rs In Mn)
57000 55870
56000 54930
55000 54110
54040
54000 53000 52000 52000 51000 50000 Q4 FY16 Q1 FY17 Q2 FY17 Q3 FY17 Q4 FY17
Other Income stood at 4.36% of total revenue at Rs. 7460 Mn compared to Rs 7720 Mn falling 3.36% YOY whereas sequential decline was even higher at 9% in Q4 FY17. EBDITA margin stood at 31.57% compared to 32.69% same period previous year declining 113 basis points YOY. One basis point is 1/100th of a percentage. Net Profit Margin on the other hand declined 69 basis points YOY in the current quarter. Operating cash flow for the quarter stood at Rs. 3250 Mn and free cash flow was reported at Rs. 29620 Mn in the current March quarter. The attrition rate is around 13.50% in the current March quarter. Infosys has given revenue guidance of 2.5%-4.5% growth in INR terms based on the exchange rates as of March 31, 2017.
NET PROFIT MARGIN 22.00% 21.80%
21.73%
21.60%
21.47%
21.40% 21.20%
21.05%
20.83%
21.00% 20.80%
20.47%
20.60% 20.40% 20.20% 20.00% 19.80% Q 4 FY16
Q1 FY17
Q2 FY17
Q3 FY17
Q4 FY17
Segment Revenue Analysis Business Segment (Rs. In Mn)
Q4 FY17
Q4 FY16
CHG%
Financial Services
46550
45220
2.94%
Manufacturing
19180
17480
9.73%
Energy& Utilities, Communication & Services
39630
36350
9.02%
Retail, Consumer packaged goods & Logistics
27100
27270
-0.62%
Life Sc, Healthcare and Insurance
21480
20830
3.12%
Hi Tech
1211
13270
-90.87%
All Other Segments
5150
5080
1.38%
BUSINESS MIX All Other Hi Tech Segments 3% 1% Life Sc, Healthcare and Insurance 13%
Financial Services 29%
Retail, Consumer packaged goods & Logistics 17% Energy& Utilities, Commu& Services 22%
Manufact 11%
All revenue segments rose except Hitech, highest was manufacturing at 10% YOY. The segment comprises 11% of the total revenue and stood at Rs. 19180 Mn in the current Marchquarter compared to Rs. 17480 Mn in the corresponding quarter previous year. Engineering services have grown strongly in the current quarter and are mainly responsible for the double digit growth for manufacturing. Financial Services or BFSI which contribute biggest chunk to revenues jumped 2.94% YOY and was almost constant QOQ. Fourth quarter is seasonally weakest quarter for BFSI. Retail segment exhibited stagnant yearly growth at Rs. 27100 Mn in the current quarter. Skava which is one of the most successful acquisitions for Infosys has led to company’s biggest wins in retail & CPG. Energy & Utilities constituting 22% of total revenues grew 9% YOY and 2% sequentially. Life Sciences &
Health care also reported yearly growth of about 3% whereas quarterly growth was negative at 2%. Hi Tech which comprises just 1% of revenues declined heavily both yearly and quarterly in the current March quarter FY17. Indian IT industry is facing headwinds not only with respect to slower growth but also uncertain government regulations in USA. Executive order signed by President Trump on visa regulations will increase the costs for Indian IT companies but with lag of about one year as H1-B visa formalities have already been completed for FY18. North America is the major contributor to the company’s revenues followed by Europe which has grown 9% YOY on constant currency. The company has done exceedingly well in Europe with RBS impact absorbed in the previous quarter. The company is optimistic for the region with respect to BFSI segment as European banks are underinvested in technology which presents an opportunity for the company in the coming quarters. Domestic exposure is the least at 3.20% and rest of the world at 12.40%. GST government project is being undertaken by Infosys. Revenue segregated on the basis of industry is dominated by BFSI or Banking and Financial Services contributing 33.50% of the total revenue followed by Manufacturing at 22.40%, Retail at 22.70% and Energy Utilities & Communication at 21.40% in the current March quarter.
REVENUE BY INDUSTRY Energy, Utilities, Comm, 21.40%
REVENUE BY GEOGRAPHIC SEGMENT
ROW, 12.40%
BFSI, 33.50%
India , 3.20% Europe, 22.10%
Retail & Life Sc, 22.70%
North America 62.30%
Manufac 22.40%
Expenditure Analysis EXPENDITURE (Rs. In Mn)
EMPLOYEE BENEFIT EXPENSES (Rs. In Mn)
Q4 FY17
Q4 FY16
CHG%
Employee Benefit Expenses
93090
90240
3.16%
98000
Cost of Technical subcontractors
10000
9250
8.11%
96000
Travel Expenses
4740
5950
-20.34%
Cost of software packages & others
4780
3300
44.85%
Communication Expenses
1490
1170
27.35%
Consultancy and professional charges
2290
2130
7.51%
Depreciation & Amortization
4460
4190
6.44%
Other Expenses
8230
96480 94200
94000 92820
92000
93090 90000
90240
88000
86000
7070
16.41%
Q4 FY16 Q1 FY17 Q2 FY17 Q3 FY17 Q4 FY17
Employee Benefit Expenses constitute the biggest chunk of expenditure which is about 72%. In the current quarter, Employee Benefit expenses stood at Rs 93090 Mn compared to Rs. 90240 Mn in the same period previous year, rising by 3% YOY. Employee Benefit Expenses have been moving southwards from previous December quarter and with a decline of 1.18% QOQ in the current March quarter. Cost of the technical subcontractor forms the next biggest chunk of 8% at Rs 10000 Mn in current March quarter also
rising about 3% QOQ. Cost of software packages spiked jumped 45% YOY from Rs 3300 Mn to Rs.4780 Mn in Q4 FY17 along with quarterly rise of 4%. Travel expenses constitute 4% of the total expenditure at Rs. 4740 Mn whereas other expenses were reported at Rs. 8230 Mn compared to Rs. 7070 same period previous year. Depreciation & Amortization at Rs. 4460 Mn constitute 3% of total expenditure in Q4 FY17.
Business Highlights – Q4 FY17
GEOGRAPHICAL SEGMENT
NORTH AMERICA EUROPE INDIA REST OF THE WORLD
INDUSTRY SEGMENT
SEQUENTIAL GROWTH
CONSTANT CURRENCY
1.30%
1.20%
-
(1.60%)
(5.40%)
(6.90%)
0.80%
(1.30%)
SEQUENTIAL GROWTH
CONSTANT CURRENCY
FSI
1.30%
0.50%
MFG & HI-TECH
0.40%
-
RCL
(2.70%)
(3.10%)
ECS
3.90%
2.80%
Number of Clients
31-Mar-17
31-Dec-16
31-Mar-16
1162
1152
1092
71
77
89
1 Million Dollar +
598
594
558
5 Million Dollar +
282
275
268
10 Million Dollar +
189
195
177
25 Million Dollar +
91
90
88
50 Million Dollar +
56
54
52
75 Million Dollar +
31
32
31
100 Million Dollar +
19
18
14
200 Million Dollar +
6
6
6
300 Million Dollar +
1
1
1
Top Client
3.30%
3.10%
3.60%
Top 5 clients
12.20%
12.30%
13.70%
Top 10 clients
20.20%
20.10%
21.80%
Repeat Business
96.20%
96.70%
95.80%
Active Added During the Period (gross) Number of Million Dollar clients
Client Contribution to Revenues
Q4 witnessed high growth momentum in MANA, skava, Panaya and Edge. MANA had one of the best quarters with 27 engagements including Adient. MANA has been doubling every quarter in the last four quarters and has more than 50 clients and more than 150 engagements.
The EdgeVerve business delivered solid results with 30 wins and 26 go-lives from both the Finacle and Edge suite of solutions across various markets.
Infosys Public Services Inc announced its partnership with the Texas Department of Family & Protective Services (DFPS) to modernize the agency’s IMPACT (Information Management Protecting Adults and Children of Texas) system. IMPACT is the primary case management and administrative system used by DFPS to deliver child welfare related services. It is the core system used by over 10,500 employees working across 250 different locations to service over 12 million children, the elderly, and the differently-abled.
The Housing Bank, one of the most respected banks in the Middle East, selected the Finacle suite of solutions to power the bank’s operations in Algeria.
Corporate Profile In 1981, seven engineers started Infosys Limited with just US $250. From the beginning, the company was founded on the principle of building and implementing great ideas that drive progress for clients and enhance lives through enterprise solutions. For over three decades, the company focused on bringing to life great ideas and enterprise solutions that drive progress for its clients. Infosys has a growing global presence with more than 197,000+ employees. Globally, it has 85 sales and marketing offices and 114 development centers as on March 31, 2016. Infosys is a global leader in technology services and consulting. The company enables clients in more than 50 countries to create and execute strategies for their digital transformation. From engineering to application development, knowledge management and business process management, it helps its clients to find the right problems to solve, and to solve them effectively. The company has with a team of 190,000+ innovators across the globe is differentiated by the imagination, knowledge and experience, across industries and technologies, it brings to every project it undertakes.
Financial Analysis QUARTERLY PROFIT & LOSS STATEMENT OF INFOSYS FROM 30th Sep 2016 TO 30th June 2017E VALUE
30-Sep-16
31-Dec-16
31-March-17
30- June-17
Rs. In Mn
3 Months
3 Months
3 Months
3 Months
173100
172730
171200
175480
OTHER INCOME
7600
8200
7460
7609
TOTAL INCOME
180700
180930
178660
183089
EXPENDITURE
-125770
-125060
-124620
-127112
EBDITA
54930
55870
54040
55977
DEPRERCIATION
-4240
-4330
-4460
-4594
-30
-
-250
-
PROFIT BEFORE TAX
50660
51540
49330
51383
TAX
-14600
-14460
-13300
-13566
PROFIT AFTER TAX
36060
37080
36030
37817
EQUITY CAPITAL
11440
11440
11440
11440
5
5
5
5
15.76
16.21
15.75
16.53
INCOME FROM OPERATIONS
SHARE IN PROFIT/LOSS OF ASSOCIATE
FACE VALUE EPS
ANNUAL PROFIT & LOSS STATEMENT OF INFOSYS FROM 31st MARCH 2017 TO 31st MARCH 2019E VALUE
31- Mar-17
31- Mar-18E
31-Mar-19E
Rs. In Million
12 months
12 months
12 months
INCOME FROM OPEARTIONS
684850
732790
773093
OTHER INCOME
30790
32330
33299
TOTAL INCOME
715640
765119
806392
TOTAL EXPENDITURE
-498800
-538704
-565639
EBDITA
216840
226415
240753
DEPRECIATION
-17030
-18733
-20232
-300
0
0
PROFIT BEFORE TAX
199510
209486
220521
TAX
-55980
-59339
-62306
PROFIT AFTER TAX
143530
150707
158216
EQUITY CAPITAL
11440
11440
11440
RESERVES
678380
829087
911995
5
5
5
62.73
65.87
69.15
SHARE IN P/L OF ASSOCIATES
FACE VALUE EPS
Ratio Analysis Year
FY 16A
FY 17A
FY 18E
FY19E
58.96
62.73
65.87
69.15
NPM
21.60%
20.96%
20.57%
20.47%
EBDITA MARGIN
32.35%
31.66%
30.90%
31.14%
ROE
21.85%
20.81%
17.93%
17.13%
BOOK VALUE
269.86
301.49
367.36
403.60
P/BV
3.42
3.06
2.51
2.29
PE
15.67
14.72
14.02
13.36
EPS
Comparative Analysis (Consolidated)
EPS Rs
PAT Rs. In Mn
PBT Rs. In Mn
REVENUE Rs. In Mn
MKT CAP Rs. In Mn
INFOSYS
15.75
36030
49330
171200
2113425
TCS
33.61
66220
86160
296420
4553988
Q4 FY17
Industry- Current Scenario India is one of the most important players in Global IT industry which is about $ 130 bn. Our Information Technology industry has transformed India into one of the biggest sourcing markets in the world. Infosys, Tata Consultancy Services, Wipro & HCL Tech are the big four of the Indian IT industry. Mid-Tier IT comprises of companies such as Persistent systems, Mindtree, Tech Mahindra to name a few. Indian IT industry employs about 10-12 million and continues to forge ahead with its cost competitiveness due to inherent advantages such as skilled labor & strong educational system etc. The IT software & hardware sector attracted FDI inflows of about $22 billion over the last 16 years. The industry is facing headwinds as global IT spend has reduced over the last few quarters and BREXIT has made matters worse as economic restructuring has started in Europe. As the Indian IT sector depends on international markets like USA, Europe, UK etc, any global mood swing impacts earnings growth of the Indian IT companies which is an inherent risk in this export oriented industry.
SUHANI ADILABADKAR
[email protected] 9701063320
Disclaimer The information and opinions contained in the research reports have been compiled or arrived at from sources believed reliable but no representation or warranty, express or implied, is made as to their accuracy or completeness. The research report does not constitute a personal recommendation or take into account the particular investment objectives, financial situations, or needs of individual clients. Clients should consider whether any advice or recommendation in this research is suitable for their particular circumstances and, if appropriate, seek professional advice, including but not limited to tax advice. The reports do not take into account the particular investment objectives, financial situations, risk profile or needs of individual clients. The user assumes the entire risk of any use made of this information. This report is not to be relied upon in substitution for the exercise of independent judgment. The price and value of investments referred to in this research and the income from them may fluctuate. Past performance is not a guide to future performance, future returns are not guaranteed, and a loss of original capital may occur. Research data and reports published/ emailed/ text messaged via Short Messaging Services, Online Messengers, WhatsApp etc/transmitted through mobile application/s, including but not limited to FLIP™, Video Widget, telephony networks, print or electronic media and or those made available/uploaded on social networking sites (e.g. Facebook, Twitter, LinkedIn etc) is for informational purposes only. The reports are provided for assistance and are not intended to be and must not alone be taken as the basis for an investment decision. The user assumes the entire risk of any use made of this information. Though disseminated to clients simultaneously, not all clients may receive the reports at the same time. We will not treat recipients as clients by virtue of their receiving this report. The reports include projections, forecasts and other predictive statements which represent our assumptions and expectations in the light of currently available information. These projections and forecasts are based on industry trends, circumstances and factors which involve risks, variables and uncertainties. The actual performance of the companies represented in the report may vary from those projected. The opinions expressed in the reports are subject to change but we have no obligation to tell our clients when our opinions or recommendations change. The reports are non-inclusive and do not consider all the information that the recipients may consider material to investments.
We shall not be in any way responsible for any indirect, special or consequential damages that may arise to any person from any inadvertent error in the information contained in the reports nor do they take guarantee or assume liability for any omissions of the information contained therein. Information contained therein cannot be the basis for any claim, demand or cause of action. These data, reports and information do not constitute scientific publication and do not carry any evidentiary value whatsoever. The user should consult their own advisors to determine the merits and risks of investment and also read the Risk Disclosure Documents for Capital Markets and Derivative Segments as prescribed by Securities and Exchange Board of India before investing in the Indian Markets. The securities discussed in this report may not be suitable for all investors. Investors must make their own investment decision based on their own investment objectives, goals and financial position and based on their own analysis. Prospective investors and others are cautioned that any forward-looking statements, if any, are not predictions and may be subject to change without notice. This report may provide the addresses of, or contain hyperlinks to websites. Except to the extent to which the report refers to material we take no responsibility whatsoever for the contents therein. Such addresses or hyperlinks are provided solely for your convenience and information and the content of the linked site does not in any way form part of this report. Accessing such website or following such link through this report shall be at your own risk. The author of this Research Report accepts no liability and will not in any way be responsible for the contents of this report or for any losses, costs, expenses, charges, including notional losses/lost opportunities incurred by a recipient as a result of acting or non-acting on any information/material contained in the report. This is not an offer to sell or a solicitation to buy any securities or an attempt to influence the opinion or behavior of investors or recipients or provide any investment/tax advice. The securities described herein may or may not be eligible for sale in all jurisdictions or to certain category of investors. Persons in whose possession this document may come are required to inform themselves of and to observe such restriction.