BUY SUHANI ADILABADKAR RESEARCH REPORT Q4 FY17
UFLEX LTD CONSOLIDATED
QUARTERLY OUTLOOK & RECOMMENDATION
Uflex Ltd reported stable quarterly numbers in March quarter FY17. Revenue or Income From Operations rose 11% YOY and stood at Rs. 17098 Mn compared to Rs. 15403 Mn in the corresponding March quarter FY16. EBDITA also reported similar growth rate YOY and rose 11% in the current quarter at Rs. 2229 Mn compared to Rs. 2000 Mn same period previous year. Profit After Tax jumped 26% YOY at Rs. 982 Mn against Rs. 782 Mn same period previous year. The quarterly numbers are also strong with revenue & EBDITA growing 8% & 5% respectively QOQ. Total expenditure jumped 10% YOY from Rs. 14724 Mn to Rs. 16174 Mn in the current March quarter. Higher growth revenue and controlled operating cost resulted in EBDITA margins expanding though mildly by 5 basis points. Net Profit Margin on the other hand moved handsomely by 67 basis points YOY and 108 basis points sequentially. Net Profit Margin was reported at 5.74% compared to 5.07% corresponding quarter previous year. EBDITA Margin on the other hand stood at 13.03% against 12.98% same period previous year. One basis point is equal to 0.01%. Other Income declined 57% YOY and was reported at Rs. 41 Mn compared to Rs. 95 Mn corresponding quarter previous year in Q4 FY16. In quarterly terms, Other Income grew 67% in the current Q4 FY17. Profit before Tax stood at Rs. 892 Mn in Q4 FY17 against Rs. 907 same period previous year. Uflex Ltd is engaged in providing end-to-end flexible packaging solutions to customers viz. packaging design & colour scheme, packaging structure, packaging products such as value added anti-counterfeiting solutions to prevent look alikes & filling machines. Clientele of the company includes Perfetti, Nestle, P&G, Britannia, Fritolay, Tata, Cadbury to name a few. The company has strong global sales and distribution network with customers in about 140 countries. The company’s aseptic packaging material manufacturing plant at Sanand, Gujarat will be commissioned and will commence operations in the coming quarters. We recommend BUY for the stock for medium & long term investment with PE multiple of 6.85 x FY18E & 6.06 x FY19E with a target price of Rs. 475.
INDUSTRY
CMP
Rs. 382.35
TARGET
Rs. 475.00
CONTAINERS & PACKAGING
SCRIP CODE
500148
FACE VALUE
10.00
MARKET CAP
Rs. 27609 Mn
52 WEEK Rs. 404.60 /Rs.225.00 HIGH/LOW SHAREHOLDING PATTERN (%) PROMOTER 44.02 PUBLIC 55.98 OTHERS TOTAL 100.00 In Mn Q4 FY17 Q4 FY16 CHN% REVENUE
17097.70
15403.30
11%
PAT
981.90
781.60
26%
EBDITA
2228.50
1999.50
11%
13.60
10.82
26%
FY17A
FY18E
FY19E
REVENUE
63318.30
66484.22
69143.58
PAT
3484.60
4028.73
4557.60
EBDITA
8948.10
9883.36
10719.40
EPS
48.26
55.79
63.12
PE
7.92
6.85
6.06
EPS In Mn
UFLEX LTD V/S S&P BSE SENSEX
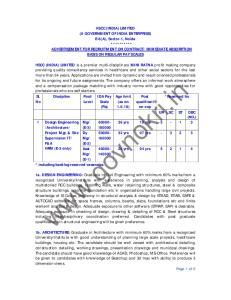
PERFORMANCE METRICS (March Quarter FY17) Profitability Analysis NET PROFIT GROWTH (Rs. In Mn) 1200
Q4 FY17
2229
982
1000 862 800
EBDITA (Rs. In Mn)
782
904 Q3 FY17
2123
738 Q2 FY17
600 400
2326
Q1 FY17
2271
200 Q4 FY16
2000
0 Q4 FY16 Q1 FY17 Q2 FY17 Q3 FY17 Q4 FY17
1800
Uflex Ltd reported strong yearly March numbers FY17. Revenue rose by 11% YOY from Rs. 15403 Mn to Rs. 17098 Mn in the current March quarter and 8% sequentially. Net Profit or Profit After Tax in the current Q4 FY17 also witnessed positive growth of 26% from Rs.782 Mn to Rs. 982 Mn in the current quarter. Earnings Before Depreciation, Interest, Tax & Amortization (EBDITA) also grew 11% at Rs. 2229 Mn against Rs. 2000 Mn same period previous year. Operating cost also followed the same growth rate YOY and was reported at Rs. 15755 Mn compared to Rs. 14215 Mn corresponding quarter previous year. Sequential growth for operating expenditure was lower at 9% in Q4 FY17. As a result EBDITA Margin improved mildly YOY by 5 BP in the current March quarter. Net Profit Margin on the other hand jumped 67 & 108 basis points YOY & quarterly respectively in Q4 FY17. Profit before Tax stood at Rs. 892 Mn in Q4 FY17 against Rs. 907 Mn same period previous year declining 2% YOY. Higher other Income also buffeted bottom-line as sequential growth was 67% in the current quarter whereas on yearly basis decline was 57%. Other income stood at Rs. 41 Mn in Q4 FY17 compared to Rs. 95 Mn same period previous year.
2000
2200
2400
REVENUE GROWTH (Rs. In Mn)
17500
17098
17000 16500 16000
15808 15403
15500
15347 15066
15000 14500 14000 Q4 FY16
Q1 FY17
Q2 FY17
Q3 FY17
Q4 FY17
OTHER INCOME (Rs. In Mn)
NET PROFIT MARGIN 7.00% 5.89%
Q4 FY17
41
Q3 FY17
6.00% 5.00%
25
5.74%
5.72%
5.07%
4.67%
4.00% Q2 FY17
55
Q1 FY17
3.00% 84
Q4 FY16
2.00%
1.00%
95
0.00% 0
50
100
150
Q4 FY16
Q1 FY17
Q2 FY17
Q3 FY17
Q4 FY17
Expenditure Analysis
Rs. In Mn Cost Of Materials Purchases of Stock In Trade Employee Benefit Expenses
Q4 FY17
Q4 FY16
CHG%
8833.90
7690.60
15%
225.50
1381.20
231.80
1218.50
-3%
13%
Depreciation & Amortization
845.00
716.60
18%
Power & Fuel
738.40
710.40
4%
Other expenses
3301.60
3305.80
0%
COST OF MATERIAL (Rs. In Mn) 9000 8800 8600 8400 8200 8000 7800 7600 7400 7200 7000
8830
8664
8834
8413
7691
Q4 FY16
Q1 FY17
Q2 FY17
Q3 FY17
Q4 FY17
Cost of Material accounts for the largest chunk i.e 58% & stock in trade the least. Cost of Material rose 15% YOY and stood at Rs. 8834 Mn whereas quarterly rise was 2%. Employee Benefit Expenses grew 13% YOY at Rs. 1381 Mn against Rs. 1218 Mn same period previous year. Employee Benefit Expenses constituted 9% of total expenditure with quarterly rise of 9%. Power & Fuel at 5% of total expenditure grew 4% YOY and was almost constant quarterly. Other Expenses stood at Rs. 3302 Mn compared to Rs. 3305 Mn same period previous year. Other Expenses were almost stagnant both YOY and sequentially.
DEPRECIATION (Rs. In Mn)
INTEREST EXPENSE (Rs. In Mn) 600 845
860 840
500
450
820 800 768
780
778
784
720
474
492
400
760 740
453
300
376
717 200
700 680
100
660 640
Q4 FY16
Q1 FY17
Q2 FY17
Q3 FY17
Q4 FY17
EBDITA MARGIN 15.50% 15.00%
15.15% 15.07%
14.50% 14.00% 13.43%
13.50% 13.00% 12.98% 12.50%
13.03%
12.00% 11.50% Q4 FY16 Q1 FY17 Q2 FY17 Q3 FY17 Q4 FY17
0 Q4 FY16 Q1 FY17 Q2 FY17 Q3 FY17 Q4 FY17
EBDITA margin for the current quarter stood at 13.03% compared to 12.98% same period previous year. QOQ, EBDITA margin declined 40 basis points as margin was reported at 13.43% in Q3 FY17 whereas on yearly terms margin expanded by just 5 basis points as Revenue & operating expenditure grew parallely in the current March quarter at 11% YOY. Sequentially EBDITA decline was caused by operating expenditure jumping 9% whereas revenue grew at a slower rate of 8% QOQ. Depreciation constituting 5% of the total expenditure jumped 18% YOY. On quarterly terms, rise was 8% from Rs. 784 Mn to Rs. 845 Mn in the current March quarter after being almost constant in Q3 FY17. Interest costs accounts 50% of profit which is a concern area for the company rising 9% YOY and 4% quarterly. Total expenditure including interest cost and taxation constituted 94% of the total revenue in the current March quarter against 96% same period previous year.
Segment Revenue Rs. In Mn
Q4 FY17
Q4 FY16
CHG%
Flexible Plastic Materials
16085.30
14400.80
12%
Engineering
1140.00
1085.60
5%
38.80
47.00
-17%
Others
Revenue Mix
Engineering Others 7% 0.002%
Flexible Plastic Materials 93%
Uflex Ltd provides end-to-end flexible packaging solutions to customers and is one of the largest flexible packaging company in India and also an emerging player in the global market. Thus Flexible Plastic Material segment constituted 93% of its total revenues in the current March quarter. The company has manufacturing facilities of packaging films in India, Dubai, Mexico, Egypt, Poland and USA and of packaging products at multiple locations in India accredited by ISO/BRC/HACCP. Flexible Plastics Materials segment reported rise of 12% YOY at Rs. 16085 Mn compared to Rs. 14401 Mn same period previous year. Uflex has also grown to be a manufacturing major of top of the line packaging, printing and allied machines. The company provides high performance machines and customized solutions exceeding global standards. The engineering segment exhibited growth of 5% YOY and was reported at Rs. 1140 Mn compared to Rs. 1086 Mn corresponding quarter previous year. Other segment declined 17% YOY and was reported at Rs. 39 Mn against Rs. 47 Mn in Q4 FY16.
Corporate Profile Uflex has earned an irreproachable reputation defining the contours of the ‘Packaging Industry’ in India and overseas. Since its inception in 1983, it has turned into a multi- billion company focusing on trust, value creation for customers, quality innovation and customer satisfaction. Uflex has grown from strength to strength with large manufacturing capacities of Packaging Films and packaging products providing endto-end solutions to clients across over 140 countries where it enjoys a formidable market presence thereby becoming India’s largest flexible packaging company. Headquartered in Noida, it has state-of the-art manufacturing facilities in India, UAE, Mexico, Poland, Egypt and USA. Uflex serves as one stop shop flexible packaging solution provider cutting across varied sectors spanning USA, Canada, South America, UK, Europe, Russia, CIS countries, South Africa and other African countries, Middle East and the South Asian Countries. Some of Uflex’s clients on the global turf include P&G, PepsiCo; Tata Global; Mondelez, L’ Oreal, Britannia, Haldiram, Amul, Kimberly Clark, Ferro Rocher, Perfetti, GSK, Nestle, Agrotech Foods, Coca Cola, Wrigley, Johnson & Johnson among others.
Financial Analysis QUARTERLY PROFIT & LOSS STATEMENT OF UFLEX LTD FROM 30th Sep 2016 TO 30th June 2017E
VALUE Rs. In Million
30-Sep-16 3 months
31-Dec-16 3 months
31- Mar-17 3 months
30-June-17E 3 months
INCOME FROM OPERATIONS
15346.60
15808.10
17097.70
18038.07
OTHER INCOME TOTAL INCOME EXPENDITURE EBDITA DEPRECIATION PROFIT BEFORE INTEREST & TAX INTEREST PROFIT BEFORE TAX TAX PROFIT AFTER TAX MINORITY INTEREST SHARE OF PROFIT/LOSS OF ASSOCIATES NET PROFIT EQUITY CAPITAL FACE VALUE EPS
55.10 15401.70 -13076.00 2325.70 -777.90 1547.80 -452.50 1095.30 -193.40 901.90 -4.00 5.60 903.50 722.10 10.00 12.51
24.70 15832.80 -13710.00 2122.80 -784.40 1338.40 -474.20 864.20 -118.60 745.60 -9.50 1.50 737.60 722.10 10.00 10.21
41.20 17138.90 -14910.40 2228.50 -845.00 1383.50 -491.80 891.70 73.60 965.30 -4.50 21.10 981.90 722.10 10.00 13.60
45.32 18083.39 -15506.82 2576.58 -870.35 1706.23 -531.14 1175.08 -132.83 1042.25 -4.73 21.73 1059.26 722.10 10.00 14.67
ANNUAL PROFIT & LOSS STATEMENT OF UFLEX LTD FROM 2016 TO 2019E VALUE Rs. In Million
31- Mar-16 12 months
31- Mar-17 12 months
31- Mar-18E 12 months
31-Mar-19E 12 months
INCOME FROM OPERATIONS
63655.20
63318.30
66484.22
69143.58
OTHER INCOME TOTAL INCOME EXPENDITURE EBDITA DEPRECIATION PROFIT BEFORE INTEREST & TAX INTEREST PROFIT BEFORE TAX TAX PROFIT AFTER TAX MINORITY INTEREST SHARE OF PROFIT/LOSS OF ASSOCIATES NET PROFIT EQUITY CAPITAL RESERVES FACE VALUE EPS
349.20 64004.40 -55609.70 8394.70 -2855.30 5539.40 -1758.20 3781.20 -648.50 3132.70 -31.00 36.70 3138.40 722.10 33756.20 10.00 43.46
205.00 63523.30 -54575.20 8948.10 -3175.40 5772.70 -1868.30 3904.40 -437.60 3466.80 -22.90 40.70 3484.60 722.10 35566.10 10.00 48.26
266.50 66750.72 -56867.36 9883.36 -3429.43 6453.92 -1961.72 4492.21 -481.36 4010.85 -24.05 41.92 4028.73 722.10 39834.03 10.00 55.79
319.80 69463.38 -58743.98 10719.40 -3600.90 7118.50 -2059.80 5058.70 -519.87 4538.83 -25.25 44.02 4557.60 722.10 43419.09 10.00 63.12
BALANCE SHEET OF UFLEX LTD FROM 2016-2019E CAPITAL & LIABILITIES (Rs. In Mn)
2016
2017
2018E
2019E
CAPITAL RESERVES & SURPLUS NETWORTH
722.10 33794.60 34516.70
722.10 35718.60 36440.70
722.10 39834.03 40556.13
722.10 43419.09 44141.19
NON CURRENT LIABILITIES Long Term Liabilities Other Financial Liability Long Term Provisions Deferred Tax Liabilities Other Non Current Liabilities TOTAL NON CURRENT LIABILITIES
10542.70 33.20 92.90 1493.20 27.70 12189.70
10297.70 33.30 116.70 1264.60 48.50 11760.80
10503.65 34.97 136.54 1391.06 72.75 12138.97
10713.73 36.71 150.19 1502.34 87.30 12490.28
Short term Borrowings
7142.60
7516.50
7967.49
8365.86
Trade Payables
7824.00
9573.00
11104.68
12215.15
Other Financial Liabilities
4122.10
3739.90
3552.91
3481.85
Other Current Liabilities
1798.00
1910.70
1987.13
2046.74
Short Term Provisions Current Tax Liabilities TOTAL CURRENT LIABILITIES TOTAL EQUITY & LIABILITIES
149.80 298.00 21334.50 68040.90
191.20 351.50 23282.80 71484.30
225.62 393.68 25005.88 77700.98
259.46 429.11 26798.17 83429.64
Property, Plant & Equipment
32413.60
33118.20
33780.56
34118.37
Capital Work In Progress
2244.60
4970.00
7455.00
9318.75
Investment Properties
355.10
340.70
347.51
350.99
CURRENT LIABILTIES
ASSETS (Rs. In Mn) NON CURRENT ASSETS
Goodwill
0.00
2.00
2.10
2.16
Intangible Assets
135.00
482.80
603.50
724.20
Intangible Assets Under Development
42.70
10.80
11.88
12.71
Investments
488.40
431.90
453.50
476.17
Pledged Equity Instrument
265.00
328.50
394.20
465.16
Long term Loans
1550.70
857.40
900.27
954.29
Other Non Current Financial Asset
397.10
191.90
195.74
197.70
Other Non Current Asset
978.00
723.60
759.78
774.98
TOTAL NON CURRENT ASSETS
38870.20
41457.80
44708.30
48119.67
Inventories
6208.30
6786.20
7261.23
7624.30
Trade Receivables
14801.90
16590.50
17981.75
18951.09
Cash & Cash Equivalents
3591.80
2309.30
2771.16
3048.28
Bank Balances
287.40
653.70
1176.66
1764.99
0.10
2.80
2.94
3.09
Other Financial Assets
1534.40
1375.30
1444.07
1516.27
Other Current Assets
2746.80
2308.70
2354.86
2401.97
TOTAL CURRENT ASSETS
29170.70
30026.50
32992.68
35309.98
TOTAL ASSETS
68040.90
71484.30
77700.98
83429.64
Loans
Ratio Analysis Year
FY 16A
FY 17A
FY 18E
FY19E
EPS
43.46
48.26
55.79
63.12
NPM
4.93%
5.50%
6.06%
6.59%
EBDITA MAGIN
13.19%
14.13%
14.87%
15.50%
ROE
9.09%
9.55%
9.89%
10.28%
DEBT EQUITY
0.51
0.49
0.46
0.43
EV/EBDITA
4.15
4.05
3.58
3.23
477.47
502.54
561.64
611.29
P/BV
0.80
0.76
0.68
0.63
PE
8.80
7.92
6.85
6.06
BOOK VALUE
Industry- Current Scenario Indian packaging industry constitutes about 5% of the total global packaging industry. Organized retail and e-commerce boom has provided huge potential for future growth of packaging industry as a whole. Flexible packaging has been one of the fastest growing sectors in the packaging industry over the past 1012 years. Flexible packaging provides for primary packaging with low contamination, lightweight, high barrier and keeps the product completely safe from the external environment. It is an economical method which increases the shelf life of products & consumables and preserves, packages & distributes food. The global market segmentation for flexible packaging industry can be done on the following bases, namely end user, packaging types, printing processes, material, and geography. On the basis of end user type, segmentation is mainly into consumer products, industrial, medical & pharmaceuticals, retail food, retail nonfood, institutional food, institutional non-food etc. On basis of packaging type, categorization is into stand-up pouches, flat pouches, converted roll-stock, gusseted bags, wicket bags, laminated flexitubes, aseptic cartons/ packs, big bags and others. For material type, categorization is into Polypropylene (PP), Polyethylene (PE), Polyethylene Terephthalate (PET), Poly Vinyl Chloride (PVC), Ethylene Vinyl Alcohol (EVOH), Polyamide (PA) and other material such as paper, aluminum etc. With respect to geography global market can be divided into North America, Europe, Asia Pacific, the Middle East and Africa, and Latin America. Though North America dominates the global flexible packaging market in revenues, Asia Pacific is expected to expand at a faster rate. Rising population and high demand for beverages, packaged foods, pharmaceuticals, and personal care products are the major drivers of the flexible packaging market in emerging countries such as India and China.
Comparative Analysis March 2017 Uflex Ltd Consolidated
Varun Beverages Ltd Consolidated
HSIL Ltd Standalone
EPS (Rs)
REVENUE (Rs. In Mn)
PAT (Rs. In Mn)
EBDITA (Rs. In Mn)
MKT CAP (Rs. In Mn)
13.60
17097.70
981.90
2228.50
27609.49
0.25
10644.19
68.94
941.57
93445.20
4.25
6377.00
307.50
649.00
27610.10
SUHANI ADILABADKAR
[email protected] 9701063320
Disclaimer The information and opinions contained in the research reports have been compiled or arrived at from sources believed reliable but no representation or warranty, express or implied, is made as to their accuracy or completeness. The research report does not constitute a personal recommendation or take into account the particular investment objectives, financial situations, or needs of individual clients. Clients should consider whether any advice or recommendation in this research is suitable for their particular circumstances and, if appropriate, seek professional advice, including but not limited to tax advice. The reports do not take into account the particular investment objectives, financial situations, risk profile or needs of individual clients. The user assumes the entire risk of any use made of this information. This report is not to be relied upon in substitution for the exercise of independent judgment. The price and value of investments referred to in this research and the income from them may fluctuate. Past performance is not a guide to future performance, future returns are not guaranteed, and a loss of original capital may occur. Research data and reports published/ emailed/ text messaged via Short Messaging Services, Online Messengers, WhatsApp etc/transmitted through mobile application/s, including but not limited to FLIP™, Video Widget, telephony networks, print or electronic media and or those made available/uploaded on social networking sites (e.g. Facebook, Twitter, LinkedIn etc) is for informational purposes only. The reports are provided for assistance and are not intended to be and must not alone be taken as the basis for an investment decision. The user assumes the entire risk of any use made of this information. Though disseminated to clients simultaneously, not all
clients may receive the reports at the same time. We will not treat recipients as clients by virtue of their receiving this report. The reports include projections, forecasts and other predictive statements which represent our assumptions and expectations in the light of currently available information. These projections and forecasts are based on industry trends, circumstances and factors which involve risks, variables and uncertainties. The actual performance of the companies represented in the report may vary from those projected. The opinions expressed in the reports are subject to change but we have no obligation to tell our clients when our opinions or recommendations change. The reports are non-inclusive and do not consider all the information that the recipients may consider material to investments. We shall not be in any way responsible for any indirect, special or consequential damages that may arise to any person from any inadvertent error in the information contained in the reports nor do they take guarantee or assume liability for any omissions of the information contained therein. Information contained therein cannot be the basis for any claim, demand or cause of action. These data, reports and information do not constitute scientific publication and do not carry any evidentiary value whatsoever. The user should consult their own advisors to determine the merits and risks of investment and also read the Risk Disclosure Documents for Capital Markets and Derivative Segments as prescribed by Securities and Exchange Board of India before investing in the Indian Markets. The securities discussed in this report may not be suitable for all investors. Investors must make their own investment decision based on their own investment objectives, goals and financial position and based on their own analysis. Prospective investors and others are cautioned that any forward-looking statements, if any, are not predictions and may be subject to change without notice. This report may provide the addresses of, or contain hyperlinks to websites. Except to the extent to which the report refers to material we take no responsibility whatsoever for the contents therein. Such addresses or hyperlinks are provided solely for your convenience and information and the content of the linked site does not in any way form part of this report. Accessing such website or following such link through this report shall be at your own risk. The author of this Research Report accepts no liability and will not in any way be responsible for the contents of this report or for any losses, costs, expenses, charges, including notional losses/lost opportunities incurred by a recipient as a result of acting or non-acting on any information/material contained in the report. This is not an offer
to sell or a solicitation to buy any securities or an attempt to influence the opinion or behavior of investors or recipients or provide any investment/tax advice. The securities described herein may or may not be eligible for sale in all jurisdictions or to certain category of investors. Persons in whose possession this document may come are required to inform themselves of and to observe such restriction.