Manhattan Community District 3
See MN 3's profile online
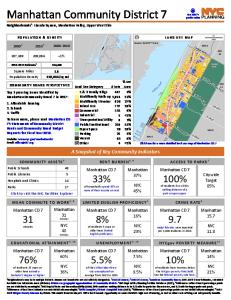
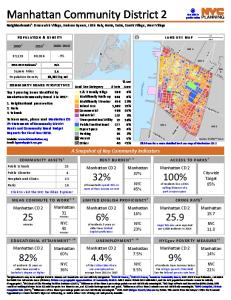
Neighborhoods1: Chinatown, East Village, Lower East Side, NoHo, Two Bridges
[
PO P U L ATI O N & D E N S I T Y 20002
20103
0.5
LA N D U S E M A P
2000-2010
Miles
MN 6 MN 2
-1%
Square Miles Population Density
1.7 96,045/sq mi
W
Ho us ton St
% Lot # Lots Area
1. Affordable housing 2. Senior services 3. Youth and children’s services To learn more, please read Manhattan CD 3's Statements of Community District Needs and Community Board Budget Requests for Fiscal Year 2018.
Ca na l
St
MN 1
Br
Website: www.cb3manhattan.org Email:
[email protected]
<1% 8% 25% 24% 4% 1% 4% 10% 16% 1% 6% <1%
St
iv e r
Top 3 pressing issues identified by Manhattan Community Board 3 in 2017:
t
n kly oo Br
Land Use Category 1 & 2 Family Bldgs 69 Multifamily Walk-up 957 Multifamily Elevator 269 Mixed Use 1,971 Commercial 284 Industrial 108 Transportation/Utility 28 Public/Institutional 282 Open Space 71 Parking 64 Vacant 148 Other 10
E Ho usto n
4S
Ea st R
COMMUNITY BOARD PERSPECTIVES
E1
R Dr
163,970
FD
2011-2015 Estimate4
wa y
163,277
Bro ad
164,407
Click here for a more detailed land use map of Manhattan CD 3
A Snapshot of Key Community Indicators CO M M U N I T Y A S S E T S 5
R E N T B U R D E N 4, 6
Public Schools
63
Public Libraries
5
Hospitals and Clinics Parks
33 61
Click to visit the NYC Facilities Explorer
M E A N C O M M U T E T O W O R K 4, 8
Manhattan CD 3
31 minutes
Manhattan 31 minutes
NYC 40 minutes
E D U C AT I O N A L AT TA I N M E N T 4 , 1 0
Manhattan CD 3
43% of residents 25 years or older have earned a bachelor's degree or higher 1
Manhattan 60% NYC 36%
Manhattan CD 3
39% of households spend 35% or more of their income on rent
Manhattan 37%
Manhattan CD 3
NYC 45%
of residents live within walking distance of a park or open space
LI M I T E D EN GL I S H P RO FI CI EN C Y 4
Manhattan CD 3
28.6%
of residents 5 years or older have limited English proficiency
Manhattan 15.8% NYC 23.1%
U N E M P L OY M E N T 4 , 1 0
Manhattan CD 3
7.8% of the civilian labor force was unemployed on average from 2011 to 2015
A C C E S S TO PA R KS 7
Manhattan 7.5% NYC 9.5%
Citywide Target 85%
100%
C R I M E R AT E 9
Manhattan CD 3
15.0
Manhattan 15.7 NYC 11.8
major felonies were reported per 1,000 residents in 2016
P O V E R T Y 4, 1 0
Manhattan CD 3
27% of residents had incomes below the poverty level
Manhattan 18% NYC 21%
Neighborhoods may be in multiple districts. Names and boundaries are not officially designated. 22000 US Census; 32010 US Census; 4American Community Survey 2011-2015 5-Year Estimates, calculated for Public Use Microdata Areas (PUMAs). PUMAs are geographic approximations of community districts. 5NYC Dept of City Planning Facilites Database (2017); 6 Differences of less than 3 percentage points are not statistically meaningful. 7NYC Dept of Parks and Recreation (DPR) (2016). DPR considers walking distance to be 1/4 mile for parks less than 6 acres, and 1/2 mile for larger parks and pools. 8 Differences of less than 2 minutes are not statistically meaningful. 9NYPD CompStat, Historic Complaint Data (2017); 10 Differences of less than 2 percentage points are not statistically meaningful.