Madras Agric. J., 98 (7-9): 219-223, September 2011
Effect of Long Term Manure and Fertilizer Addition on Sulphur Forms Under Rice Monoculture P. Saravana Pandian* Department of Soil and Environment Agricultural College and Research Institute, Madurai -625 104
The effect of continuous application of manures and fertilizers to rice monoculture on chemical pools of different forms of sulphur was investigated in sandy clay loam soil. Among the major forms of S, organic S was the dominant one. Long term application of anyone of the organic manures and P fertilizer have increased the organic, water soluble, sulphate significantly but decreased the adsorbed and non sulphate forms of soil. Key words : Manures, fertilizers, long-term sulphur forms
Sulphur is one of the important secondary nutrient elements and its essentiality for plant growth has been recognized since the middle of 19th century. Sulphur has been rated as fourth major nutrient element after N, P and K (Sarkar et al., 1994). Sulphur nutrition to crops has not been fully realized during the past mainly because S deficiency was not a serious problem but with the use of high analysis fertilizers containing little or no S along with intensive cropping has led to depletion of S in many soils. Sulphur in the arable land would be in the form of soluble sulphate in solution, in organic matter adsorbed in the soil complex. Although studies have been conducted on the effect of S on various crops under various agro-climatic conditions, the information on the long term effects of different manures-fertilizers schedules on different forms of S in soil under rice monoculture is lacking. Keeping these points in view, the present investigation was taken up to evaluate the effect of the rice monoculture on different forms of sulphur under permanent manurial experiment which is in operation since 1975 with different manure-fertilizer schedules. Materials and Methods The permanent manurial experiment is in operation since 1975 at the Agricultural College and Research Institute, Madurai, Tamil Nadu in sandy clay loam soil (Typic Haplustalf). The experiment was laid out in split plot design with two replications (Main plot : M1 - No manure, M2 - Farm yard manure (FYM) @ 12.5 t ha-1, M3 - Green leaf manure (GLM ) @ 12.5 t ha-1, M4 - Urban compost (UC) @ 12.5 t ha-1; Sub-plot - S1 - Control (No, N, P and K); S2 - N, S3 - P, S4 - K, S5 - N + P, S6 - N+ K, S7 - P + K, S8 - N + P + K. The organic manures viz., FYM, GLM and UC were applied and incorporated into the soil one week prior to planting. Nitrogen, P and K were applied @ 120 : 60 : 60 kg ha-1 respectively in the form of urea, single *Corresponding author email:
[email protected]
super phosphate and muriate of potash according to the treatments. Present study was taken up with the 45th and 46th rice crops raised in the experiments during 2005-06 and 2006-07 respectively. Pre-planting and post harvest soil samples of 45th and 46th crops were collected at 0-15 cm depth, processed and analysed for organic S (Evans and Roast,1946), water soluble S (Williams and Steinbergs, 1959). Adsorbed S (Fox et al.,1964), Sulphate S (Williams and Steinbergs, 1959) and nonsulphae S (Chao et al., 1964). Sulphur in the extract was determined turbidimetrically (Chesnin and Yien, 1951). Results and Discussion Organic S
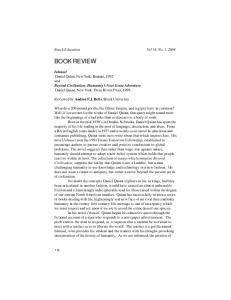
The organic S ranged between 36 mg kg-1 in unmanured control and 365 mg kg-1 in UC and it varied from 163 to 280 mg kg-1 among the fertilizer schedules (Table 1). Continuous addition of organic manures had considerably improved the organic S while depletion was observed in the treatments receiving no manure. Among the organic sources, the highest organic S was registered with UC followed by GLM and FYM treatments. This might be due to the higher content of S and higher organic carbon content of UC treated plots. The positive relationship between organic carbon and organic S has been reported by Singh and Sharma (1993). Application of P either alone or in combination with N and K registered higher organic S status. Accumulation of organic S due to the long term annual application of superphosphate in pasture was reported by Nguyen and Goh (1992). Treatments receiving either alone or incombination with P or K recorded higher organic S than K added treatments or control. Since application of N would have caused development of more root biomass which upon decomposition could have enriched the
220 Table 1. Effect of manure-fertilizer schedules on organic S status of the soil (mg kg-1)
M1
M2
M3
M4
Mean
M1
M2
M3
M4
Mean
M1
M2
M3
M4
Mean
Mean (Sub plot)
S1
23
138
196
244
150
20
142
226
276
166
16
147
238
286
172
163
S2
30
160
225
270
171
23
165
245
304
184
17
166
255
310
187
181
S3
44
220
280
386
232
44
245
313
423
256
41
256
330
445
268
252
S4
27
150
210
260
162
20
153
238
285
174
15
156
248
294
178
171
S5
48
250
310
420
257
45
264
340
453
276
45
275
353
475
287
273
S6
33
193
240
280
187
30
172
253
306
190
25
175
262
316
195
191
S7
55
218
285
418
244
57
236
323
446
267
51
250
340
459
275
262
S8
60
255
310
439
266
55
260
339
478
283
49
266
354
490
290
280
Mean
40
198
257
340
209
37
205
285
371
225
31
192
298
384
226
Treatment
Preplanting '05 (Stage I)
Mean
Postharvest '05 (Stage II)
M1 = 36
Postharvest' 06 (Stage III)
M2 = 198
M3 = 280
M4 = 365
(Main Plot) SEd
CD (p=0.05)
St
1.45
3.0
St x M
2.91
SEd
CD (p=0.05) 6.0
M
1.68
3.0
St x S
4.11
8.00
S
2.37
5.0
MxS
4.74
9.0
St x M x S
8.22
NS
M 4 (UC) treatments. Among the organics, UC occupied the higher place than GLM and FYM in influencing the water soluble S status. Watwood and Fitegerald (1988) reported that continuous addition of organic residues enhanced the water Water soluble S soluble S status to the tune of 5 per cent than in the A significant increase in water soluble S was unmanured control. In the case of fertilizer observed at the successive stages due to manure schedules, the water soluble S content varied from fertilizer application (Table 2). The values were 17.1, 10.3 to 24.5, 9.4 to 27.7 and 9.0 to 30.0 mg kg-1 in 18.1, and 19.2 mg kg -1 in preplanting '05, post preplanting '05, post harvest '05 and post harvest harvest '05 and post - harvest '06 stages respectively. '06 stages respectively. The water soluble S content Among the manurial treatments, it varied from 9.8 was found to be higher in the treatments receiving P mg kg-1 in M1 (Unmanured control) to 25.4 mg kg-1 in than without P fertilizer. Similar to the individual Table 2. Effect of manure-fertilizer schedules on water soluble S status of the soil (mg kg-1)
organic S pool. Overall an appreciable build up of organic S (17 mg kg -1 ) was recorded from preplanting '05 to post harvest '06 stage due to the addition of manure - fertilizer.
Treatment
Preplanting '05 (Stage I)
Postharvest '05 (Stage II)
Postharvest' 06 (Stage III)
Mean (Sub plot) 10.5
M1
M2
M3
M4
Mean
M1
M2
M3
M4
Mean
M1
M2
M3
M4
Mean
S1
4.8
12.4
10.0
16.4
10.9
4.0
10.8
10.0
19.0
10.5
4.0
10.0
11.2
21.4
10.0
S2
4.4
12.0
10.0
14.6
10.3
3.7
10.0
10.0
13.8
9.4
3.5
10.0
10.0
12.4
9.0
9.6
S3
11.8
24.8
21.8
34.2
23.2
12.8
27.5
27.4
39.4
26.8
14.0
28.6
30.0
41.4
28.5
26.2
S4
6.3
13.6
14.0
19.4
13.3
4.4
11.0
13.2
19.4
12.0
4.0
10.4
13.0
19.8
11.8
12.4
S5
12.0
22.8
21.8
27.4
21.0
10.4
24.5
24.4
31.2
22.6
12.2
27.0
27.8
32.2
24.8
22.8
S6
4.0
12.6
13.1
16.0
11.4
4.0
10.0
11.4
16.1
10.4
4.0
9.8
10.8
16.0
10.2
10.7
S7
17.1
22.8
26.4
31.8
24.5
19.0
24.2
31.0
36.5
27.7
21.2
26.4
33.4
39.0
30.0
27.4
S8
16.8
19.8
24.2
26.2
21.8
17.2
21.4
29.0
32.0
24.9
18.4
24.8
31.8
34.0
27.3
24.7
9.7
17.5
17.7
23.3
17.1
9.4
17.5
19.6
25.9
18.1
10.2
18.4
21.0
27.0
19.2
Mean Mean
(Main Plot)
M1 = 9.8
M2 = 17.8
M3 = 19.4
M4 = 25.4
SEd
CD (p=0.05)
St
0.18
0.4
St x M
0.36
0.7
M
0.20
0.4
St x S
0.50
1.0
S
0.29
0.6
MxS
0.59
1.2
St x M x S
1.02
2.0
effects, the interaction effect showed that the treatments receiving UC or GLM along with P application recorded higher water soluble S content. Sulphate S
Both organic sources and fertilizer schedules
SEd
CD (p=0.05)
significantly influenced the sulphate S and varied widely from 15.9 mg kg-1 in unmanured control (M1) to 41.8 mg kg-1 in UC (M4 treatment), whereas, among the fertilizer treatments, it ranged from 18.4 to 51.1 mg kg-1 (Table 3). The higher status of sulphate S was registered in the manured
221 treatments than in the unmanured control. Similarly the treatments those received P fertilizer recorded higher sulphate S than the treatments without P. Among the organics, the UC and GLM performed better as compared to FYM in registering the sulphate S in all the three stages. Due to narrow C:S ratio and higher S content, the UC would have undergone mineralization relatively at a faster rate and added sulphate S to the labile pool. According to Schoenau and Bettany (1987), the green manure
is enriched with ester sulphate a labile fraction of organic S which undergoes mineralization faster and releases the sulphate S to the labile pool. Considering the three stages, a rapid depletion of sulphate S was observed in N added treatments than in the control and K treatments. Due to the synergistic relationship between N and S, the uptake of S has been enhanced which would have led to the faster depletion of sulphate S. This has been
Table 3. Effect of manure-fertilizer schedules on SO42- status of the soil (mg kg-1) Treatment
Preplanting '05 (Stage I)
Postharvest '05 (Stage II)
Postharvest' 06 (Stage III)
Mean (Sub plot) 22.9
M1
M2
M3
M4
Mean
M1
M2
M3
M4
Mean
M1
M2
M3
M4
Mean
S1
8.2
24.5
28.2
35.6
24.1
6.4
22.0
25.0
37.0
22.6
5.0
19.0
26.4
37.8
22.1
S2
5.4
26.0
25.0
25.4
20.5
5.0
22.0
23.0
23.2
18.3
4.8
20.0
21.4
19.8
16.5
18.4
S3
24.6
46.4
52.0
44.4
41.9
25.2
50.2
58.5
51.4
46.3
28.0
52.4
61.8
56.4
49.7
46.0
S4
8.0
23.5
33.8
32.6
24.5
6.2
22.0
31.4
32.0
22.9
5.5
20.0
32.6
33.0
22.8
23.4
S5
22.0
52.4
42.0
45.0
40.4
23.0
58.2
49.8
48.5
44.9
27.4
61.4
54.5
53.8
49.3
44.9
S6
7.6
22.8
23.0
27.8
20.3
4.8
20.0
23.8
27.0
18.9
4.5
18.2
21.4
28.4
18.1
19.1
S7
25.0
51.8
57.8
51.4
46.5
27.0
54.0
64.6
59.4
51.2
31.4
58.0
69.0
63.8
55.6
51.1
S8
22.8
46.5
52.5
48.4
42.6
24.0
51.4
57.2
56.0
47.2
29.0
56.4
62.5
61.4
52.3
47.4
Mean
15.5
36.7
38.8
39.3
32.6
15.2
37.5
41.6
41.8
34.0
17.0
38.2
43.7
44.3
35.8
Mean (Main Plot)
M1 = 15.9
M2 = 37.5
M3 = 41.4
M4 = 41.8
SEd
CD (p=0.05)
St
0.16
0.3
St x M
0.32
SEd
CD (p=0.05) 0.6
M
0.18
0.4
St x S
0.45
0.9
S
0.26
0.5
MxS
0.52
1.0
St x M x S
0.90
1.8
mg kg-1) followed by GLM (47.3 mg kg-1) treatments. In unmanured control, a positive balance of 6 per cent of adsorbed S was recorded. The negative balance of S in manured treatments may be due to the prevailing competition between organic anions and sulphate ions for the same adsorption sites. Courchesne et al. (1995) demonstrated that the addition of organic manures decreased the
confirmed earlier by Bettany et al. (1985). Adsorbed S
On comparing the cropping stages, a depletion and build up of adsorbed form of S was recorded in the manured and unmanured treatments respectively (Table 4). The results further indicated that the highest adsorbed S was noted in FYM (51.2
Table 4. Effect of manure-fertilizer schedules on adsorbed S status of the soil (mg kg-1)
M1
M2
M3
M4
Mean
M1
M2
M3
M4
Mean
M1
M2
M3
M4
Mean
S1
23.8
47.5
39.6
46.4
39.3
21.6
43.0
35.0
38.0
34.4
21.6
32.2
29.4
30.6
29.9
Mean (Sub plot) 34.5
S2
18.6
45.0
45.8
47.6
39.3
18.0
38.0
43.0
35.8
33.7
15.0
27.5
41.1
29.2
28.5
33.8
S3
62.4
60.6
62.8
61.6
61.9
65.8
61.8
57.5
50.6
58.9
73.0
56.6
52.4
37.1
54.3
58.4
S4
28.0
38.5
32.8
46.4
36.4
27.8
38.0
22.6
36.0
31.1
22.3
38.0
18.0
30.0
27.2
31.6
S5
60.0
53.6
70.2
52.0
59.0
62.0
53.8
55.2
44.5
55.4
63.3
48.5
53.1
31.2
48.7
54.4
S6
29.4
21.2
41.0
25.2
29.2
28.2
25.0
34.2
23.0
27.6
20.1
15.8
31.4
19.4
21.9
26.2
S7
60.0
71.2
76.2
65.6
68.3
59.0
77.0
60.6
54.6
62.8
69.6
70.5
53.5
49.2
60.4
63.8
S8
72.2
81.5
78.5
54.6
71.7
75.0
78.6
68.8
45.0
66.9
87.6
71.6
58.5
36.2
63.7
67.4
Mean
44.3
55.9
52.4
49.9
50.6
44.7
51.9
47.1
40.9
46.2
47.0
45.8
42.3
32.7
42.0
Treatment
Preplanting '05 (Stage I)
Postharvest '05 (Stage II)
Postharvest' 06 (Stage III)
Mean (Main Plot)
M1 = 45.3
M2 = 51.2
M3 = 47.3
M4 = 41.2
SEd
CD (p=0.05)
St
0.24
0.5
St x M
0.49
SEd
CD (p=0.05) 1.0
M
0.28
0.6
St x S
0.69
1.4
S
0.39
0.8
MxS
0.80
1.6
St x M x S
1.38
2.7
222 Due to higher bonding strength of H2PO4- it would have been adsorbed preferentially and tenaciously on the colloidal constituents than the sulphate. This would have led to the depletion of adsorbed S at the successive stage. A negative correlation between the sulphate adsorption potential and Bray and Kurtz P1(r=-0.80) and P2(r = -0.72) were observed by Barrow (1970).
adsorbed S due to the chelation of Fe and Al by organic anions. The positive balance of adsorbed S (6%) in unmanured control might be due to the specific adsorption of sulphate ionsby the hydrous oxides of Fe and Al (Courchesne, 1992). The results further showed that a depletion of adsorbed S irrespective of the treatments in fertilizer schedules. Even in the treatments receiving P fertilizer a declining trend was noticed. This may be attributed to the prevailing competition between the H2PO4and SO42- ions for the same adsorption sites. As single super phosphate was used as P fertilizer in this experiment, the added H 2PO 4- would have competed with the SO42- ions for adsorption sites.
Non sulphate S
The results reflected that the non sulphate S status was significantly decreased (from 37.0 to 34.8 mg kg-1) at the successive stages (Table 5). Among the manured treatments, the non-sulphate S ranged
Table 5. Effect of manure-fertilizer schedules on non SO42- S status of the soil (mg kg-1) M1
M2
M3
M4
Mean
M1
M2
M3
M4
Mean
M1
M2
M3
M4
Mean
S1
37.0
29.6
26.2
23.8
29.2
37.0
23.0
24.0
21.0
26.3
32.4
19.4
21.2
20.0
23.3
Mean (Sub plot) 26.3
S2
56.0
23.8
24.2
27.0
32.8
54.2
19.1
19.2
23.4
28.9
51.2
18.4
17.5
21.0
27.0
29.6
S3
46.2
33.4
35.2
35.8
37.7
48.0
35.0
36.4
35.0
38.5
48.0
33.0
31.8
33.5
36.6
37.6
S4
37.4
36.0
33.4
21.0
32.0
36.0
35.0
32.2
21.0
31.0
35.2
31.0
29.4
21.0
29.2
30.7
S5
60.4
29.8
42.8
34.8
42.0
65.4
32.2
41.4
33.0
42.8
62.3
30.0
37.4
30.0
39.9
41.6
S6
55.0
46.5
36.0
32.5
42.5
52.5
44.2
35.6
30.0
40.4
48.4
41.0
33.2
28.2
37.7
40.2
S7
74.5
44.6
36.0
30.0
46.3
78.4
43.0
34.0
30.0
46.2
73.4
40.5
32.5
30.0
44.1
45.5
S8
80.5
29.0
34.5
28.0
43.0
84.0
28.2
33.8
27.5
43.4
75.4
27.0
33.0
26.4
40.4
42.3
Mean
51.3
34.1
33.5
29.1
37.0
56.8
28.4
31.9
27.6
36.2
53.3
30.0
29.5
26.3
34.8
Treatment
Preplanting '05 (Stage I)
Postharvest '05 (Stage II)
Postharvest' 06 (Stage III)
Mean (Main Plot)
M1 = 53.8
M2 = 30.8
M3 = 31.6
M4 = 27.7
SEd
CD (p=0.05)
St
0.18
0.4
St x M
0.35
0.7
M
0.20
0.4
St x S
0.50
1.0
S
0.29
0.6
MxS
0.57
1.1
St x M x S
0.99
2.0
from 27.7 to 53.8 mg kg-1 and the highest amount of 53.8 mg kg-1 was recorded in unmanured control (M1) and the lowest value was noted in the UC (M4) treatment (27.7 mg kg-1). This may be attributed to accumulation of higher organic matter in UC added treatment (1.51%). Johnson and Henderson (1979) observed a significant negative relationship between the organic carbon and non-sulphate S in the surface soils of hardwood forest. Generally, the non sulphate S content was significantly lower in the treatments receiving any one of the manures than in the unmanured control (M1). This may be due to the solubilization of occluded sulphate by the organic acids released during the decomposition of organic manures. Similar to the organics, the fertilizer schedules also significantly altered the nonsulphate S and it ranged from 29.2 5 to 46.3, 26.3 to 46.2 and 23.3 to 44.1 mg kg-1. The non-sulphate S followed the similar trend in the individual stages as that of the pooled averages. From this study, it is concluded that long term application of any one of the organic manures and P fertilizers containing S have increased significantly the organic, water soluble and sulphate S but
SEd
CD (p=0.05)
decreased the adsorbed and nonsulphate S status of the soil. Thus to increase the availability of S to the labile pool for absorption of S by the rice crop, application of organic manures has become inevitable in Typic Haplustalf soils. References Barrow, N.J. 1970. Comparison of the adsorption of molybdate, sulphate and phosphate by soils. Soil Sci., 107: 282-288 Bettany, S.E.,Saggar, S. and Stewart, J.W.P. 1985. Comparison of the amounts and forms of sulphur in organic matter fractions after 65 years of cultivation. Soil Sci. Soc. Am. J., 44: 70-75. Chao, T.T., Harwood, M.E. and Fong, S.C. 1964. Iron and aluminium coatings in relation to sulphur forms of soils. Proc. Soil Sci. Soc. America, 28 : 632-635 Chesnin, L. and Yien, C.H. 1951. Turbidimetric determination of available sulphates. Soil Sci. Soc. American Proc., 15: 149-151. Courchesne, F. 1992. Relationships between soil chemical properties and sulphate sorption kinetics in podzolic soils of Quebac. Canadian J. Soil Sci., 72: 467-480. Courchesne, F., Gobran, G.R. and Dubnesne, A. 1995. The role of humic acid on sulphate retention and release in a Podzol. Water, Air, Soil Pollution, 85: 1813-1818.
223 Evans, C.A. and Roast. 1946. Total organic sulphur and humus sulphur of Minnesota soils. Soil Sci., 59: 125137. Fox, R.L., Olsen, R.A. and Rhodes, H.F. 1964. Evaluating the sulphur status of soils by plant and soil tests. Proc. Soil Sci. Soc. America, 28: 243-246. Johnson, D.W. and Henderson, G.S. 1979. Sulphate adsorption and sulphur fractions in a highly weathered soil under a mixed deciduous forest. Soil Sci., 128: 38-40. Nguyen, M.L. and Goh, K.M. 1992. Sulphur mineralization and release of soluble organic sulphur from camp and non-camp soils of grazed pastures receiving long term super phosphate applications. Biol. Fertil. Soils, 14: 272-279. Sarkar, S.,Mandal, S.S., Maiti, P.K. and Chatterjee, B.N. 1994. Sulphur nutrition of crops with and without
organic manures under intensive cropping. Indian J. Agric. Sci., 64: 88-92 Schoenau, J.J. and Bettany, J.R.1987. Organic matter leaching as a component of carbon, nitrogen, phosphorus and sulphur cycles in a forest grassland and gleyed soil. Soil Sci. Soc. Am. J., 51: 646-651. Singh, V. and Sharma, R.L. 1993. Forms of sulphur in citrus growing soils of Agra region in Uttar Pradesh. J. Indian Soc. Soil Sci., 31: 482-485. Watwood, M.E. and Fitzgerald, J.W. 1988. Sulphur transformation in forest litter and soils : Results of laboratory and field incubations. Soil Sci. Soc. Am. J., 52: 1478-1483. Williams, C.H. and Steinbergs, A. 1959. Some soil sulphur fractions as chemical indices of available sulphur. Australian J. Agrl. Res., 10: 240-252.
Received: June 17, 2010; Revised: June 10, 2011; Accepted: September 2, 2011