2009 First Asian Conference on Intelligent Information and Database Systems
Rotational Invariant Wood Species Recognition through Wood Species Verification Jing Yi Tou 1, Yong Haur Tay 1, Phooi Yee Lau 1,2 1 Computer Vision and Intelligent Systems (CVIS) Group, Universiti Tunku Abdul Rahman (UTAR) Petaling Jaya, Malaysia. email:
[email protected] 2 Instituto de Telecomunicações Lisboa, Portugal. email:
[email protected]
increase the risk of collapsing roofs in the near future [1,2]. Wood species recognition using computer vision is still a new area of study. The wood species identification is a challenging task especially in the tropical countries where wood species are more abundant compared to the temperate zone. Wood species recognition requires well-trained experts to study the characteristic seen on the cross-section surfaces of the wood samples obtained under macroscopic view, and when required to, the microscopic view will be studied as well. The process of training an expert to perform the task is not easy, it is not only requiring talents and also hard work on studying the distinct characteristics of every wood sample occurring in the region [1,2]. Today, wood species recognition is still mainly conducted by well-trained wood identification experts. It takes a long period of time to train a wood identification expert until he is qualified to identify wood species with a high accuracy. There is a great demand in the industry involving the identification of wood species but the number of wood identification experts is not sufficient to meet the market need. An automated algorithm can be trained once and duplicated easily to meet the market demand. In tropical countries like Malaysia, there are more tree species compared to temperate countries [3]. Sometimes, a certain recognition process can take up to weeks or months for certain species of wood but with the wood species recognition algorithm, the recognition time is consistent and near to real time to produce a result.
Abstract An automated wood species recognition system using computer vision techniques is not widely used today, it is highly needed in various industries, but a wood identification expert is not easily trained to meet the market demand. This paper proposes a rotational invariant method using the grey level co-occurrence matrices (GLCM) as the features, an energy value representing the similarity between the test sample and the template is computed to decide whether the test sample is the same species as the template. A template is accepted when the energy is lower than the threshold value. The species with the highest number of accepted templates will be regarded as the recognition result. The experiment is conducted on six wood species of the CAIRO dataset with a total of 450 training samples and 60 testing samples and achieved a result of 80.00%. Keywords: Wood Species Recognition, Wood Species Verification, Texture Classification, Computer Vision.
1. Introduction The identification of wood species is very important because all species of wood has different properties and characteristic. These properties will affect the usage and implementations of the certain wood species. A mistake in selecting a piece of wood might lead to fatal results, take the example of using a piece of wood which is not strong enough as the roof trust will 978-0-7695-3580-7/09 $25.00 © 2009 IEEE DOI 10.1109/ACIIDS.2009.10
115
Computer vision techniques have been used to solve a number of problems that involve the study of patterns, such as text detection, face recognition, signature verification and etc. Since each species of wood has a type of pattern observable on the crosssection surfaces, computer vision algorithms is helpful to create an automated means to solve the problem. Computer vision techniques such as texture classification are useful algorithms that can be used to solve problem involving patterns that can be percept as textures [4,5,6], such as the wood species recognition problem where the cross-section surface can be viewed as different textures for different wood species [1,2,4]. There are many algorithms that are widely used for texture classification problems, in general they are mainly divided into five groups, namely; 1) structural; 2) statistical; 3) signal processing; 4) model-based stochastic [5] and; 5) morphology-based methods [7]. There are also many applications that combine algorithms from different groups. Among them, the statistical and signal processing methods are widely used because they has less restrictions and is easier to be used on all types of textures. In [2], a smaller wood dataset is tested to proof that wood recognition can be achieved using texture classification methods such as grey level co-occurrence matrices (GLCM). The second-order features of the GLCMs are also analyzed in this work to study the values of the second-order features. In this paper, the main objectives are: • To develop a rotational invariant algorithm to recognize the species of the wood samples using the macroscopic images of the cross-section surface. • To use wood species verification which is the process to verify if the test sample is of the same species with the template as an approach to achieve wood species recognition. Section 2 shows the wood verification and recognition algorithm used in the paper. Section 3 shows the experiment conducted. Section 4 shows the experiment results and analysis. Section 5 shows the conclusion and future works.
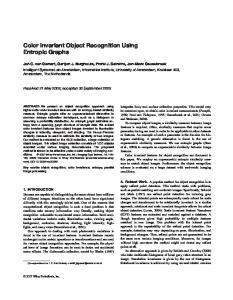
The algorithm will first train the system using energy value computed from the train set to get the threshold value. The energy value obtained from the test sample will be compared with the threshold to verify the test sample against each template and the best species is selected as the recognition result as shown in Figure 1.
Figure 1. Wood Species Recognition Algorithm Flow
2.1. Features Extraction First, we calculate the features from the train set of the wood samples. In this paper. the GLCM [8,9] are used as the features, four GLCMs are generated for each sample. Traditionally, the second-order features are calculated from the generated GLCMs. Here, the raw GLCMs are directly used as features without calculating the second-order features. The raw GLCMs are used as it has more information to be studied by the classifier than the second-order features. The feature vectors are stored as templates. The features are then calculated for the test samples, but for eight different orientations of the image.
2. Wood Verification and Recognition Wood species recognition can be accomplished by extracting the features and training them with a classifier to recognize the wood species. In this paper, we propose to add in a verification process prior to the recognition. The method will first use the wood verification algorithm to decide if the wood samples are of the same species with each of the templates provided and decide which species it should belong to.
116
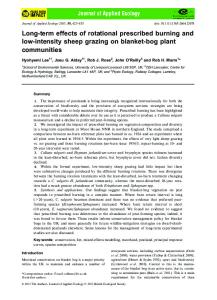
Instead of rotating the images for eight different orientations, the four directions selected for generating the GLCMs are changed. Eight orientations are calculated to select the rotation angle that provides the closest feature comparing to the templates since the images obtained might not be of a same orientation. The angle difference between each orientation is 45 degree. The rotation of direction selection for the GLCMs is shown in Figure 2.
1 T (x ) = µ x (E x′ ) − σ x (E x′ ) 2
(2)
After the threshold value is obtained, the energy E of the difference between the feature vectors of the test sample and the template is calculated as shown in Equation (3) where n denotes the number of features, f ′ denotes the feature vector template, f denotes the feature vector of the test sample and ω denotes the orientation of the test sample. n
E=∑
min ( f ′(i) − f ω (i))
2
(3)
i =1 ω = 0°...360°
If a test sample is having E less than Ti, they will be accepted as the same species with the ith template. The selection threshold is lower than the mean for each species; therefore it reduces the possibility of accepting false samples but will reject correct samples which are slightly more different than the templates.
Figure 2. Eight orientations of the GLCMs By studying eight different orientations, the test sample can be rotated to the nearest orientation with the templates. This can reduce the anomalies caused by differences in orientations and hence achieve rotational invariance for the algorithm.
2.3. Wood Species Recognition After conducting the wood species verification, for each sample, the species with the highest accepted templates will be selected as the winning class. For example, if there are six species of wood to be recognized, the first species has the highest number of templates being verified and accepted to be of the same species for the test sample compared to the other five species, it will be selected as the winning species and therefore the test sample is recognized to be of the first species.
2.2. Wood Species Verification Wood species verification involves the algorithm to verify whether the tested sample is from the same species with the samples in the templates. The verification process is accomplished by first comparing the test sample with the templates and decides whether they belong to a same species. First, for the training module, to calculate the similarity of two samples, the energy E ′ of the difference between the two feature vectors is calculated as shown in Equation (1) where n denotes the number of features, f ′ denotes the feature vector the templates, t denotes the number of templates, x ϵ [1,t] and y ϵ [1,t].
3. Experiment The experiments in this paper are conducted on six different species of wood from the CAIRO dataset from Centre for Artificial Intelligence and Robotics (CAIRO), Universiti Teknologi Malaysia (UTM). The samples are macroscopic view on the cross section surface of the wood samples. Images in the dataset are obtained from two different pieces of wood samples for each species. 90 samples are obtained from the first piece of wood sample for training templates and 10 samples are obtained from the second piece of wood sample for testing. The limitations of wood samples available have limited the number of samples that can be obtained. Samples of the dataset are shown in Figure 3. The following wood species from the CAIRO dataset are used:
n
E ′( x, y ) = ∑ ( f x′(i ) − f y′ (i )) 2
(1)
i =1
The threshold T is generated for each template according to species using Equation (2) where µ denotes the mean for each species, σ denotes the standard deviation for each species, s denotes the number of templates for the species, and x ϵ [1,s].
117
1. 2. 3. 4. 5. 6.
Sesendok (Endospermum malaccense). Keledang (Artocarpus kemando). Nyatoh (Palaquium impressinervium). Punah (Tetramerista glabra). Ramin (Gonystylus bancanus). Melunak (Pentace triptera).
of samples for a species classified to the classes show on the horizontal labels. The values on the diagonal that is bold are the recognition accuracy of each species (or class) that is correctly recognized. Table 1. Confusion matrix for experiment results for 576 × 768 images (%) 1 2 3 4 5 6
1 70 0 0 0 0 0
2 0 100 0 0 0 0
3 0 0 100 0 0 70
4 0 0 0 100 20 0
5 30 0 0 0 80 0
6 0 0 0 0 0 30
The average recognition rate is 80.00%. The recognition is poorest for the sixth species where it is greatly confused where 7 out of 10 samples from the species are misclassified as the third species.
Figure 3. Samples of CAIRO dataset
4.2. Experiment Result for 512 × 512 Images
The experiment is conducted on the six species of wood on the dataset. The GLCMs used for feature selection are generated by using eight grey values, spatial distance of one pixel and using four directions, which is the 0 degree, 45 degree, 90 degree and 135 degree. For the testing set, each image has features generated for eight orientations, with differences of 45 degree between each orientation. Each species is represented by a class and the winning class which is the species recognized using the test sample is selected by calculating the class with the highest number of accepted samples against the class’s templates.
The second experiment uses images of 512 × 512 pixels which is cropped from the 576 × 768 images from the previous experiment. The confusion matrix for the results is shown in Table 2. Table 2. Confusion matrix for experiment results for 512 × 512 images (%) 1 2 3 4 5 6
4. Results and Analysis Three different experiments are conducted in this paper, the first experiment is done by using images of 576 × 768 pixels and the following experiments is done by using images of 512 × 512 and 256 × 256 pixels respectively which are cropped from the 576 × 768 images from the first experiment. This attempt is to examine the influence of the area size towards the recognition results.
1 80 0 0 0 0 0
2 0 100 0 0 0 0
3 0 0 100 0 0 70
4 0 0 0 100 40 0
5 20 0 0 0 60 0
6 0 0 0 0 0 30
The average recognition rate is 78.33%. We can observe that for the first species, the recognition rate is better than the previous experiment although the fifth species shows a poorer recognition rate.
4.3. Experiment Result for 256 × 256 Images The second experiment uses images of 256 × 256 pixels which is cropped from the 576 × 768 images from the previous experiment. The confusion matrix for the results is shown in Table 3. The average recognition rate is 73.33%. The first species gain a higher recognition rate compared to the previous two experiments but a recognition rate has further decrease for the third and fifth species.
4.1. Experiment Result for 576 × 768 Images The first experiment uses images of 576 × 768 pixels for the experiment. The confusion matrix for the results is shown in Table 1. The confusion matrix shows the percentage of correctly and wrongly classified samples. Each row represents the percentage
118
Table 3. Confusion matrix for experiment results for
obtained using two pieces of wood samples, the templates created might not be general enough to represent the possible variations that might happen within a same species due to the differences in age, climate and geographical region the tree is growth. Therefore the wood species recognition algorithm in this paper failed to predict the patterns that are not learnt. This is one of the important reasons where the wood species lowers the recognition accuracy because the algorithm is trained to specifically recognize a single piece of wood sample or a single variation of the wood species. This finding show the importance of collecting more samples from a same species for the training purpose.
256 × 256 images (%) 1 2 3 4 5 6
1 90 0 0 0 0 0
2 0 100 0 0 0 0
3 0 0 90 0 0 90
4 0 0 0 100 50 0
5 10 0 0 0 50 0
6 0 0 10 0 0 10
4.4. Analysis The results show that the second and third experiment has lower results compared to the first. For wood species recognition, the image must be wide enough to cover sufficient characteristic to assist a wood identification expert in identifying the wood species, therefore a computer vision algorithm also need a image wide enough to cover the sufficient characteristics as shown in Figure 4.
Figure 5. Sample from the training set (left) compared to the sample from the testing set (right)
Figure 4. Images of 576 × 768, 512 × 512, 256 × 256 and the original image in the center
In the experiments, the result shows high accuracy for the second, third and forth species, but is lower for the rest, especially the sixth species. The confusion happens for the sixth species which is greatly classified as the third species. The first species sometimes confuse with the fifth species and the fifth species is confused with the forth. The sixth species has very low accuracy because the testing samples show more differences comparing to the training samples than the other species. We can see that the samples from the testing set is very different from the training set as shown in Figure 5. In this paper, the method is implemented using a texture classification-based algorithm. The distinct textures in the two different samples that are belonging to the same species can naturally cause confusion to a human trained only to classify the wood samples according to its texture. Since the dataset is only
Figure 6. A few samples of obvious defects circled in the images
From the experiment results, the average recognition rate decreases as the size for the area of interest decreases. However, for the first species, the situation is different as the recognition rate increases when the area of interest decreases. We examined the test samples of the first species and discovered that the image of the test sample includes some area of defects. On a smaller area of interest, only the centre is cropped therefore discarding the defects in most samples. A few
119
samples with obviously seen defects are shown in Figure 6.
6. Acknowledgement The authors would like to thank Y. L. Lew and the Centre for Artificial Intelligence and Robotics (CAIRO) of Universiti Teknologi Malaysia (UTM) for sharing the wood images. This research is partly funded by Malaysian MOSTI ScienceFund 01-02-11-SF0019.
5. Conclusion The findings of the paper show that wood species recognition can be implemented by adding a process of wood verification in between and achieves a recognition rate of 80%. The area of interest must be large enough to cover sufficient characteristic to assist the algorithm in recognizing the wood species, a small area of interest will result in lack of observable characteristics and the recognition result is less ideal. The wood verification algorithm in this paper is not performing at the best accuracy due to lack of wood specimens for training and testing. Therefore, the algorithm might be over trained to recognize a certain wood sample rather than a wood species. The lack of digital images of macroscopic wood cross-section in the market today leads to the difficulty of obtaining a good dataset. Observation of the wood samples show that there are possibilities of having more than one single texture from a same species, a clustering algorithm can be performed for the training samples within each species to cluster the different texture within a same species into multiple clusters. This will ensure that the means and standard deviations calculated will be better to describe the cluster of similar texture. In the future, we wish to deploy the wood recognition system onto an embedded platform. The integration of the application onto an embedded platform provides mobility and compactness to the system. This is helpful for the wood recognition problem as many wood samples are collected and directly identified in the forest. However, a large wood dataset comprising all the species that are encountered is needed before a robust embedded wood recognition system can be achieved. More experiments are needed to be run on large wood datasets to find the better solutions for recognizing large number of species.
7. References [1] Y.L. Lew, Design of an Intelligent Wood Recognition System for the Classification of Tropical Wood Species, M. E. Thesis, Universiti Teknologi Malaysia, 2005. [2] J.Y. Tou, P.Y. Lau, Y.H. Tay, “Computer Vision-based Wood Recognition System”, Proc. Int’l Workshop on Advanced Image Technology, Bangkok, 2007, pp. 197-202. [3] P.K.B. Menon, revised by A. Sulaiman, S.C. Lim, Structure and Identification of Malayan Woods. Forest Research Institute Malaysia, Kuala Lumpur, 1993. [4] J.Y. Tou, Y.H. Tay, P.Y. Lau, “Gabor Filters and Greylevel Co-occurrence Matrices in Texture Classification”, MMU International Symposium on Information and Communications Technologies, Petaling Jaya, 2007. [5] M. Tuceryan, A.K. Jain, “Texture Analysis”, in: C.H. Chen, L.F. Pau, P.S.P Wang (eds.), The Handbook of Pattern Recognition and Computer Vision (2nd Edition), World Scientific Publishing Co, 1998. [6] M. Partio, B. Cramariuc, M. Gabbouj, A. Visa, “Rock Texture Retrieval using Gray Level Co-occurrence Matrix”, Proc. of 5th Nordic Signal Processing Symposium, 2002, pp. 308-311. [7] Y.Q. Chen, Novel Techniques for Image Texture Classification, PhD Thesis, University of Southampton, United Kingdom, 1995. [8] R.M. Haralick, K. Shanmugam, I. Dinstein, “Textural Features for Image Classification”, IEEE Transactions on Systems, Man and Cybernatics, 1973, pp. 610-621. [9] M. Petrou, P.G. Sevilla, Image Processing: Dealing with Texture, Wiley, 2006.
120