Fiscal Policy and the Great Recession in the Euro Area ¨nter Coenen, Roland Straub, and Mathias Trabandt ⋆,† Gu
Abstract How much did fiscal policy contribute to euro area real GDP growth during the Great Recession? We estimate that discretionary fiscal measures have increased annualized quarterly real GDP growth during the crisis by up to 1.6 percentage points. We obtain our result by using an extended version of the European Central Banks New Area-Wide Model with a rich specification of the fiscal sector. A detailed modeling of the fiscal sector and the incorporation of as many as eight fiscal time series appear pivotal for our result. JEL Classification System: C11, E32, E62 Keywords: Fiscal policy, DSGE modelling, Bayesian inference, euro area
⋆ Correspondence: Coenen: Directorate General Research, European Central Bank, Kaiserstrasse 29, 60311 Frankfurt am Main, Germany, e-mail:
[email protected]; Straub: Directorate General International and European Relations, European Central Bank, Kaiserstrasse 29, 60311 Frankfurt am Main, Germany, e-mail:
[email protected]; Trabandt: Division of International Finance, Board of Governors of the Federal Reserve System, 20th Street and Constitution Avenue N.W, Washington, DC 20551, USA, e-mail:
[email protected]. †
This paper has been prepared for the American Economic Review, Papers and Proceedings, 2012. We have benefited from presentations of earlier drafts at the ECB Conference on “Monetary and Fiscal Policy Challenges in Times of Financial Stress”, at the Banque de France-Deutsche Bundesbank-University of Hamburg Workshop on “Current Macroeconomic Challenges”, at the Annual Congress 2011 of the German Economic Association, at Norges Bank, and at the AEA Meetings 2012. Without implicating, we are particularly grateful for comments from and helpful discussions with Kai Christoffel, Thorsten Drautzburg, Jordi Gal´ı, Robert Kollmann, Thomas Laubach, Eric Leeper, Marco Del Negro, Werner Roeger, Chris Sims, Frank Smets, Nikolai Staehler, Leopold von Thadden, Harald Uhlig and Anders Warne. We also thank Markus Kirchner for valuable support at an earlier stage in the preparation of this paper. The opinions expressed in the paper are those of the authors and do not necessarily reflect views of the institutions with which the authors are affiliated.
Non-technical Summary The recent financial crisis triggered a large-scale fiscal policy response in the euro area. In the policy debate, it is often argued that expansionary fiscal policies had a substantial impact on economic activity. So it is natural to ask how much did fiscal policy actually contribute to euro area real GDP growth during the crisis? In the wake of the financial crisis, fiscal multipliers have become once again the center of discussions within both academic and policy circles. Most of these discussions aimed at quantifying the size and the sensitivity of fiscal multipliers associated with the launch of large-scale fiscal stimulus packages. In this paper, and in contrast to previous studies, we provide an ex-post quantitative evaluation of the effectiveness of discretionary fiscal policies in influencing the euro area business cycle during the crisis. That is, on the basis of a growth accounting exercise we decompose the dynamics of real GDP growth in the euro area into fiscal and non-fiscal shocks over the period of 2007-10. To this end, we utilize an enhanced version of the ECB’s New Area-Wide Model for the euro area with a rich specification of the fiscal sector and employ time series for eight different fiscal variables. Our specification of the fiscal sector aims at balancing the need for a high degree of detail, which is necessary for conducting a meaningful quantitative analysis of the impact of fiscal policy on real GDP, and tractability, which allows us to identify the relevant economic mechanisms. Our model-based estimates suggest that discretionary fiscal policies in the euro area led to an increase in annualized quarterly real GDP growth by up to 1.6 percentage points during the crisis. The detailed modeling of the fiscal sector and the incorporation of as many as eight time series that characterize fiscal policy appear pivotal for our finding. That is, a baseline version of the model that has a rather stylized fiscal sector and that only measures one fiscal time series, namely government consumption, predicts a negligible role of discretionary fiscal policies for real GDP growth during the crisis.
i
1
Introduction
The recent financial crisis and recession—widely referred to as the “Great Recession”— triggered a large-scale fiscal policy response in the euro area. It is often argued that the expansionary fiscal measures enacted by national governments in 2009 had a substantial impact on economic activity. So a natural question that arises is how much did fiscal policy actually contribute to supporting euro area real GDP growth during the crisis. Most of the theoretical and empirical literature that analyzes the impact of fiscal policy on economic activity has focused on the size and sensitivity of fiscal multipliers or on the effectiveness of fiscal stimulus packages.1 Prominent examples are the recent model-based studies by Cogan et al. (2010), Christiano, Eichenbaum and Rebelo (2011) and Coenen et al. (2012).2 However, the full fiscal policy response to the financial crisis did not rely on discretionary fiscal stimulus alone. For instance, automatic stabilizers did provide further support to the economy. Therefore, it is deemed important to account for the effects of automatic stabilizers when assessing the quantitative impact of discretionary fiscal policies on real GDP. In this paper, and in contrast to previous model-based studies, we provide an ex-post evaluation of the overall effectiveness of discretionary fiscal policies in the euro area during the crisis on the basis of a growth accounting exercise. To this end, we utilize an enhanced version of the European Central Bank’s New Area-Wide Model (NAWM)3 with a detailed specification of the fiscal sector to decompose the dynamics of real GDP growth in the euro area into the contributions of fiscal and non-fiscal shocks over the period 2007-10. Our specification of the fiscal sector aims at balancing the need for a high degree of detail, which is essential for conducting a meaningful quantitative analysis of the impact of fiscal policy on real GDP, and tractability, which permits identifying the relevant economic mechanisms.
2
Enhancing the Role for Fiscal Policy
In the baseline version of the NAWM, like in the Smets and Wouters (2007) model and its many offsprings, the role of fiscal policy is rather stylized. The fiscal authority purchases a public consumption good (modeled as a simple autoregressive process), issues bonds, and 1
Two such large-scale fiscal packages were the American Recovery and Reinvestment Act (ARRA) in the United States and the European Economic Recovery Plan (EERP) in the European Union. 2 See also Erceg and Lind´e (2010), Uhlig (2010), Drautzburg and Uhlig (2011), Eggertsson (2011) and Woodford (2011). A review of the literature can be found in Coenen et al. (2012). 3 See Christoffel, Coenen and Warne (2008) for a description of the baseline version of the NAWM, which is an open-economy extension of the Smets and Wouters (2007) model used for forecasting and policy analysis.
1
levies different types of distortionary taxes, albeit at constant rates. Ricardian equivalence holds because of the simplifying assumption that the fiscal authority’s budget is balanced by means of lump-sum taxes. In the extended version of the NAWM, we allow fiscal policy to influence the economy through several additional channels. First, we adapt the baseline model by introducing non-Ricardian households in the form of rule-of-thumb consumers, following Coenen and Straub (2005) and Gal´ı, L´ opez-Salido and Vall´es (2007). To this end, we assume that there is a continuum of households, indexed by h ∈ [ 0, 1 ], which is split into two groups: (i) a share 1 − ω of Ricardian households, who accumulate physical capital and have access to financial markets and thus can smooth consumption intertemporally, and (ii) a share ω of non-Ricardian households, who simply consume their after-tax disposable income. Second, we augment the model by allowing for non-separable valuable government consumption similar to Leeper, Walker and Yang (2009b). This feature has several interesting implications. First, changes in government consumption affect optimal private consumption decisions directly, as opposed to the indirect wealth effect in case of separable government consumption. Second, conditional on the degree of complementarity a co-movement of private and government consumption may be obtained. Formally, aggregate consumption C˜h,t of household h is defined as a constant elasticity of substitution (CES) aggregate: C˜h,t =
1 υG
υG −1 υG
αG Ch,t
+ (1 − αG )
1 υG
υG −1 υG
Gt
!
υG υG −1
,
where Ch,t denotes the household’s consumption of private goods, and Gt measures government consumption. αG is a share parameter, and the parameter υG > 0 measures the elasticity of substitution between private consumption and government consumption. υG → 0 implies perfect complementarity, υG → ∞ gives perfect substitutability, and υG → 1 yields the Cobb-Douglas (CD) case. Third, public capital is added as an input for intermediate-goods production by domestic firms, which are indexed by f ∈ [ 0, 1 ] and have access to a standard CD technology taking ˜ f,t . The latter is a CES aggregate of private as inputs labor services and physical capital K capital services Kf,t and the public capital stock KG,t : ˜ f,t = K
1 υK
υK −1 υK
αK Kf,t
+ (1 − αK )
1 υK
υK −1 υK
KG,t
!
υK υK −1
,
where αK is a share parameter, and the parameter υK > 0 denotes the elasticity of substi2
tution determining the degree of complementarity between private capital services and the public capital stock. Similar to Leeper, Walker and Yang (2009b), we consider a one-period time-to-build technology for government investment becoming productive and augmenting the public capital stock, while private capital formation is subject to generalized investment adjustment costs. And fourth, we allow for a comprehensive set of fiscal instruments. On the expenditure side, we distinguish government consumption, government investment and government transfers. On the revenue side, we consider (distortionary) consumption taxes, labor income taxes and payroll taxes, as well as (non-distortionary) lump-sum taxes. The fiscal instruments are assumed to follow the prescriptions of simple feedback rules according to which the instruments react to their own lagged values and, except for consumption taxes, to real government debt, and to output. The output feedback component is thought to represent the operation of automatic stabilizers. Discretionary fiscal impulses are represented by unanticipated shocks entering the feedback rules. Following Leeper, Walker and Yang (2009a), we also allow for pre-announcement effects. We estimate the extended model over the sample period from 1985Q1 to 2010Q2, employing Bayesian inference methods.4 In estimating the model, we use time series for eight fiscal variables: government consumption, government investment, government transfers, indirect taxes, direct taxes, employees’ and employers’ social security contributions, as well as government debt. This contrasts with the use of a single fiscal time series for government consumption in the estimation of the baseline model. In Table 1, we report estimation results for selected parameters characterizing the fiscal sector in the extended model. The posterior mode estimate of the share of non-Ricardian households equals ω = 0.18, which is similar to, if not somewhat smaller than, the estimates reported in Coenen and Straub (2005). The posterior mode of the elasticity of substitution between private and government consumption goods is υG = 0.29, so that the two goods enter the households’ utility function as rather strong complements. Similarly, the posterior mode of the elasticity of substitution between private and public capital is υK = 0.84, giving rise to moderate complementarities in the composite capital stock. In obtaining these estimates, we have calibrated the share parameters in the aggregate consumption bundle and the composite capital stock with αG = 0.75 and αK = 0.9, respectively.5 4
For a more detailed presentation of the model and the estimation results see Coenen, Straub and Trabandt (2011). 5 At the prior and posterior mode, these parameter values imply roughly equal: (i) marginal products of private and public capital and (ii) marginal utilities of private (Ricardian) and government consumption.
3
Table 1: Selected estimation results for the extended model Posterior
Prior mode
5%
95%
0.18
0.12
0.24
A. Share of non-Ricardian households ω
B(0.5,0.1)
B. Elasticity of substitution in CES aggregates υG
N+ (1,0.5)
0.29
0.00
0.61
υK
N+ (1,0.5)
0.84
0.17
1.69
Note: This table provides information on the (marginal) prior and posterior distributions (mode and the 5 and 95 percent percentiles) of key parameters of the fiscal sector in the extended model.
3
Fiscal Policies during the Crisis
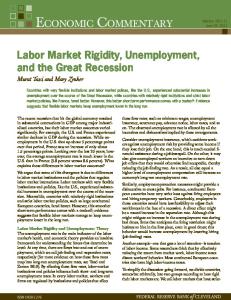
In order to assess the predictions of our enhanced model for the role of discretionary fiscal policies during the crisis, we compare the implied historical decomposition of euro area real GDP growth over the period 2007-10 with the decomposition implied by the baseline model with a stylized specification of the fiscal sector. We first consider the historical decomposition obtained with the baseline model. To this end, we decompose annualized quarter-on-quarter real GDP growth (in deviation from the mean growth rate) into the contributions of fiscal and non-fiscal shocks. With government consumption being the only observed fiscal variable, the baseline model features a single fiscal shock representing discretionary (unproductive) government spending. The historical decomposition depicted in Figure 1 suggests that discretionary government spending played a negligible role in stabilizing real GDP growth in the years 2009-10. This implies that in a counterfactual world without discretionary fiscal policy measures, real GDP outcomes would have not been significantly different from the ones observed. In contrast, in our model with an enhanced fiscal sector and using as many as eight different fiscal variables as observables, the role of discretionary fiscal policies is much more prominent. The decomposition of real GDP growth in Figure 2 suggests that discretionary fiscal measures pushed up annualized quarter-on-quarter growth rates by up to 1.6 percentage points (in 2009Q2).
4
Figure 1: Decomposition of euro area real GDP growth: The baseline model.
Historical decomposition of real GDP growth (demeaned) 2
Annualized quarterly growth rates
0 −2 −4 −6 −8 −10
Real GDP growth Gov. consumption shock
−12
Non−fiscal shocks 2007Q3
2008Q1
2008Q3
2009Q1
2009Q3
2010Q1
Figure 2: Decomposition of euro area real GDP growth: The extended model.
Historical decomposition of real GDP growth (demeaned) 2
Annualized quarterly growth rates
0 −2 −4 −6 −8 −10
Real GDP growth Fiscal shocks
−12
Non−fiscal shocks 2007Q3
2008Q1
2008Q3
5
2009Q1
2009Q3
2010Q1
Naturally, the question arises which fiscal shocks had the strongest positive impact on euro area real GDP growth during the crisis. To shed some light on that question, we present the contributions of the individual fiscal shocks in Figure 3. According to the figure, shocks to government investment, government consumption, transfers, as well as consumption and labor income taxes have all been important in supporting euro area GDP growth.6 Figure 3: Contributions of the individual fiscal shocks in the extended model.
Contribution of fiscal shocks to real GDP growth (demeaned)
Annualized quarterly growth rates
1.5
1
0.5
0 Total contrib. to real GDP growth Gov. consumption Gov. transfers Cons. tax Employer SSC Employee SSC Labor tax Gov. investment Lump−sum tax
−0.5
−1 2007Q3
2008Q1
2008Q3
2009Q1
2009Q3
2010Q1
Our findings on the size of discretionary fiscal measures and the relative importance of the fiscal shocks are broadly in line with the fiscal measures that were actually enacted by national governments in response to the crisis under the European Economic Recovery Plan (EERP).7
4
Inspecting the Mechanisms
What drives the important role of fiscal variables in our enhanced model? We aim to answer this question by highlighting the role of two particular features of our model: (i) 6
The slightly negative contribution of government investment in 2009Q1 is consistent with a sharp fall in public construction activity because of the adverse weather conditions around the turn of the year 2008. 7 In Coenen, Straub and Trabandt (2011), we cross-check our results by inspecting the model’s multipliers and by conducting a simulation-based assessment of the EERP similar to European Commission (2009) and Cwik and Wieland (2010). We show that our results are comparable to the findings in these studies, i.e. we find that the effects of fiscal stimulus measures can be sizeable but are rather short lived.
6
valued government consumption, and (ii) public capital. In order to simplify the exposition, we exclude all feedback and pre-announcement effects from the fiscal rules in the subsequent analysis. We only allow lump-sum taxes to react to government debt. Figure 4: Inspecting the mechanisms: Valued government consumption.
Priv. consumption after gov. consumption shock 0.08
Percent dev. from steady state
0.06 0.04 0.02 0 −0.02 −0.04 −0.06
υ =0.29 (estimate) G
−0.08
Non−valued gov. consumption υ =3
−0.1
G
−0.12 0
1
2
3
4 Quarters
5
6
7
8
In Figure 4, we examine the impact of an exogenous increase in government consumption on private consumption under three different parameterizations. Starting with the benchmark case of wasteful government consumption, i.e. with αG = 1 (as opposed to our calibrated value of αG = 0.75), the figure depicts a persistent negative response of private consumption to a government consumption shock (one standard deviation). The “crowding-out” of private consumption is, as usual, caused by the negative wealth effect implied by a build-up of government debt and the anticipation of a higher tax burden in the future.8 Assuming that government and private consumption are highly substitutable, e.g. with υG = 3, induces a strong negative reaction of private consumption to a government consumption shock. However our posterior mode estimate of υG = 0.29 suggests that the data favor a specification with a strong complementarity of government and private 8
Our estimated share of non-Ricardian households (ω = 0.18) is not large enough to overturn this effect. This result holds under rather general parameterizations of both ω and other key model parameters, as discussed in Coenen and Straub (2005). At the same time, it ensures that transfers have a positive, albeit small impact on private consumption.
7
consumption. In this case, we observe a positive and hump-shaped response of private consumption to an exogenous increase in government consumption. Figure 5: Inspecting the mechanisms: Public capital.
Priv. investment after gov. investment shock 0.05 Percent dev. from steady state
0.04
υK=0.25, αK=0.85 υK=0.25 υ =0.84 (estimate) K
0.03 0.02
υ =1.00 (Cobb−Douglas) K
υK=1000
0.01 0 −0.01 −0.02 −0.03 −0.04 −0.05 0
1
2
3
4 Quarters
5
6
7
8
In Figure 5, we evaluate the impact of an exogenous increase in government investment on private investment by varying the degree of substitutability of private and public capital (keeping the capital share parameter initially fixed at αK = 0.9). We choose as the benchmark the CD case with υK = 1. In this case, the reaction of private investment to a government investment shock (one standard deviation) is, as expected, substantially negative. When setting υK = 0.25, the decline in private investment following a government investment shock is markedly muted as private and public capital are strong complements. Using our posterior mode estimate of υK = 0.84 for simulating the response of private investment represents an intermediate case. This begs the question under which parametrization does a government investment shock “crowd in” private investment? It turns out that we need to set υK = 0.25 and αK = 0.85 to trigger a positive reaction of private investment after a government investment shock. Thus, only a rather strong complementarity together with a larger share of public capital in the aggregate capital stock would lead to crowding-in.
8
5
Conclusions
Our model-based estimates suggest that discretionary fiscal policies in the euro area led to an increase in annualized quarterly real GDP growth by up to 1.6 percentage points during the crisis. The detailed modeling of the fiscal sector and the incorporation of as many as eight time series that characterize fiscal policy appear to be pivotal for our result. That is, a baseline version of the model that has a rather stylized fiscal sector and that only measures one fiscal time series, namely government consumption, predicts a negligible role of discretionary fiscal policies for real GDP growth during the crisis. While our analysis has focused on the quantitative evaluation of the expansionary effects of discretionary fiscal measures during the crisis, the latter has led—partly as a consequence of the enacted measures—to a sizeable increase in government deficits and debt levels. Hence, future research ought to be extended towards examining the effects of fiscal consolidation strategies aimed at curtailing deficits and debt levels over the medium term. In pursuing this research, accounting for the endogenous nature of government bond premia, which have been rising sharply in some countries, will be a fundamental challenge.
9
References Christiano, Lawrence. J., Martin Eichenbaum, and Sergio Rebelo, 2011, “When Is the Government Spending Multiplier Large?”, Journal of Political Economy, 119, 78–121. Christoffel, Kai, G¨ unter Coenen, and Anders Warne, 2008, “The New Area-Wide Model of the Euro Area: A Micro-Founded Open-Economy Model for Forecasting and Policy Analysis”, European Central Bank Working Paper No. 944. Coenen, G¨ unter, Christopher J. Erceg, Charles Freedman, Davide Furceri, Michel Kumhof, Ren´e Lalonde, Douglas Laxton, Jesper Lind´e, Annabelle Mourougane, Dirk Muir, Susana Mursula, Carlos de Resende, John Roberts, Werner Roeger, Stephen Snudden, Mathias Trabandt, and Jan in’t Veld, 2012,“Effects of Fiscal Stimulus in Structural Models”, American Economic Journal: Macroeconomics, 4, 22–68. Coenen, G¨ unter, and Roland Straub, 2005, “Does Government Spending Crowd in Private Consumption? Theory and Empirical Evidence for the Euro Area”, International Finance, 8, 435–70. Coenen, G¨ unter, Roland Straub, and Mathias Trabandt, 2011, “Fiscal Policy and the Great Recession in the Euro Area”, unpublished, extended version available on authors’ webpages. Cogan, John F., Tobias Cwik, John B. Taylor, and Volker Wieland, 2010, “New Keynesian versus Old Keynesian Government Spending Multipliers”, Journal of Economic Dynamics and Control, 34. 281–95. Cwik, Tobias, and Volker Wieland, 2010, “Keynesian Government Spending Multipliers and Spillovers in the Euro Area”, European Central Bank Working Paper No. 1276. Drautzburg, Thorsten, and Harald Uhlig, 2011, “Fiscal Stimulus and Distortionary Taxation”, National Bureau of Economic Research Working Paper No. 17111. Eggertsson, Gauti B., 2011, “What Fiscal Policy is Effective at Zero Interest Rates?”, in: Daron Acemoglu and Michel Woodford (eds), NBER Macroeconomics Annual 2010, Vol. 25, 59–112, Chicago: University of Chicago Press. Erceg, Christopher J., and Jesper Lind´e, 2010, “Is There a Fiscal Free Lunch in a Liquidity Trap?”, Board of Governors of the Federal Reserve System, International Finance Discussion Paper No. 1003. European Commission, 2009, “Public Finances in EMU”, European Economy, 5/2009, 18–19. Gal´ı, Jordi, J. David L´ opez-Salido, and Javier Vall´es, 2007, “Understanding the Effects of Government Spending on Consumption”, Journal of the European Economic Association, 5, 227–70. Leeper, Eric, Todd B. Walker, and Shu-Chun S. Yang, 2009a, “Fiscal Foresight and Information Flows”, National Bureau of Economic Research Working Paper No. 14630. 10
Leeper, Eric, Todd B. Walker, and Shu-Chun S. Yang, 2009b, “Government Investment and Fiscal Stimulus in the Short and Long Runs”, National Bureau of Economic Research Working Paper No. 15153. Smets, Frank, and Rafael Wouters, 2007, “Shocks and Frictions in US Business Cycles: A Bayesian DSGE Approach”, American Economic Review, 97, 586–606. Uhlig, Harald, 2010, “Some Fiscal Calculus”, American Economic Review, 100, 30–34. Woodford, Michael, 2011, “Simple Analytics of the Government Expenditure Multiplier”, American Economic Journal: Macroeconomics, 3, 1–35.
11