Rowe Heath Charlemont
Hawley
Colrain Shelburne
Buckland
Ashfield
Plainfield
MOHAWK TRAIL REGIONAL SCHOOL DISTRICT 2017 STATE OF THE DISTRICT ADDRESS
Presented by: Michael A. Buoniconti Superintendent of Schools Mohawk Trail Regional School District December 6, 2017
Mohawk Trail Regional School District 2017 State of District Address
PURPOSE
• To provide the Mohawk School Community with an understanding of the “State of the District “
Mohawk Trail Regional School District 2017 State of District Address
OVERVIEW • Leadership and Governance • Enrollment • Student Achievement • Graduation & College Prep • Finances • Future Direction
Mohawk Trail Regional School District 2017 State of District Address
LEADERSHIP AND GOVERNANCE
Mohawk Trail Regional School District 2017 State of District Address
LEADERSHIP AND GOVERNANCE SCHOOL COMMITTEE
• 16 member School Committee • 6 new members since FY16 • 37.5% turnover
• 3 chairmen over past 10 years
Mohawk Trail Regional School District 2017 State of District Address
LEADERSHIP AND GOVERNANCE SCHOOL COMMITTEE TOWN ASHFIELD
MEMBER Poppy Doyle Emily Robertson BUCKLAND Martha Thurber, Chair David Parrella CHARLEMONT Julia Aron Evelyn Locke COLRAIN Kate Barrows Nina Martin-Anzuoni HAWLEY Suzanne Crawford, Vice Chair Vacant HEATH Budge Litchfield Robert Gruen PLAINFIELD Heather Davis Leslie Rule SHELBURNE Jason Cusimano Jeremy McGeorge
• •
TERM 2013 - present 2010 - present 2012 - present 2017 - present 2006 - present 2013 - present 2017 - present 2012 - present 2012 - present
YEARS 4.0 7.0 5.0 0.5 11.0 4.0 0.5 5.0 5.0 0.0 2015 - present 2.0 2012-2014 and 2016 - present 3.0 2006 - present 11.0 2016 - present 1.0 2016 - present 1.0 2017 - present 0.5
Total committee experience: 60.5 years Average individual experience: 4.0 years
Mohawk Trail Regional School District 2017 State of District Address
LEADERSHIP AND GOVERNANCE DISTRICT LEADERSHIP TEAM POSITION Superintendent of Schools Director of Finance and Business Operations Director of Pupil Personnel Services PK-12 Director of Curriculum and Instruction Co-Principal, Mohawk Co-Principal, Mohawk Principal, Buckland-Shelburne Elementary Principal, Sanderson Academy Principal, Colrain Central School
HIRE DATE YEARS CONTRACT 7/1/2005 12 6/30/2022 8/21/2017 0 6/30/2022 8/1/2013 4 6/30/2019 7/1/2012 5 6/30/2022 7/1/2010 7 6/30/2019 8/1/2016 1 6/30/2019 7/1/2010 7 6/30/2018 7/1/2013 4 6/30/2019 7/1/2011 6 6/30/2019
•
Total experience with Mohawk: 46 years
•
Average individual experience with Mohawk: 5 years
Mohawk Trail Regional School District 2017 State of District Address
LEADERSHIP AND GOVERNANCE UNIT A (Teachers and Specialists)
SCHOOL MOHAWK MIDDLE-HIGH SCHOOL BUCKLAND SHELBURNE ELEMENTARY SANDERSON ACADEMY COLRAIN CENTRAL SCHOOL TOTALS
FTE AVG YRS EXP NEW STAFF PERCENTAGE NEW STAFF 50.5 8.6 11 21.8% 28.7 9.9 6 20.9% 19.2 9.0 3 15.6% 15.6 10.2 1 6.4% 114.1 9.3 21 18.4%
•
Total experience with Mohawk: 1,258 years (A LOT!!)
•
Average individual experience with Mohawk: 9.3 years
Mohawk Trail Regional School District 2017 State of District Address
ENROLLMENT
Mohawk Trail Regional School District 2017 State of District Address
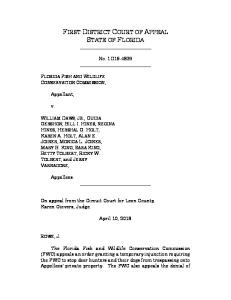
ENROLLMENT • Leveled off since FY14
• 18% decline over past 10 years 1,400 1,200
1,157
1,130
1,076
1,049
1,007
1,000
959
964
FY14
FY15
1,005
965
944
FY17
FY18
800 600 400 200 FY9
FY10
FY11
FY12
FY13
•
FY16
Closure of Heath Elementary –
## students attending Hawlemont
Mohawk Trail Regional School District 2017 State of District Address
ENROLLMENT - DEMOGRAPHICS 2016-2017
2007-2008
Mohawk Trail Regional School District 2017 State of District Address
ENROLLMENT – HIGH NEEDS Mohawk State
2012-2013 2013-2014 2014-2015 2015-2016 2016-2017 45.1% 46.2% 39.4% 41.2% 44.6% 47.9% 48.8% 42.2% 43.5% 45.2%
5-Yr Avg 43.3% 45.5%
% OF HIGH NEEDS STUDENTS 50.0%
• Students with disabilities
• English language learners (ELL)
40.0%
30.0%
Mohawk
and former ELL students • Low income students (eligible for
State 20.0%
free/reduced price school lunch) 10.0%
0.0% 2012-2013 2013-2014 2014-2015 2015-2016 2016-2017
Mohawk Trail Regional School District 2017 State of District Address
ENROLLMENT – SPECIAL EDUCATION Mohawk State
2012-2013 2013-2014 2014-2015 2015-2016 2016-2017 5-Yr Avg 19.7% 19.6% 18.3% 18.8% 20.3% 19.3% 17.0% 17.0% 17.1% 17.2% 17.4% 17.1% 25.0%
20.0%
• Percentage of students with disabilities 2.2% higher than State over past 5 years
% OF STUDENTS WITH DISABILITIES 19.7%
20.3%
19.6% 18.3%
18.8%
15.0% Mohawk State
10.0%
5.0%
0.0% 2012-2013 2013-2014 2014-2015 2015-2016 2016-2017
Mohawk Trail Regional School District 2017 State of District Address
ENROLLMENT – STUDENT TEACHER RATIO # Students per Teacher 2012-2013 2013-2014 2014-2015 2015-2016 2016-2017 5-Yr Avg Mohawk 12.2 12.9 13.6 14.6 13.5 13.4 State 13.5 13.6 13.3 13.2 13.2 13.4
Student - Teacher Ratio 16
14
• Student per teacher ratio has been the same as that of the State over past 5 years
12
10
Mohawk
8
State 6
4
2
0 2012-2013
2013-2014
2014-2015
2015-2016
2016-2017
Mohawk Trail Regional School District 2017 State of District Address
ENROLLMENT – AVG CLASS SIZE Avg Class Size 2012-2013 2013-2014 2014-2015 2015-2016 2016-2017 5-Yr Avg Mohawk 12.6 14.0 13.1 14.0 16.0 13.9 State 18.2 18.1 18.0 18.0 18.0 18.1
Average Class Size 25
•Mohawk average class size 4.2 students less than that of the State over past 5 years
20
15 Mohawk State
10
5
0 2012-2013
2013-2014
2014-2015
2015-2016
2016-2017
Mohawk Trail Regional School District 2017 State of District Address
STUDENT ACHIEVEMENT
Mohawk Trail Regional School District 2017 State of District Address
Massachusetts public schools are leading the nation
• MA public schools and students are at the top: •
#1 in the U.S. in reading and math on NAEP, “The Nation’s Report Card” (2015)
• #1 in the world in reading on the PISA international
assessment (2016) • #1 in Advanced Placement success in the country (2017)
Mohawk Trail Regional School District 2017 State of District Address
MA students are #1 in the country
2005
2007
2009
2011
2013
2015
Grade 4 Reading
1st
1st
1st
1st
1st*
1st
Grade 8 Reading
1st
1st*
1st*
1st*
1st*
1st*
Grade 4 Math
1st
1st
1st*
1st*
1st*
1st*
Grade 8 Math
1st
1st
1st
1st
1st
1st*
Source: The National Assessment of Educational Progress (NAEP) (the Nation’s Report Card)
* Statistically tied with other states
Mohawk Trail Regional School District 2017 State of District Address
MA students are globally competitive • 72 countries/educational systems participating • Reading: Ranked #1 • Science: Ranked #2 • Singapore #1
• Math: Ranked #12 1. Singapore 2. Hong Kong 3. Macau (China) 4. Taiwan 5. Japan 6. Republic of Korea 7. Switzerland 8. Estonia 9. Canada 10.Netherlands 11.Beijing-Shanghai-Jiangsu-Guangdong Source: 2015 Program for International Student Assessment (PISA); 15 year-olds
Mohawk Trail Regional School District 2017 State of District Address
EDUCATION – MOHAWK DISTRICT MOHAWK DISTRICT English Language Arts - Proficient-Advanced/ Meeting-Exceeding 2012 2013 2014 2015 2016 5-Yr Avg Mohawk 69.0% 66.0% 74.0% 76.0% 71.0% 71.2% State 69.0% 69.0% 69.0% NA NA 69.0%
ENGLISH LANGUAGE ARTS MOHAWK DISTRICT English Language Arts - Student Growth Percentile 2012
Mohawk English Language Arts Proficient-Advanced / Meeting-Exceeding
Mohawk State
80.0%
70.0%
2013
47.0 50.0
44.0 50.0
2014 48.0 50.0
2015 51.0
2016
5-Yr Avg
45.0
47.0 50.0
Mohawk English Language Arts Proficient-Advanced / Meeting-Exceeding
60.0% 50.0%
80.0%
Mohawk
40.0%
State
30.0%
70.0% 60.0%
20.0%
50.0%
10.0%
40.0%
0.0%
30.0%
2012
2013
2014
2015
2016
5-Yr Avg
•Mohawk ELA proficiency 2.2% higher than State over past 5 years
Mohawk
State
20.0% 10.0% 0.0% 2012
2013
2014
2015
2016
5-Yr Avg
•MA DESE stopped publishing State MCAS results during transition to PARCC 2015-2016
Mohawk Trail Regional School District 2017 State of District Address
EDUCATION – MOHAWK DISTRICT MOHAWK DISTRICT Mathematics - Proficient-Advanced/ Meeting-Exceeding 2012 2013 2014 2015 2016 5-Yr Avg Mohawk 56.0% 59.0% 60.0% 60.0% 56.0% 58.2% State 59.0% 61.0% 60.0% NA NA 60.0%
MATHEMATICS MOHAWK DISTRICT Mathematics - Student Growth Percentile 2012
Mohawk Mathematics Proficient-Advanced / Meeting-Exceeding
Mohawk State
70.0%
50.0 50.0
2013 48.0 50.0
2014 51.0 50.0
2015 55.0
2016
5-Yr Avg
43.0
49.4 50.0
Mohawk Mathematics - Student Growth
60.0% 60.0
50.0%
50.0
40.0% Mohawk 30.0%
State
20.0%
40.0
Mohawk
30.0
State
10.0%
20.0
0.0% 2012
2013
2014
2015
2016
5-Yr Avg
•Mohawk Math proficiency 1.8% lower than State over past 5 years
10.0 0.0 2012
2013
2014
2015
2016
5-Yr Avg
•MA DESE stopped publishing State MCAS results during transition to PARCC 2015-2016
Mohawk Trail Regional School District 2017 State of District Address
EDUCATION – MOHAWK DISTRICT SCIENCE AND TECHNOLOGY/ ENGINEERING MOHAWK DISTRICT Science and Tech/Eng - Proficient-Advanced/ Meeting-Exceeding 2012 2013 2014 2015 2016 5-Yr Avg Mohawk 50.0% 53.0% 52.0% 51.0% 53.0% 51.8% State 54.0% 53.0% 55.0% NA NA 54.0%
•Mohawk Science and Tech/Eng proficiency 2.2% lower than State over past 5 years
Mohawk Science and Technology/Engineering Proficient-Advanced / Meeting-Exceeding 60.0% 50.0% 40.0% Mohawk
30.0%
State 20.0% 10.0%
0.0% 2012
2013
2014
2015
2016
5-Yr Avg
•MA DESE stopped publishing State MCAS results during transition to PARCC 2015-2016
Mohawk Trail Regional School District 2017 State of District Address
EDUCATION – MOHAWK MS-HS
Mohawk Trail Regional School District 2017 State of District Address
EDUCATION – MOHAWK HS
Mohawk State
MOHAWK GRADE 10 English Language Arts - Proficient-Advanced 2013 2014 2015 2016 2017 5-Yr Avg 92.0% 92.0% 90.0% 91.0% 89.0% 90.8% 91.0% 89.0% 91.0% 92.0% 91.0% 90.8%
Mohawk Grade 10 English Language Arts Proficient-Advanced 100.0% 90.0%
ENGLISH LANGUAGE ARTS MOHAWK GRADE 10 English Language Arts - Student Growth Percentile 2013 Mohawk State
80.0%
53.0 50.0
2014 52.0 50.0
2015 40.5 50.0
2016 45.0 50.0
2017 40.0 50.0
5-Yr Avg 46.1 50.0
Mohawk Grade 10 Math - Student Growth
70.0% 60.0
60.0% 50.0%
Mohawk
40.0%
State
30.0%
50.0 40.0
20.0% Mohawk
30.0
10.0%
State
0.0% 2013
2014
2015
2016
2017
5-Yr Avg
20.0 10.0
•Mohawk Grade 10 ELA proficiency same as State over past 5 years
0.0 2013
2014
2015
2016
2017
5-Yr Avg
•Able to track Grade 10 during transition from MCAS to PARCC to MCAS 2.0
Mohawk Trail Regional School District 2017 State of District Address
EDUCATION – MOHAWK MS-HS MOHAWK GRADE 10 Mathematics - Proficient-Advanced 2013 2014 2015 2016 2017 5-Yr Avg 84.0% 87.0% 82.0% 77.0% 78.0% 81.6% 80.0% 78.0% 78.0% 78.0% 79.0% 78.6%
Mohawk State
Mohawk Grade 10 Mathematics Proficient-Advanced
MATHEMATICS MOHAWK GRADE 10 Mathematics - Student Growth Percentile 2013 Mohawk State
60.0
51.0 50.0
2014 49.5 50.0
2015 51.0 50.0
2016
2017
32.5 50.0
51.5 50.0
5-Yr Avg 47.1 50.0
50.0
Mohawk Grade 10 Math - Student Growth
40.0 30.0
Mohawk
20.0
State
60.0 50.0
10.0 40.0
0.0 2013
2014
2015
2016
2017
5-Yr Avg
Mohawk
30.0
State
•Mohawk Grade 10 Mathematics proficiency 3% higher than the State over past 5 years
20.0 10.0 0.0 2013
2014
2015
2016
2017
5-Yr Avg
•Able to track Grade 10 during transition from MCAS to PARCC to MCAS 2.0
Mohawk Trail Regional School District 2017 State of District Address
EDUCATION – MOHAWK MS-HS MOHAWK GRADE 10 Science and Technolog/Engineering - Proficient-Advanced 2013 2014 2015 2016 2017 5-Yr Avg Mohawk 80.0% 77.0% 75.0% 76.0% 75.0% 76.6% State 71.0% 71.0% 71.0% 73.0% 74.0% 72.0%
•Mohawk Grade 10 Science and Technology/ Engineering proficiency 4.6% higher than the State over past 5 years
SCIENCE AND TECHNOLOGY/ ENGINEERING
Mohawk Grade 10 Science and Technology/Engineering Proficient-Advanced 90.0% 80.0% 70.0% 60.0% 50.0%
Mohawk
40.0%
State
30.0% 20.0% 10.0%
0.0% 2013
2014
2015
2016
2017
5-Yr Avg
•Able to track Grade 10 during transition from MCAS to PARCC to MCAS 2.0
Mohawk Trail Regional School District 2017 State of District Address
EDUCATION – BUCKLAND-SHELBURNE
Mohawk Trail Regional School District 2017 State of District Address
EDUCATION – BUCKLAND-SHELBURNE BUCKLAND-SHELBURNE ELEMENTARY English Language Arts - Proficient-Advanced/ Meeting-Exceeding 2013 2014 2015 2016 2017 5-Yr Avg BSE 65.0% 70.0% 77.0% 59.0% 47.0% 63.6% State 60.0% 61.0% 64.0% 49.0% 49.0% 56.6%
BSE English Language Arts Proficient-Advanced / Meeting-Exceeding 70.0 60.0
ENGLISH LANGUAGE ARTS
BSE State
BUCKLAND-SHELBURNE ELEMENTARY English Language Arts - Student Growth Percentile 2013 2014 2015 2016 2017 5-Yr Avg 56.0 54.5 64.0 28.5 42.0 49.0 50.0 50.0 50.0 50.0 50.0 50.0
50.0
BSE ELA - Student Growth
40.0
BSE
30.0
70.0
State
20.0
60.0
10.0
50.0
0.0 2013
2014
2015
2016
2017
5-Yr Avg
40.0
BSE
30.0
State
20.0 10.0 0.0 2013
2014
2015
2016
2017
5-Yr Avg
Mohawk Trail Regional School District 2017 State of District Address
EDUCATION – BUCKLAND-SHELBURNE BUCKLAND-SHELBURNE ELEMENTARY Mathematics - Proficient-Advanced/ Meeting-Exceeding 2013 2014 2015 2016 2017 5-Yr Avg Mohawk 51.0% 55.0% 48.0% 54.0% 44.0% 50.4% State 62.0% 62.0% 64.0% 48.0% 48.0% 56.8%
BSE Mathematics Proficient-Advanced / Meeting-Exceeding 70.0
MATHEMATICS BUCKLAND-SHELBURNE ELEMENTARY Mathematics - Student Growth Percentile 2013 2014 2015 2016 2017 5-Yr Avg 37.0 51.0 55.0 48.0 61.5 50.5 50.0 50.0 50.0 50.0 50.0 50.0
BSE State
60.0
BSE Mathematics - Student Growth
50.0 40.0
BSE
30.0
State
70.0
20.0
60.0
10.0
50.0
0.0 2013
2014
2015
2016
2017
5-Yr Avg
40.0 BSE 30.0
State
20.0 10.0 0.0 2013
2014
2015
2016
2017
5-Yr Avg
Mohawk Trail Regional School District 2017 State of District Address
EDUCATION – BUCKLAND-SHELBURNE SCIENCE AND TECHNOLOGY/ ENGINEERING BUCKLAND-SHELBURNE ELEMENTARY Science and Tech/Eng - Proficient-Advanced/ Meeting-Exceeding 2013 2014 2015 2016 2017 5-Yr Avg BSE 45.0% 31.0% 60.0% 45.0% 53.0% 46.8% State 54.0% 56.0% 53.0% 51.0% 46.0% 52.0%
BSE Science and Technology/Engineering Proficient-Advanced / Meeting-Exceeding 70.0% 60.0% 50.0% 40.0%
BSE
30.0%
State
20.0% 10.0% 0.0% 2013
2014
2015
2016
2017
5-Yr Avg
Mohawk Trail Regional School District 2017 State of District Address
EDUCATION – SANDERSON ACADEMY
Mohawk Trail Regional School District 2017 State of District Address
EDUCATION – SANDERSON ACADEMY SANDERSON ACADEMY English Language Arts - Proficient-Advanced/ Meeting-Exceeding 2013 2014 2015 2016 2017 5-Yr Avg Sanderson 64.0% 83.0% 77.0% 74.0% 57.0% 71.0% State 60.0% 61.0% 64.0% 49.0% 49.0% 56.6%
Sanderson English Language Arts Proficient-Advanced / Meeting-Exceeding 9000.0% 8000.0% 7000.0% 6000.0% 5000.0% 4000.0% 3000.0% 2000.0% 1000.0% 0.0%
ENGLISH LANGUAGE ARTS SANDERSON ACADEMY English Language Arts - Student Growth Percentile 2013 2014 2015 2016 2017 5-Yr Avg Sanderson 44.0 38.5 43.0 26.0 29.5 36.2 State 50.0 50.0 50.0 50.0 50.0 50.0
Sanderson ELA - Student Growth
Sanderson State
60.0 50.0 40.0
2013
2014
2015
2016
2017
5-Yr Avg
Sanderson
30.0
State
20.0 10.0 0.0 2013
2014
2015
2016
2017
5-Yr Avg
Mohawk Trail Regional School District 2017 State of District Address
EDUCATION – SANDERSON ACADEMY SANDERSON ACADEMY Mathematics - Proficient-Advanced/ Meeting-Exceeding 2013 2014 2015 2016 2017 5-Yr Avg Sanderson 65.0% 71.0% 65.0% 68.0% 59.0% 65.6% State 62.0% 62.0% 64.0% 48.0% 48.0% 56.8%
Sanderson Mathematics Proficient-Advanced / Meeting-Exceeding 8000.0% 7000.0% 6000.0% 5000.0% 4000.0% 3000.0% 2000.0% 1000.0% 0.0%
MATHEMATICS
Sanderson State
SANDERSON ACADEMY Mathematics - Student Growth Percentile 2013 2014 2015 2016 2017 5-Yr Avg 48.5 38.5 33.5 27.5 17.0 33.0 50.0 50.0 50.0 50.0 50.0 50.0
Sanderson ELA - Student Growth Sanderson State
60.0 50.0 40.0
2013
2014
2015
2016
2017
5-Yr Avg
Sanderson
30.0
State
20.0 10.0 0.0 2013
2014
2015
2016
2017
5-Yr Avg
Mohawk Trail Regional School District 2017 State of District Address
EDUCATION – SANDERSON ACADEMY SCIENCE AND TECHNOLOGY/ ENGINEERING SANDERSON ACADEMY Science and Tech/Eng - Proficient-Advanced/ Meeting-Exceeding 2013 2014 2015 2016 2017 5-Yr Avg Sanderson 70.0% 81.0% 55.0% 61.0% 97.0% 72.8% State 60.0% 61.0% 64.0% 49.0% 49.0% 56.6%
Sanderson Science and Technology/Engineering Proficient-Advanced / Meeting-Exceeding 100.0%
90.0% 80.0% 70.0% 60.0% 50.0%
Sanderson
40.0%
State
30.0% 20.0% 10.0% 0.0% 2013
2014
2015
2016
2017
5-Yr Avg
Mohawk Trail Regional School District 2017 State of District Address
EDUCATION – COLRAIN CENTRAL
Mohawk Trail Regional School District 2017 State of District Address
EDUCATION – COLRAIN CENTRAL COLRAIN CENTRAL SCHOOL English Language Arts - Proficient-Advanced/ Meeting-Exceeding 2013 2014 2015 2016 2017 5-Yr Avg Colrain 33.0% 63.0% 72.0% 60.0% 44.0% 54.4% State 60.0% 61.0% 64.0% 49.0% 49.0% 56.6%
ENGLISH LANGUAGE ARTS
Colrain English Language Arts Proficient-Advanced / Meeting-Exceeding Colrain State
70.0 60.0
COLRAIN CENTRAL SCHOOL English Language Arts - Student Growth Percentile 2013 2014 2015 2016 2017 5-Yr Avg 24.0 48.5 62.0 52.0 40.0 45.3 50.0 50.0 50.0 50.0 50.0 50.0
50.0
Colrain ELA - Student Growth
40.0
Colrain
30.0
State
20.0
70.0 60.0 50.0
10.0 0.0
40.0
2013
2014
2015
2016
2017
Colrain
5-Yr Avg 30.0
State
20.0 10.0 0.0 2013
2014
2015
2016
2017
5-Yr Avg
Mohawk Trail Regional School District 2017 State of District Address
EDUCATION – COLRAIN CENTRAL COLRAIN CENTRAL SCHOOL Mathematics - Proficient-Advanced/ Meeting-Exceeding 2013 2014 2015 2016 2017 5-Yr Avg Colrain 44.0% 51.0% 67.0% 55.0% 38.0% 51.0% State 60.0% 61.0% 64.0% 49.0% 49.0% 56.6%
Colrain Mathematics Proficient-Advanced / Meeting-Exceeding 80.0
MATHEMATICS COLRAIN CENTRAL SCHOOL Mathematics - Student Growth Percentile 2013 2014 2015 2016 2017 5-Yr Avg 26.0 42.0 56.5 69.0 52.0 49.1 50.0 50.0 50.0 50.0 50.0 50.0
Colrain State
70.0
Colrain Mathematics - Student Growth
60.0 50.0 40.0
Colrain
30.0
State
80.0 70.0
20.0
60.0
10.0
50.0
0.0
Colrain
40.0
2013
2014
2015
2016
2017
5-Yr Avg
State
30.0 20.0 10.0 0.0 2013
2014
2015
2016
2017
5-Yr Avg
Mohawk Trail Regional School District 2017 State of District Address
EDUCATION – COLRAIN CENTRAL SCIENCE AND TECHNOLOGY/ ENGINEERING COLRAIN CENTRAL SCHOOL Science and Tech/Eng - Proficient-Advanced/ Meeting-Exceeding 2013 2014 2015 2016 2017 5-Yr Avg Colrain 10.0% 47.0% 33.0% NA 36.0% 31.5% State 60.0% 61.0% 64.0% 49.0% 49.0% 56.6%
Colrain Science and Technology/Engineering Proficient-Advanced / Meeting-Exceeding 70.0% 60.0% 50.0% 40.0%
Colrain
30.0%
State
20.0% 10.0% 0.0% 2013
2014
2015
2016
2017
5-Yr Avg
Mohawk Trail Regional School District 2017 State of District Address
GRADUATION & COLLEGE PREP
Mohawk Trail Regional School District 2017 State of District Address
GRADUATION RATE 2011-2012 2012-2013 2013-2014 2014-2015 2015-2016 5-Yr Avg Mohawk 77.7% 83.3% 85.3% 87.8% 81.9% 83.2% State 84.7% 85.0% 86.1% 87.3% 87.5% 86.1%
4-Year Graduation Rate •168 credits required to graduate
100.0% 90.0% 80.0% 70.0% 60.0% 50.0% 40.0% 30.0% 20.0% 10.0% 0.0%
Mohawk State
Mohawk Trail Regional School District 2017 State of District Address
ADVANCED PLACEMENT EXAMS
•
Mohawk offers 10 AP courses
• 67.3% of students scored 3-5 in AP courses • 1.6% higher than State average
Mohawk Trail Regional School District 2017 State of District Address
COLLEGE ENTRANCE EXAMS SAT - Reading 2011-2012 2012-2013 2013-2014 2014-2015 2015-2016 5-YR AVG Mohawk 543 523 514 530 545 531 State 506 507 508 508 509 508
SAT - Reading 600
•Mohawk students scored on average 23 points higher than the State on the SAT Reading test over the past 5 years
500
400
Mohawk
300
State 200
100
0 2011-2012
2012-2013
2013-2014
2014-2015
2015-2016
5-YR AVG
Mohawk Trail Regional School District 2017 State of District Address
COLLEGE ENTRANCE EXAMS SAT - Writing 2011-2012 2012-2013 2013-2014 2014-2015 2015-2016 5-YR AVG Mohawk 517 500 494 503 510 505 State 500 501 499 497 497 499 SAT - Writing 600
•Mohawk students scored on average 6 points higher than the State on the SAT Writing test over the past 5 years
500
400
Mohawk
300
State
200
100
0 2011-2012
2012-2013
2013-2014
2014-2015
2015-2016
5-YR AVG
Mohawk Trail Regional School District 2017 State of District Address
COLLEGE ENTRANCE EXAMS SAT - Math 2011-2012 2012-2013 2013-2014 2014-2015 2015-2016 5-YR AVG Mohawk 534 521 528 532 546 532 State 524 522 523 521 522 522
SAT - Mathematics 600
•Mohawk students scored on average 10 points higher than the State on the SAT Math test over the past 5 years
500
400
Mohawk
300
State
200
100
0 2011-2012
2012-2013
2013-2014
2014-2015
2015-2016
5-YR AVG
Mohawk Trail Regional School District 2017 State of District Address
PLANS OF GRADUATES
• Approximately 80% of Mohawk graduates attend 4-year or 2-year colleges
Mohawk Trail Regional School District 2017 State of District Address
COLLEGES ATTENDED – RECENT CLASSES American Inter. College* Babson College Bridgewater State Univ.* Bryant College* Campbell University Castleton State College Cazenovia College Clark University* Coastal Carolina Univ. Colby Sawyer College College of the Holy Cross Curry College Emmanuel College* Endicott College Fairleigh Dickinson Univ.* Franklin Pierce University* George Washington University*
Gordon College* Greenfield Community College* High Point University St. Holyoke Community College Keene State College* Lasell College* MA College of Pharm. & Health Sciences MA. College of Liberal Arts Macalester College Marymount Manhattan College Mount Holyoke* Northeastern University Oberlin College Occidental College Roanoke College* Rochester Institute of Technology* Smith College
Southern Connecticut State* Springfield Tech* St. Lawrence University Syracuse University U. of Advancing Technology U. of Colorado-Boulder* UMass Amherst* UMass Lowell Unity College University of Maine University of New England* University of Tampa University of Vermont Westfield State University* Wheaton College Wheelock College
•Colleges attended by graduates of class of 2017 marked with *
Mohawk Trail Regional School District 2017 State of District Address
FINANCES
Mohawk Trail Regional School District 2017 State of District Address
10-YEAR BUDGET HISTORY $20,000,001 $18,000,001
0.8%
1.7% -6.9%
0.1%
FY11
FY12
2.5%
1.3%
FY13
FY14
2.1%
3.6%
3.3%
2.5%
$16,000,001 $14,000,001 $12,000,001 $10,000,001 $8,000,001 $6,000,001 $4,000,001 $2,000,001 $1 FY09
•
FY10
FY15
FY16
FY17
Average annual increase since FY11 is 2.3%
FY18
Mohawk Trail Regional School District 2017 State of District Address
PER PUPIL EXPENDITURES Mohawk State
FY12 FY13 FY14 FY15 FY16 5-Yr Avg $ 15,136 $ 16,273 $ 16,883 $ 17,492 $ 17,171 $ 16,591 $ 13,637 $ 14,023 $ 14,521 $ 14,942 $ 15,545 $ 14,534
Per Pupil Expenditures $20,000 $18,000 $16,000 $14,000 $12,000 $10,000 $8,000 $6,000 $4,000 $2,000 $FY12
FY13
FY14 Mohawk
•
FY15
FY16
5-Yr Avg
State
Mohawk spends approx. $2,000 more per pupil than State average
Mohawk Trail Regional School District 2017 State of District Address
TRANSPORTATION COSTS
Mohawk Trail Regional School District 2017 State of District Address
CHAPTER 70 HISTORY $7,000,000 $6,000,000 $5,603,580
$5,992,114
$5,000,000 $4,000,000 $3,000,000 $2,000,000 $1,000,000
$FY09 FY10 FY11 FY12 FY13 FY14 FY15 FY16 FY17 FY18
•
Average annual increase over past 10 years is 0.8%
Mohawk Trail Regional School District 2017 State of District Address
REVOLVING ACCOUNT HISTORY $1,400,000 $1,271,754 $1,200,000 $1,000,000 $862,318 $800,000 $600,000 $400,000 $256,667 $200,000 $FY09
•
FY10
FY11
FY12
FY13
FY14
FY15
FY16
FY17
FY18
Average annual use of revolving funds over past 10 years $923,823
Mohawk Trail Regional School District 2017 State of District Address
ASSESSMENT HISTORY $12,000,000
$11,161,022
$10,000,000
$8,988,455
$8,988,455
$8,000,000
$6,000,000
$4,000,000
$2,000,000
$FY09
•
FY10
FY11
FY12
FY13
FY14
FY15
FY16
FY17
FY18
Average annual increase since low in FY13 is 3.9%
Mohawk Trail Regional School District 2017 State of District Address
SCHOOL CHOICE HISTORY Choice-In
Choice-Out Net Revenue
FY Tuition
Students
Tuition
Students
2017
95.7
$740,798
98.3
$811,643 $
(70,845)
2016
90.3
$664,959
73.8
$738,107 $
(73,148)
2015
74.0
$500,473
71.6
$645,224 $
(144,751)
2014
83.0
$527,926
80.2
$ 510,331 $
17,595
2013
87.0
$ 547,050
63.2
$ 348,213 $
198,837
2012
86.0
$ 533,355
69.1
$ 355,857 $
177,498
2011
92.0
$ 588,282
69.1
$ 363,544 $
224,738
2010
99.0
$ 667,734
69.7
$ 376,156 $
291,578
2009
77.8
$ 530,563
60.9
$ 344,699 $
185,864
2008
71.6
$ 418,123
70.8
$ 382,087 $
36,036
• 30 Heath students tuitioned
to Hawlemont following closure of Heath Elementary • Otherwise choice-out would
have dropped to 68.3 • 10-year choice-out average would be 69.7
•Choice-in over past 10 years averaged 85.6 students •Choice-out over past 10 years averaged 72.7 students
Approx. 15 student net positive annually
Mohawk Trail Regional School District 2017 State of District Address
CHARTER SCHOOL HISTORY Students
Charge
Reimbursement Net Expense % Increase
FY17
50.5
$826,102
$
129,365
$
696,737
9%
FY16
51.2
$724,253
$
83,187
$
641,066
2%
FY15
44.2
$678,588
$
50,739
$
627,849
22%
FY14
45.7
$661,314
$
145,651
$
515,663
-5%
FY13
45.0
$617,039
$
71,956
$
545,083
12%
FY12
46.6
$632,961
$
146,643
$
486,318
24%
FY11
46.3
$537,243
$
146,278
$
390,965
10%
FY10
38.5
$471,024
$
114,197
$
356,827
11%
FY09
43.6
$503,109
$
181,157
$
321,952
2%
FY08
39.0
$ 425,971 $
110,193
$
315,778
43%
•Charter net expenses over past 10 years have increased 13.4%
Mohawk Trail Regional School District 2017 State of District Address
LOCAL ENROLLMENT LOCAL ENROLLMENT FROM FY08 - FY17 Local School 8,963
Private Vocational School School 946 868
Out-of District 804
Home School 466
Charter Collaborati School ves 447 12
Total 12,506
Local Enrollment FY08-FY17 10,000 9,000 8,000 7,000 6,000 5,000 4,000 3,000 2,000 1,000 -
71.7%
7.6%
7.0%
6.3%
3.7%
3.6%
0.1%
Mohawk Trail Regional School District 2017 State of District Address
FUTURE DIRECTION
Mohawk Trail Regional School District 2017 State of District Address
DISTRICT IMPROVEMENT PLAN
• MA DESE District Standards and Indicators 1. Leadership and Governance 2. Curriculum and Instruction 3. Assessment 4. Human Resources and Professional Development 5. Student Support 6. Financial and Asset Management
Mohawk Trail Regional School District 2017 State of District Address
DISTRICT IMPROVEMENT PLAN Previous Approach
District Standards and Indicators
Current Approach
Vision
Leadership and Governance
Strategies
Curriculum and Instruction
Strategies
Assessment
Strategies
Human Resources & Prof. Dev.
Strategies
Student Support
Strategies
Financial & Asset Management
Strategies
Strategic Objectives
Mission
Strategic Objectives Strategic Objectives
Strategies
Leadership and Governance
Initiatives
Curriculum and Instruction
Strategies Initiatives
District Standards and Indicators
Assessment Human Resources & Prof. Dev.
Strategies
Student Support
Initiatives
Financial & Asset Management
Mohawk Trail Regional School District 2017 State of District Address
DISTRICT IMPROVEMENT PLAN •
Vision: The Mohawk District is a community of happy and flourishing students who embrace diversity, have a passion for lifelong learning, and become responsible, engaged citizens.
•
Mission: The Mohawk District will cultivate a student-centered learning environment where inspiring educators create engaging educational experiences while encouraging collaboration and creative problem solving.
•
STRATEGIC OBJECTIVES 1. Provide an engaging, rigorous student-centered learning environment 2. Provide systems and practices to increase student access and opportunity 3. Develop and implement a system of assessments that supports engaging learning and instructional practices
Mohawk Trail Regional School District 2017 State of District Address
DISTRICT IMPROVEMENT PLAN STRATEGIC OBJECTIVES Strategies
Initiatives
Strategies
Initiatives
Strategies
1.Provide an engaging, rigorous student-centered learning environment •
Inquiry-based curriculum
•
Interdisciplinary unit design
•
Social emotional curriculum
2.Provide systems and practices to increase student access and opportunity •
Access and equity
•
Technology integration
•
Supportive school culture
3.Develop and implement a system of assessments that supports engaging learning and instructional practices •
Classroom-based formative assessments, progress monitoring and summative assessments; student self-assessment
Initiatives
•
Curriculum-embedded performance assessments
•
District-wide data analyses
Mohawk Trail Regional School District 2017 State of District Address
QUESTIONS & DISCUSSION
Presented by: Michael A. Buoniconti Superintendent of Schools Mohawk Trail Regional School District December 6, 2017