言語研究(Gengo Kenkyu)139: 1–27(2011)
1
Real-Time Demonstration of the Interaction among Internal and External Factors in Language Change: A Corpus Study Shin-ichiro Sano International Christian University Abstract: This research examines the interaction among internal and external factors in light of the interaction hypothesis, which assumes that, in language variation and change, internal factors are mutually independent, internal factors and external factors are also mutually independent, while external factors are interrelated. Thus far, there has been no exhaustive examination of the hypothesis based on the enormous amount of spontaneous speech in large-scale corpora, and interactions in the initial phases of language change have been underresearched. I therefore conducted a multivariate statistical examination of interactions of this kind focusing on recent language changes in Japanese verb forms (sa-Insertion, ra-Deletion, and re-Insertion) by making complementary use of two large-scale corpora: the on-line full-text database of the minutes of the Diet and the Corpus of Spontaneous Japanese. The results partially support the interaction hypothesis in the sense that the independence between internal and external factors is maintained consistently. On the other hand, some interactions between factors are observed, and the predicted interaction between external factors is not observed in one case. The fact that interactions between internal and external factors is never attested is indicative of a clear-cut division between the two in their roles governing language variation and change. Based on the results, I propose a revised interaction hypothesis, which assumes the existence of intracategorial interaction and the nonexistence of inter-categorial interaction among internal and external factors.* Key words: language change, internal factor, external factor, interaction, corpus
1. Introduction This research addresses a long-standing issue in the variationist approach (Labov 1963 et seq., Weinreich et al. 1968), namely, the interactions among internal factors (linguistic factors) and external factors (social factors) in language variation and change. In language variation and change, the distribution of variants is governed by various internal and external factors. While governing language variation and * I would like to thank Kenjiro Matsuda, Junko Hibiya, Frank Scott Howell, and Timothy Vance for their help and support in preparing this and an earlier version of this paper. Special thanks go to three anonymous reviewers for their invaluable comments. Any remaining faults are, of course, mine.
2
Shin-ichiro Sano
change, the factors themselves interact with each other in an intricate way. With respect to interactions of this kind, it has traditionally been assumed that internal factors are mutually independent, in other words, that there is no significant interaction among internal factors. Internal factors and external factors are also assumed to be mutually independent, while external factors are assumed to be interrelated (Labov 1982). Although this hypothesis (henceforth called the interaction hypothesis) has been supported by a number of studies (Sankoff & Labov 1979, Labov 1982, Weiner & Labov 1983, among others),¹ there has been no exhaustive examination of the hypothesis based on the vast quantities of spontaneous speech in large-scale corpora, and interactions in the initial phase of a language change have been underresearched. With this background, I examine the interaction hypothesis by means of the complementary use of two large-scale corpora of Japanese and multivariate statistical techniques, focusing on three ongoing changes in Japanese verb forms: sa-Insertion, ra-Deletion, and re-Insertion. Sa-Insertion adds an extra -as- to the causative morpheme, as in yar-as-aseru vis-à-vis the standard yar-ase-ru ‘let someone do,’ yielding a double causative construction (Okada 2003, Sano 2009, among others). Ra-Deletion deletes -ra- in the potential morpheme, as in mi-re-ru vis-à-vis the standard mi-rare-ru ‘can see’ (Matsuda 1993; Inoue 1998; Kinsui 2003, and others). Re-Insertion is similar to sa-Insertion, adding an extra -re- to the potential morpheme, as in ik-e-re-ru visà-vis the standard ik-e-ru ‘can go,’ yielding a double potential construction (Shin 2004, among others). I employ two large-scale Japanese corpora: the on-line full-text database of the minutes of the Diet (Matsuda 2004; henceforth Diet database), which is characterized by its large-scale, ranging from the first Diet (May, 1947) to the present, and the Corpus of Spontaneous Japanese (Maekawa 2004; henceforth CSJ), which has rich annotations concerning external factors such as speaker attributes and speech style. I take advantage of the complementary strong points of each corpus. This paper is organized as follows. First, Section 2 identifies the three ongoing changes with reference to previous studies, and then introduces the corpora. Section 3 illustrates the procedure I follow throughout this research. Section 4 summarizes the data collected. In Section 5, I discuss the interaction hypothesis in light of the results of the multivariate analysis. Finally, Section 6 concludes the discussion. 2. Background 2.1. The variable phenomena In this section, I introduce the properties of each of the three variable phenomena which I focus on throughout this research, with reference to previous studies. In addition, I define the envelope of variation, that is, I classify what is identified as
¹ As a counterexample to the hypothesis, the development of centralized ay and aw in Martha’s Vineyard (Labov 1963) shows an interaction between internal factors and external factors.
Real-Time Demonstration of the Interaction among Internal and External Factors in Language Change
3
each variant and what is not. I first introduce sa-Insertion, then ra-Deletion, and finally re-Insertion. 2.1.1. Sa-Insertion Sa-Insertion is a variable phenomenon in Japanese causatives. Japanese causatives are formed by attaching causative suffixes to verb stems. The traditional variant of the causative for a consonant verb (henceforth, sa-TV) comprises the verb stem and the causative suffix ase.² In contrast, sa-Insertion yields the innovative variant, which comprises the verb stem and both the causative suffixes as and ase. I present below some examples of sa-TV and sa-Insertion from the Diet database. sa-TV (1) hikooki-o mata tsukur-ase-ru. airplane-ACC again make-CAUS-NONP ‘We let (the company) make airplanes again.’ (2)
(3)
(Yoshio Namiki, Jun. 11 1952) iroirona enzetsu-o yar-ase-te-itadaita. various speech-ACC do-CAUS-TE-AUX.POL.PAST ‘I made various speeches.’ (polite) (Keigo Ouchi, Jun. 7 1994) gakkoo-ni ik-ase-nai. school-LOC go-CAUS-NEG.NONP ‘We allow (students) not to go to school.’ (Hiroko Mizushima, Feb. 27 2004)
sa-Insertion (4) tyoosa hookokusyo-o yom-as-ase-te-itadakimasita. investigation report-ACC read-CAUS-CAUS-TE-AUX.POL.PAST ‘I read the investigation report.’ (polite) (Seiichi Mizuno, Sep. 27 1995) (5) sitsumon-o owar-as-ase-te-itadakimasu. question-ACC finish-CAUS-CAUS-TE-AUX.POL.NONP ‘Let me finish my question.’ (Tatsuya Ito, Apr. 11 1997) (6) kono koosyoo-o torihakob-as-ase-tai. this negotiation-ACC advance-CAUS-CAUS-DES.NONP ‘I want to let (someone) advance this negotiation.’ (Sanzo Hosaka, Apr. 10 1998) As exemplified above, each sa-TV is formed by attaching ase to a verb stem, while in sa-Insertion both as and ase attach to a verb stem, instead of ase alone. Thus, saInsertion results in an extra syllable sa in causative forms, as opposed to sa-TVs.³
² The Japanese causative suffix shows morphophonemic alternation according to the type of verb stem: a consonant verb, which has a stem ending in a consonant, takes ase, as in yar-ase ‘let someone do,’ while a vowel verb, which has a stem ending in a vowel, takes sase, as in tabe-sase ‘let someone eat’. On the consonant verb/vowel verb distinction in Japanese verbs, see Bloch (1946). ³ Sa-Insertion takes its name from a phonological characteristic of Japanese. Japanese has an open-syllable sound pattern and in principle it does not allow codas. Thus, the
4
Shin-ichiro Sano
Sa-Insertion is restricted to consonant verbs. Sa-Insertion has thus far been analyzed on the basis of natural linguistic data, and some properties of sa-Insertion have become clear (Inoue 2003; Okada 2003; Sano 2008a, b, 2009, among others). Specifically, these previous studies point out that sa-Insertion (1) was first observed in 1947; (2) is an instance of language change in progress, and is currently in the beginning stage of the change; (3) does not produce the sequence sasa; (4) is in the course of grammaticalizing and creating the independent lexical item -as-ase-te-itadak-; (5) is restricted to short stem verbs; (6) shows variable distribution according to the type of verb; (7) tends to be preferred by male rather than female speakers; (8) is more compatible with stylistically formal settings. 2.1.2. Ra-Deletion Ra-Deletion is a variable phenomenon in Japanese potentials. Japanese potentials are formed by attaching potential suffixes to verb stems. The traditional variant of the potential for a vowel verb (henceforth, ra-TV) comprises the verb stem and the potential suffix rare.4 In contrast, ra-Deletion produces the innovative variant, which comprises the verb stem and the reduced form re of the potential suffix. The following examples of ra-TV and ra-Deletion are from the Diet database. ra-TV (7) sekitan-no haikyuu-o uke-rare-nai coal-GEN ration-ACC receive-POT-NEG.NONP ‘(I) cannot have a ration of coal.’ (Yoshio Sakurauchi, Aug. 29 1947) (8) sitsumon-o tsuzuke-rare-masen interpellation-ACC continue-POT-POL.NEG.NONP ‘(I) cannot continue the interpellation.’ (Keiichi Ishii, Oct. 26 1995) (9) syoohisya-ga ansinsite gyuuniku-o tabe-rare customer-NOM with assurance beef-ACC eat-POT ‘Customers can eat the beef with assurance, and…’ (Sota Iwamoto, Mar. 28 2002) ra-Deletion (10) nam-pun-de ko-re-masu-ka? how many-minute-in come-POT-POL.NONP-Qpart ‘In how many minutes, can (you) come?’ (Akira Kuroyanagi, Mar. 28 1980)
sequence yar-as-ase is pronounced with CV structure: ya.ra.sa.se. This results in the auditory perception of an extra sa rather than as. However, morphosyntactic investigation has revealed that sa-Insertion involves an extra causative suffix as (e.g. Okada 2003), and the difference between sa-TV and sa-Insertion cannot simply be attributed to phonology. 4 The Japanese potential suffix also shows morphophonemic alternation according to the type of verb stem: a consonant verb takes e, as in yar-e ‘can do’, while a vowel verb takes rare, as in tabe-rare ‘can eat.’
Real-Time Demonstration of the Interaction among Internal and External Factors in Language Change
(11) onazi mono-sika mi-re-nai same thing-only see-POT-NEG.NONP ‘(I) can see only the same thing.’ (12) ne-re-ru-yoona zyootai sleep-POT-NONP-like condition ‘Condition where (I) can sleep.’
5
(Shozo Azuma, May 29 2002)
(Akira Koike, Mar. 15 2007)
As exemplified above, each ra-TV is formed by attaching rare to a verb stem, while in ra-Deletion re appears instead of rare. This is the crucial difference between the two variants. Ra-Deletion is restricted to vowel verbs. There are a number of extensive studies on ra-Deletion from various linguistic perspectives (Nakamura 1953, Kanda 1964, Shibuya 1990, Matsuda 1993, Inoue 1998, Kinsui 2003, and others). These previous studies show that ra-Deletion (1) was first observed at the end of the 19th century; (2) is more compatible with the affirmative contexts than with negative contexts; (3) is restricted to short stem verbs; (4) does not occur in compound verbs, auxiliary verbs, and causative verbs; (5) is more frequent in main clauses than in subordinate clauses; (6) is more compatible with verb stems that end in i than with verb stems that end in e; (7) is preferred by younger speakers; (8) is preferred by female speakers. 2.1.3. Re-Insertion Re-Insertion is a variable phenomenon in Japanese potential forms, including forms that have undergone ra-Deletion (Shioda 2000, Inoue and Yarimizu 2002). The traditional variant of the potential for a consonant verb or a vowel verb (henceforth, re-TV) comprises the verb stem and a potential suffix e, re, or rare. On the other hand, re-Insertion produces the innovative variant, which comprises a verb stem and two potential suffixes, e and re or two re’s. There is no verb-type restriction on the occurrence of re-Insertion: any verb (i.e., any potential form) can undergo re-Insertion.5 Therefore, I define the re-TV as the traditional potential form of a consonant verb, such as ik-e-ru ‘can go,’ the traditional potential form of a vowel verb, such as mi-rare-ru ‘can see’, or the ra-Deletion form of a vowel verb, such as mi-re-ru ‘can see.’ Some examples of re-TV and re-Insertion from the CSJ are shown below. re-TV (13) kaigairyokoo-mo international travel-also
ik-e-ru go-POT-NONP
5 Although a reviewer pointed out that it is questionable whether we should regard vowelstem and consonant-stem re-Insertions as the same type of phenomenon, I regard both consonant verbs and vowel verbs as representing re-Insertion, based on the claims that reInsertion is a double potential and that the change of re-Insertion started with consonant verbs, later diffusing to vowel verbs (Inoue and Yarimizu 2002, Shin 2004, and references cited therein).
6
Shin-ichiro Sano
‘(We) can go also for international travel.’ (A07F0908)6 (14) kodomo-tati-ga yorokonde uke-re-ru kyooiku child-PL-NOM gratefully receive-POT-NONP education ‘The education that children receive gratefully’ (S06M0846) (15) ongaku-o kika-nai seikatsu-wa kangae-rare-masen music-ACC listen-NEG life-TOP think-POT-POL.NEG.NONP ‘Life, in which (I) do not listen to music, is unthinkable.’ (S07F0947) re-Insertion (16) soko-de sum-e-re-tara there-LOC live-POT-POT-COND ‘If (I) can live there.’ (17) subete zibun-de kime-re-re-ru everything oneself-by decide-POT-POT-NONP ‘(I) can decide everything by myself.’ (18) yuuzai-ni motteik-e-re-ru-yooni guilt-LOC bring-POT-POT-NONP-in order to ‘In order to be able to incriminate (the suspect).’
(S03M0570)
(S08M1255)
(S04M1512)
In the examples above, re-TV is formed by attaching e, re, or rare to a verb stem, while in re-Insertion both e and re or two re’s attach to a verb stem, instead of e alone. Thus, a re-Insertion potential form differs from the corresponding re-TV potential form by containing an extra re. According to the reports on re-Insertion (Shioda 2000, Inoue and Yarimizu 2002, Shin 2004, among others), (1) re-Insertion was first reported in the published literature in 1996; (2) re-Insertion started with consonant verbs and has diffused to vowel verbs; (3) a re-Insertion form has an enhanced potential meaning; (4) the spread of ra-Deletion triggered the change of re-Insertion through the generalization of the suffix re; (5) re-Insertion is more frequent in short stem verbs than in long stem verbs; (6) re-Insertion is less frequent when the base to which it would attach ends in re, as in tore-ru ‘come off ’ and potential mi-re-ru ‘can see.’ 2.2. Corpora In the present analysis, I make complementary use of two large-scale corpora: the Diet database and CSJ. In Section 2.2.1., I explain the properties of the Diet database, and in Section 2.2.2., those of CSJ. In Section 2.3., I discuss the advantages of the complementary use of the two corpora.
6 The alphanumeric character at the end of each example (S03M0570) is the ‘speech ID’ which is used as the index of each sample. In each speech ID, the leading character ‘A’ indicates that the sample in question is classified as academic presentation speech (APS). ‘S’ indicates simulated public speaking (SPS), ‘R’ readings, ‘D’ dialogs, and ‘M’ others. The letter in the middle, ‘M’ or ‘F’, indicates whether the speaker is male or female.
Real-Time Demonstration of the Interaction among Internal and External Factors in Language Change
7
2.2.1. Diet database The Diet database is a free on-line database in which the computerized equivalent of the minutes of the Diet is recorded.7,8 The Diet database is primarily characterized by its scale: it includes all utterances of the members in all sessions and committees from the first Diet held in May, 1947, to the present, which amounts to a total of 3.5 billion characters. (It continues to be updated.) The Diet database has no equals with respect to scale among domestic or international corpora, including corpora created for linguistic purposes. The Diet database provides a huge amount of synchronic as well as diachronic data, which would be impossible to obtain through individual work. This is the greatest benefit of using the Diet database for usage-based analysis. Additionally, each speaker (i.e., each member of the Diet) is from a particular region of Japan. This property allows for the analysis of dialectal differences. However, the Diet database was originally designed for political purposes and not for linguistic purposes. Therefore, there are no audio data annotations, no tags indicating things such as part of speech, and no information on attributes of the speakers. Thus, phonetic (acoustic) analysis is impossible, and data extraction from the Diet database involves an immense amount of time and effort compared to what an annotated corpus would require. I should also mention the weaknesses of this database for linguistic analysis that result from the characteristics of the Diet. First, the style in the Diet tends to be formal, and the kinds of utterances that occur in informal settings such as daily conversation are unlikely. Second, the great majority of the members of the Diet are male. Thus, the Diet database is not appropriate for examining the roles of style or gender. Most importantly, the Diet database applies a “correction policy” to the transcription, which means that disfluent phenomena such as slips of the tongue and inappropriate expressions such as jeers are deleted in transcribing the original text. Unfortunately, some examples of non-standard forms, including innovative forms, are also subject to the correction policy (Matsuda et al. 2008).9 Therefore, the analysis of some phenomena is impossible.
7 The Diet of Japan has plenary sessions and committee meetings. The committees are further divided into permanent committees of each Ministry and select committees. Each member of the Diet belongs to either the House of Councilors or the House of Representatives (Oyama 2003). 8 A reviewer pointed out that, in the Diet database, the electronic data from the 1st to the 144th Diet meetings is based on photographic images of the original transcription, and accordingly there is a possibility of some typographical errors and omissions. 9 A reviewer pointed out the following possibility: among the non-standard forms, some forms were subject to the correction policy in the 1940s; however, these forms have become exempt from the policy in the 1990s, since they had already become established as standard forms. As an example, it was not until around 2000 that ra-Deletion forms were accepted in the Diet database and became exempt from the correction policy (Matsuda 2008). Thus, there may have been inconsistencies with respect to the application of the correction policy. In other words, it is possible that ideas about what needs correction have been changing.
8
Shin-ichiro Sano
2.2.2. CSJ CSJ is a large-scale spontaneous speech corpus of common Japanese with rich annotation. CSJ consists of 662 hours of speech, amounting to 7.5 million words, collected from 3,302 samples by 1,417 speakers. Most of the samples are spontaneous monologues. These monologues are classified into two types: “Academic Presentation Speech (APS)” and “Simulated Public Speaking (SPS).” APS samples are live recordings of academic presentations at meetings of various academic societies. SPS samples, on the other hand, are general remarks or comments by laypeople on everyday topics like “a joyful memory in my life,” “the town I live in,” “commentary on recent news” and so on. Most APS and SPS samples are 10–15 minutes long. In general, APS samples are characterized by a stiff, formal speaking style, whereas SPS samples are characterized by a casual and informal style. Each APS and SPS sample actually has a different style or degree of spontaneity on account of each speaker’s attitude. One of the important features of CSJ is its rich annotation. Every sample is transcribed in two formats: orthographic transcription and phonetic transcription. The former uses ordinary Japanese orthography, but it includes disfluent phenomena such as fillers and word fragments. The latter uses only kana (the Japanese syllabary) and represents pronunciation as faithfully as this system allows. Part-of-speech information is appended to the orthographic transcription. Various phonetic events such as vowel lengthening and non-verbal events such as laughing are included in the phonetic transcription. We can retrieve a particular word accurately from the orthographic transcription, and we can examine how the word was actually pronounced by using the phonetic transcription. CSJ is also accompanied by the audio data. A part of CSJ, called the Core, which consists of almost 500,000 words, contains much more detailed annotations: manually annotated part-ofspeech information, clause boundary labels, discourse boundary labels and so on. The boundaries of a “clause unit,” which is a syntactic unit originally designed for CSJ, are also annotated. Another important type of information in the corpus is called “impressionistic rating data,” which is based on psychological reactions. One of the recording staff members subjectively evaluated the speech during the recording. Spontaneity, speed, articulatory clarity, style and so were graded on fivepoint scales, and the results are provided for each sample (Maekawa 2004). We can use such impressionistic rating data as criteria for estimating the characteristics of each sample. Thus, the fine-grained annotation of CSJ facilitates analysis concerning external factors. 2.3. Advantages of the complementary use of the two corpora Here I mention the advantages of employing the two corpora in complementary fashion. As described above, both corpora have a number of strengths along with some limitations. The large-scale of the Diet database allows long-term analysis of a certain phenomenon. In addition, the Diet database allows relatively easy observation of even infrequent linguistic phenomena which we seldom encounter in spontaneous speech. This property is significant especially for the analysis of
Real-Time Demonstration of the Interaction among Internal and External Factors in Language Change
9
language changes that are just beginning; if we cannot collect enough data, it is impossible even to conduct an analysis, much less ensure accuracy. The Diet database also makes real-time studies possible without an immense amount of time and effort, because we can focus on members with long tenure (decades in some cases). On the other hand, the style of the Diet is generally formal, so the Diet database does not include utterances in informal settings that can be compared to those in formal settings. Moreover, since male members are predominant in the Diet, there is a lack of utterances by female speakers. Thus, the nature of the Diet precludes analysis of style or gender; it is impossible to ensure that there will be enough data to discover stylistic and gender differences. Finally, the correction policy sometimes becomes a serious obstacle in conducting analysis. The fine-grained annotation of CSJ facilitates and enriches the analysis. The detailed transcriptions and various labels (such as the part-of-speech labels), coupled with the GREP command in computer languages, reduce the cost of data mining. Phonetic (acoustic) analysis is also relatively easy. The distinction between APS and SPS, and information such as the impressionistic rating data, facilitate exhaustive analysis of external factors such as style and gender. CSJ was designed to have a balance of male and female speakers, although males are predominant in APS. In addition, analysis involving dialect differences and SEC (socio-economic class) is also possible thanks to the detailed information about speaker attributes. Unlike the Diet database, no correction policy was applied to CSJ. On the other hand, the size of the corpus is relatively small for exhaustive research on the phenomena under study here, even though it is considered a large-scale corpus. CSJ does not include long-term follow-up recordings of each speaker. Therefore, CSJ is not appropriate for long-term analysis and real-time analysis of the phenomena. I summarize the features of Diet database and CSJ below. Table 1. Features of Diet database and CSJ feature
Diet database
CSJ
Scale Real-time study Style Gender Correction policy Audio data Dialect differences Data mining Annotation Speaker attributes
large + formal male + − controllable search system − −
small − balanced balanced (except for APS) − + controllable GREP using transcriptions and labels rich +
The table shows that an analysis employing only one of the corpora is insufficient for exhaustive research. This in turn means that the problem can be solved by integrating the strengths and compensating for the limitations of each corpus (a “divi-
10
Shin-ichiro Sano
sion of roles”). For example, I conduct the long-term analysis by using the Diet database and examine the stylistic and gender differences by using CSJ. Thus, by employing two large-scale corpora in complementary fashion I can cover a broad range of factors that might govern language variation and change. By keeping all these strengths and limitations in mind, we can conduct more advanced linguistic research. 3. Procedure In this section, I describe the procedures for the data extraction. In the analysis using the Diet database, I focus on the Tokyo dialect and ignore other dialects of Japan. Based on the list of members of the Diet provided by Nambu (2005), I sampled 81 of the 190 members of the Diet who come from Tokyo (dialect control). The scope of the present research includes all of their utterances from the entire time period. In order to examine chronological changes in the distribution of each variant, I selected members from Tokyo by birth year, taking one member born in each available year. The present research targets the utterances from May 20, 1947, to February 29, 2008 (from the first Diet to the 169th Diet). The members and the time period are the same for all of the variable phenomena under study. In the analysis employing CSJ, I use all 3,302 spontaneous samples, including the Core and Noncore: Monologues, i.e., APS (A) and SPS (S), Readings (R), Dialogues (D), and others (M). The samples are the same for all of the variable phenomena under study. For the extraction of data from the Diet database, I first conducted stringbased searches, using the search system that comes with the Diet database. Subsequently, I examined the extracted data manually with reference to the contexts, since a string-based search can retrieve irrelevant examples, which just happen to coincide with the search strings, in addition to the examples that are the target of the present research. For the manual examination, I set several criteria for each phenomenon (Section 3.1). For the extraction of data from CSJ, I applied a similar procedure, conducting string-based searches (without regular expressions and part-of-speech information) according to the phonetic transcription in TRN files. In order to cover all the logically possible patterns of innovative and traditional variants, I chose the following search strings for each variant.
Real-Time Demonstration of the Interaction among Internal and External Factors in Language Change
11
Table 2. Search strings for each variant¹0,¹¹ ¹0,¹¹ variant
strings Diet database
sa-Insertion asase, kasase, sasase, tasase, nasase, hasase, masase, yasase, rasase, wasase, gasase, zasase, dasase, basase sa-TV ase, kase, sase, tase, nase, hase, mase, yase, rase, wase, gase, zase, dase, base ra-Deletion 32 verb stems/3 phrases + re ra-TV 32 verb stems/3 phrases + rare re-Insertion ere, kere, sere, tere, nere, here, mere, rere, gere, zere, dere, bere re-TV NA (no re-Insertion observed) CSJ sa-Insertion asase, kasase, sasase, tasase, nasase, hasase, masase, yasase, rasase, wasase, gasase, zasase, dasase, basase sa-TV ase, kase, sase, tase, nase, hase, mase, yase, rase, wase, gase, zase, dase, base ra-Deletion ire, kire, sire, tire, nire, hire, mire, rire, gire, zire, dire, bire (for i-stem verbs), ere, kere, sere, tere, nere, here, mere, rere, gere, zere, dere, bere (for e-stem verbs), kore (for k-irregular verb) ra-TV rare11 re-Insertion ere, kere, sere, tere, nere, here, mere, rere, gere, zere, dere, bere re-TV verb stems observed in re-Insertion + potential suffix, such as ik-e ‘can go,’ das-e ‘can give/let out,’ sum-e ‘can live’
Section 3.1 describes the criteria for manual examination for each variant. Section 3.2 describes the factors I focus on throughout the analysis.
¹0 For the ra-Deletion data extraction, I referred to the verb list in Matsuda (2008: 118): azuke-ru ‘deposit,’ kotae-ru ‘answer,’ osie-ru ‘teach,’ atae-ru ‘give,’ ku-ru ‘come,’ sake-ru ‘avoid,’ de-ru ‘come out,’ mi-ru ‘see,’ sinji-ru ‘believe,’ hajime-ru ‘begin,’ nage-ru ‘throw,’ sute-ru ‘throw away,’ iki-ru ‘live,’ ne-ru ‘sleep,’ tabe-ru ‘eat,’ kake-ru ‘put on/impose,’ nige-ru ‘flee,’ tae-ru ‘endure,’ kari-ru ‘borrow,’ nose-ru ‘list,’ tsuduke-ru ‘continue,’ ki-ru ‘wear,’ oboe-ru memorize,’ uke-ru ‘receive,’ kime-ru ‘decide,’ oki-ru ‘arise,’ ume-ru ‘fill,’ koe-ru ‘cross over,’ ori-ru ‘get off,’ yame-ru ‘quit.’ I also focused on two additional verbs (ire-ru ‘insert,’ hanare-ru ‘get away’) and three other types of items: noun + main verb sase (verbal noun) + potential suffix, as in benkyoo-sase-rare ‘be caused to study,’ transitive verb + potential suffix, as in awase-rare ‘be caused to meet’, and verb + causative suffix + potential suffix, as in uke-sase-rare ‘be caused to receive.’ Thus, the targets for the extraction of ra-Deletion examples from the Diet database include 32 verbs and three other types of items. Additionally, Kenjiro Matsuda provided me with the raw data of the analysis in Matsuda (2008). ¹¹ In a pilot study, the total number of tokens of re-TVs exceeds 20,000, as opposed to 20 tokens of re-Insertion in CSJ, and this yields a rate of re-Insertion of less than 0.01 percent. Consequently, a rigorous and precise analysis of the distribution of re-Insertion and re-TVs according to the factors of interest is impossible. Therefore, I decided to extract re-TVs by limiting the target to verbs observed in re-Insertion. In other words, if a verb is not observed in re-Insertion, I do not include re-TV with that verb in the data.
12
Shin-ichiro Sano
3.1. Criteria This section introduces the criteria for manual examination of the extracted data. For the sake of precision, and also to allow for follow-up studies, it is necessary to define which forms are regarded as examples of, e.g., sa-Insertion/sa-TV (the envelope of variation), to define the range of the analysis, and to extract the data within that range. I first present the criteria for sa-Insertion, then for ra-Deletion, and finally for re-Insertion. 3.1.1. Sa-Insertion I set the following six criteria for the examination of sa-Insertion. (1) Exclude causative forms of vowel verbs (e.g. mi-sase-ru ‘let someone see’, tabe-sase-ru ‘let someone eat’), since vowel verbs do not allow sa-Insertion, and limit the target to causative forms of consonant verbs. (2) Exclude idiomatic expressions functioning as single units, such as iyagarase ‘offence’ and mekubase ‘wink,’ since these words are grammatically categorized as nouns (verbal nouns). (3) Exclude sequences of a noun followed by the main verb sase ‘let someone do something,’ such as happyoosase-ru ‘let someone announce’ and setsumei-sase-ru ‘let someone explain,’ and limit the target to sequences of a verb stem followed by the causative suffix sase. (4) Exclude potential forms such as haras-e-ru ‘can clear’ and arawas-e-ru ‘can express’, which are phonologically similar to causative forms such as yar-ase-ru ‘let someone do something’ and hair-ase-ru ‘let someone enter’. (5) Exclude transitive verbs that are phonologically similar to causatives, such as awase-ru ‘let someone meet/put something together’ and sirase-ru ‘inform’. (6) Carefully distinguish sa-Insertion from sa-TV with reference to the context, since some forms can be analyzed as either sa-Insertion or sa-TV, such as tob-as-ase ‘let someone fly’ (saInsertion) or tobas-ase (sa-TV). 3.1.2. Ra-Deletion I set the following four criteria for the examination of ra-Deletion. (1) Exclude potential forms of consonant verbs (e.g. hasir-e-ru ‘can run’, kak-e-ru ‘can write’), since consonant verbs cannot undergo ra-Deletion, and limit the target to potential forms of vowel verbs. (2) Exclude ‘conditional’ forms such as mi-reba ‘if (I) see,’ tabe-reba ‘if (I) eat,’ which are phonologically similar to examples of ra-Deletion such as mi-re-ru ‘can see’ and tabe-re-ru ‘can eat’. (3) Exclude vowel verb stems ending in re such as kire-ru ‘go off ’ and tore-ru ‘come off ’ for the same reason as in (2). (4) Limit the target to potential meaning, because the meaning of ra-Deletion forms is restricted to potential, although the suffix rare carries any one of four meanings (passive, honorific, potential, or spontaneous). 3.1.3. Re-Insertion Finally, I set four criteria for the examination of re-Insertion. (1) Exclude potential forms of verbs ending in e or er such as mise-re-ru ‘can show’ (ra-Deletion) and syaber-e-ru ‘can speak,’ which are phonologically similar to actual cases of reInsertion such as ik-e-re-ru ‘can go’ and kak-e-re-ru ‘can write’. (2) Exclude ‘condi-
Real-Time Demonstration of the Interaction among Internal and External Factors in Language Change
13
tional’ forms of potentials based on consonant verbs, such as ik-e-reba ‘if (I) can go’ and kak-e-reba ‘if (I) can write’ for the same reason similar as in (1). (3) Exclude ‘conditional’ forms of ra-Deletion cases, such as kae-re-reba ‘If (I) can change’ and kanji-re-reba ‘If (I) can feel’ for the same reason as in (1) and (2). (4) Carefully distinguish causative forms from potential forms that are phonologically similar to causatives, such as haras-e-ru ‘can clear’ versus arawas-e-ru ‘can express’ precisely, and count the potential forms as examples of re-TV. 3.2. Factors This section introduces the factors I will examine in the analysis. The selection of each factor is based on linguistic motivation and on the claims of previous research. 3.2.1. Diet database As mentioned above, the Diet database has not been annotated to the same extent as CSJ with information that can be interpreted as external factors. The internal factors of interest, however, are identifiable even if we refer only to the transcription of the utterances, and the large-scale of the Diet database provides an enormous amount of data, which enables a fine-grained analysis of the phenomena. Therefore, I mainly focus on internal factors in the analysis of the Diet database. I selected three external and seven internal factors for statistical analysis. The external factors are birth year, Diet house (Representatives/Councilors) and type of the Diet meeting (plenary session/committee). Four of the internal factors involve preceding context: verb length (measured in moras), stem-final vowel (i-stem/estem), verb type (vowel verb/consonant verb), and morphological structure of the preceding stem (monomorphemic/complex). The other three internal factors are following context, affirmative/negative, and embeddedness (main/subordinate).¹² I examine the effects of these factors on each variable phenomenon. 3.2.2. CSJ From the annotations in CSJ, I selected nine external and seven internal factors for statistical analysis. The external factors are speech type (APS/SPS), gender, birth year, geographical difference, education, spontaneity, speech style, speech skill, and speech experience. Four of the internal factors involve preceding context: verb length (measured in moras), stem-final vowel (i-stem/e-stem), verb type (vowel verb/consonant verb), and morphological structure of the preceding stem (monomorphemic/complex). The other three internal factors are following context, affirmative/negative, and embeddedness (main/subordinate).¹³
¹² Following context includes the constituents immediately following causative/potential suffixes, such as -te-itadak- (benefactive pattern), -ru (plain present), and negative (e.g. -nai). As for embeddedness, if a variant is in a clause introduced by a complementizer such as to, ka, and koto, or is in a relative clause headed, for example, by mono, or is in some other NP, I classify the variant as “subordinate.” ¹³ The levels of the geographical difference factor are the following 11 areas: “Hokkaido,”
14
Shin-ichiro Sano
4. Summary of the Data In this section, I present the results of the data extraction. 4.1. Diet database An exhaustive examination of the Diet database yielded the results in Table 3 below. There are 352 causative forms with sa-Insertion, as opposed to 4,907 causative forms with sa-TV; thus, the rate of sa-Insertion (sa-Insertions/(sa-Insertions + sa-TVs) *100) is 6.69 percent. There are 95 potential forms with ra-Deletion, as opposed to 1,599 potential forms with ra-TVs; thus, the rate of ra-Deletion (raDeletions/(ra-Deletions + re-TVs) *100) is 5.61 percent. There are no example of re-Insertion. Table 3. Distribution of the three variable forms in the Diet database variant sa-Insertion sa-TV
frequency rate (%) 352 4,907
6.69
variant ra-Deletion ra-TV
frequency rate (%) 95 1,599
5.61
variant
frequency
re-Insertion re-TV
none —
Comparing the rate of ra-Deletion with that of sa-Insertion, we observe that the rate of ra-Deletion is relatively high (close to that of sa-Insertion), despite the fact that some examples of ra-Deletion have been deleted by the correction policy (Kenjiro Matsuda, personal communication; cf. Matsuda et al. 2008). This shows that ra-Deletion has advanced to a significant degree. I observed no examples of re-Insertion. This may again be due to the correction policy. Therefore, I exclude re-Insertion from the analysis using the Diet database. 4.2. CSJ For CSJ, an exhaustive examination yielded the results in Table 4. There are 42 causative forms with sa-Insertion, as opposed to 1,498 causative forms with sa-TV; thus, the rate of sa-Insertion is 2.73 percent. There are 543 potential forms with ra-Deletion, as opposed to 7,615 potential forms with ra-TVs; thus, the rate of ra-Deletion is 6.66 percent. There are 20 potential forms with re-Insertion, as opposed to 3,657 potential forms with re-TV; thus, the rate of re-Insertion is 0.54 percent. Among the three variables, the token frequency of ra-Deletion is very high, and the rate of ra-Deletion is also relatively high. This again shows that the ra-Deletion change is well under way. The token frequency of re-Insertion, conversely, is extremely low, and the rate of re-Insertion is quite low. The token frequency and the rate of sa-Insertion are in between.
“Tohoku,” “Kanto,” “Chubu,” “Kinki,” “Chugoku,” “Shikoku,” “Kyusyu,” “Okinawa,” and “Abroad,” which refer to the residence of each speaker. In CSJ, education, spontaneity, speech style, speech skill, and speech experience are evaluated by a four-level/five-level rating system.
Real-Time Demonstration of the Interaction among Internal and External Factors in Language Change
15
Table 4. Distribution of the three variable forms in CSJ variant
frequency rate (%)
sa-Insertion sa-TV
42 1,498
2.73
variant ra-Deletion ra-TV
frequency rate (%) 543 7,615
6.66
variant re-Insertion re-TV
frequency rate (%) 20 3,657
0.54
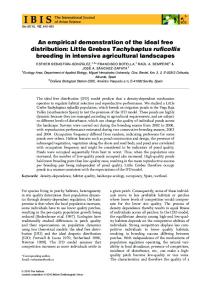
I will now discuss the chronological changes of the three variable forms. The chronological distribution of each of the innovative forms is shown in Figure 1, which shows the rates of each according to the birth years of the speakers (grouped every ten years).
Figure 1. Chronological changes of the three variable forms in CSJ¹4
As Figure 1 shows, the rate of ra-Deletion is consistently the highest, the rate of re-Insertion is the lowest, and the rate of sa-Insertion is intermediate, across every birth-year decade. In terms of the slope of each fitted line, the rate of ra-Deletion shows a steep ascent, the rate of re-Insertion shows a gradual one, and the rate of sa-Insertion is intermediate. On the assumption that changes spreads gradually and the rates of each innovative form reflect the degree of progression (the higher the rate of an innovative form, the more advanced the change), the order of the three changes would be ra-Deletion => sa-insertion => re-Insertion. This is consistent with the claims of
¹4 As a reviewer pointed out, there may be a strong connection between the sharp rise in the rate of ra-Deletion for the 1980s and the differences between APS and SPS. In APS, which is characterized by formal style, the speakers’ ages are relatively high; on the other hand, SPS, which is characterized by informal style, includes a high percentage of younger speakers. In fact, a large majority of data for the 1980s is observed in SPS. Also, ra-Deletion is more compatible with informal settings (e.g. SPS) than formal settings (Sano 2008a). It follows that ra-Deletion shows a higher rate for the 1980s.
16
Shin-ichiro Sano
previous studies: ra-Deletion was first observed at the end of the 19th century, saInsertion in 1947, and re-Insertion at the end of the 20th century. 5. Analysis In this section, I present the results of multivariate analyses of sa-Insertion, raDeletion and re-Insertion, and discuss the interaction of internal and external factors governing these changes, in light of the interaction hypothesis.¹5 Specifically, I conducted binominal logistic regression analyses; the dependent variable in each case was the choice of the innovative or traditional variant, and the independent variables (predictors) included internal and external factors (see Peng et al. 2002, Baayen 2008, and references therein). I employed the statistical software SPSS 15.0J for Windows (Ishimura 2005, and others). 5.1. Sa-Insertion 5.1.1. Diet database I show the results of the analysis of sa-Insertion in the Diet database below. First, I discuss the interaction among factors, based on the correlation matrix.¹6 Table 5. Correlation matrix for dependent variable and independent variables¹7 (sa-Insertion, Diet database) Constant House Birth Year Diet Verb Length Following Aff/Neg Constant
1.000
-.769
-1.000
.005
.104
.022
-.013
House
-.769
1.000
.768
-.017
-.128
.060
.012
-1.000
.768
1.000
-.007
-.115
-.045
.006
Diet
.005
-.017
-.007
1.000
-.024
.071
.010
Verb Length
.104
-.128
-.115
-.024
1.000
-.006
.003
Following
.022
.060
-.045
.071
-.006
1.000
.294
-.013
.012
.006
.010
.003
.294
1.000
Birth Year
Aff/Neg
¹5 In a pilot study, I examined the effects of each factor on the distribution of sa-Insertion, ra-Deletion and re-Insertion, and the properties of each variant governed by these factors independently. The selection of factors for the multivariate analysis was based on the results of the preliminary examination. However, I do not present a detailed discussion of this point due to space limitations. ¹6 I used Pearson product-moment correlations, and I regard 0.4 as the threshold for a correlation to be valid (cf. Matsubara 1996, Wakui and Wakui 2003, and references therein). ¹7 Due to limitations of space, I abbreviate some factors in the tables as follows: Diet house => “House”; type of Diet meeting => “Diet”; stem-final vowel of the verb => “i-stem/e-stem”; morphological structure of the preceding stem => “Mono/Complex”; following context => “Following”; affirmative/negative => “Aff/Neg”; geographical difference => “Geographical”; speech style => “Style”; speech skill => “Skill”; speech experience => “Experience.”
Real-Time Demonstration of the Interaction among Internal and External Factors in Language Change
17
If the interaction hypothesis is on the right track, it follows that the internal factors such as verb length, following context, and the affirmative/negative distinction are mutually independent, that internal factors and external factors (Diet house, birth year, and type of Diet meeting) are also mutually independent, and that only the external factors are interrelated. Looking at the results in Table 5, we observe that verb length, following context, and the affirmative/negative distinction are independent of each other,¹8 and that these factors do not show any significant correlation with Diet house, birth year, or type of Diet meeting. Each internal factor independently affects the distribution of sa-Insertion. On the other hand, Diet house and birth year are highly correlated (.768). Thus, the results bear out the independence among internal factors and between internal and external factors, as well as the dependence among external factors. I show the logistic regression results below in Table 6. Here, I examine the significance of the interactions observed in the table based on the P-values of the interaction terms. Table 6. Logistic regression results (sa-Insertion, Diet database)¹9 variables in the equation β House 89.893 Birth Year .054 Diet .501 Verb Length -.110 Following 3.345 Aff/Neg .121 House by Birth Year -.046 Constant -110.729
SE
Wald
d.f.
P-value
Exp(β)
18.212 .007 .431 .078 .328 1.053 .009 13.954
24.363 57.835 1.354 1.990 104.039 .013 24.803 62.967
1 1 1 1 1 1 1 1
.000 .000 .245 .158 .000 .909 .000 .000
1.10E+039 1.056 1.651 .896 28.365 1.128 .955 .000
-2 Log likelihood = 1984.957, Cox & Snell R2 = .108, Nagelkerke R2 = .277
¹8 Following context and the affirmative/negative distinction show a certain degree of correlation. This is because both of these refer to the same context: the following context of causative suffixes. Specifically, the negative context is a subset of a particular level in following context, and the affirmative context covers another level. Thus, the contexts of these two factors partly overlap. ¹9 I introduce some statistical terminology in Table 6. “β” indicates the regression coefficient, which represents the coefficients of each independent variable in the regression equation. “SE” refers to the standard error, which is the standard deviation in the estimated value (not in the observed data). “Wald” indicates the Wald statistic, which is the test statistic used for the determination of the significance of a regression coefficient in the Wald test. Based on the Wald statistic, the significance probability (P-value) in the sixth column is calculated. If the significance probability of a variable is less than .05, I regard the variable as significant. “Exp(β)” represents the odds ratio. A variable such as “House by Birth Year” is the interaction term which combines the variables showing the interaction. With the interaction term, we reflect the interaction of variables in the model. -2 Log likelihood, Cox & Snell R-Square and Nagelkerke R-Square indicate the fit of the constructed model (Goodness of Fit Index). For more information about statistical terminology, see Peng et al. (2002), Baayen (2008), among others.
18
Shin-ichiro Sano
As Table 6 shows, the interaction term for Diet house by birth year, which show a high correlation coefficient in Table 5, has a significant P-value (.000). This shows that these two factors do not play independent roles but contribute to the distribution of sa-Insertion in interaction with each other. Thus, the results support the interaction hypothesis. 5.1.2. CSJ Next, I turn to a discussion of the interaction among factors governing the distribution of sa-Insertion in CSJ. First, I show the correlation matrix below in Table 7. As the table shows, verb length and following context are mutually independent, and these factors do not show any significant correlation with any of the external factors. Each internal factor independently affects the distribution of sa-Insertion. On the other hand, speech type interacts with speech experience (-.539). These results show independence among internal factors and between internal and external factors but dependence among external factors, thus supporting the interaction hypothesis. Table 7. Correlation matrix for dependent variable and independent variables (sa-Insertion, CSJ) Constant Constant
Speech Verb FollowGender Type Length ing
1.000
.111
Speech Type
.111
Verb Length
-.315
Birth Year
ExpeGeoSpontaStyle Skill rience graphical neity
-.315
-.208
-.196
-.447
-.482
-.488
-.444
.063 -.068
1.000
-.022
-.117
-.310
-.216
-.022
1.000
.108
-.012
-.022
-.087
.318
-.297
.125 -.539
.000
-.019
-.036 -.010
.049
Following
-.208
-.117
.108
1.000
.022
.003
-.076
-.054
-.043 -.066
.067
Gender
-.196
-.310
-.012
.022
1.000
.060
-.041
-.012
.171 -.143
.054
Birth Year
-.447
-.216
-.022
.003
.060
1.000
-.038
.065
.028
.004
.239
Geographical
-.482
-.087
.000
-.076
-.041
-.038
1.000
-.081
.048 -.005
.047
Spontaneity
-.488
.318
-.019
-.054
-.012
.065
-.081
1.000
.277 -.043 -.239
Style
-.444
-.297
-.036
-.043
.171
.028
.048
.277
1.000 -.191 -.012
.063
.125
-.010
-.066
-.143
.004
-.005
-.043
-.191 1.000 -.250
-.068
-.539
.049
.067
.054
.239
.047
-.239
-.012 -.250 1.000
Skill Experience
I show the logistic regression results below. Although the interaction of speech experience by speech type, which shows a high correlation coefficient in Table 7, is not significant at the .05 level (0.093), the tendency is clear. These results show that these factors affect the distribution of sa-Insertion in interaction with each other, instead of playing independent roles. Thus, the results support the interaction hypothesis.
Real-Time Demonstration of the Interaction among Internal and External Factors in Language Change
19
Table 8. Logistic regression results (sa-Insertion, CSJ) variables in the equation Speech Type Verb Length Following Gender Birth Year Geographical Spontaneity Style Skill Experience Type by Gender Type by Experience Experience by Skill Style by Spontaneity Style by Type Type by Spontaneity Constant
β
SE
Wald
d.f.
P-value
Exp(β)
4.843 .185 2.608 1.932 .292 -.747 .643 .870 -.417 .511 -3.307 -1.544 1.339 -.208 -.809 -.066 -8.889
2.603 .321 .556 .672 .170 .329 .676 1.348 .591 .803 .942 .920 .940 .289 .742 .448 3.672
3.461 .331 21.964 8.258 2.957 5.144 .904 .417 .497 .405 12.319 2.818 2.028 .515 1.187 .022 5.859
1 1 1 1 1 1 1 1 1 1 1 1 1 1 1 1 1
.063 .565 .000 .004 .086 .023 .342 .519 .481 .525 .000 .093 .154 .473 .276 .883 .016
126.829 1.203 13.571 6.906 1.339 .474 1.902 2.388 .659 1.666 .037 .213 3.816 .812 .446 .936 .000
-2 Log likelihood = 234.052, Cox & Snell R2 = .050, Nagelkerke R2 = .251
5.2. Ra-Deletion 5.2.1. Diet database In this section, I present the results of the analysis of ra-Deletion in the Diet database. I begin with a discussion of the interactions among factors, based on the correlation matrix. Table 9. Correlation matrix for dependent variable and independent variables (ra-Deletion, Diet database) i-stem/ Mono/ Embede-stem Complex dedness
Constant
Birth House Diet Aff/Neg Verb Year Length
Constant
1.000
-.992
.075
-.015
-.054
.079
.076
-.020
-.060
Birth Year
-.992
1.000
-.091
.013
.021
-.182
-.142
-.079
.048
-.091 1.000
House
.069
.132
.108
.085
.017
-.015
Diet
-.015
.075
.013
.069 1.000
.031
.019
-.003
-.011
-.028
Aff/Neg
-.054
.021
.132
1.000
.219
.227
.045
-.041
.031
Verb Length
.079
-.182
.108
.019
.219
1.000
.631
.329
.013
i-stem/e-stem
.076
-.142
.085
-.003
.227
.631
1.000
.186
.046
Mono/Complex
-.020
-.079
.017
-.011
.045
.329
.186
1.000
.013
Embeddedness
-.060
.048
-.015
-.028
-.041
.013
.046
.013
1.000
20
Shin-ichiro Sano
In Table 9, an interaction among internal factors is observed, contrary to the interaction hypothesis: verb length by i-stem/e-stem shows a high correlation coefficient (.631). This shows that verb length interacts with the stem-final vowel of the verb. The other internal factors are mutually independent. The external factors (birth year, type of the Diet meeting, and Diet house) are also mutually independent, and these factors do not show any significant correlations with the internal factors. Thus, an interaction between internal factors is observed, but not between external factors or between internal and external factors. The independence between internal and external factors is maintained. I show the logistic regression results below. Table 10. Logistic regression results (ra-Deletion, Diet database) variables in the equation β Birth Year .025 House -1.635 Diet -1.538 Aff/Neg -1.215 Verb Length -4.368 i-stem/e-stem -4.445 Mono/Complex -1.989 Embeddedness .273 Aff/Neg by i-stem/e-stem 1.601 i-stem/e-stem by Verb Length 1.777 Constant -37.065
SE
Wald
d.f.
P-value
Exp(β)
.008 .304 1.092 .416 .492 1.835 1.122 .275 .571 .838 14.537
10.640 28.908 1.983 8.520 78.676 5.871 3.144 .986 7.852 4.501 6.501
1 1 1 1 1 1 1 1 1 1 1
.001 .000 .159 .004 .000 .015 .076 .321 .005 .034 .011
1.025 .195 .215 .297 .013 .012 .137 1.314 4.958 5.914 .000
-2 Log likelihood = 363.736, Cox & Snell R2 = .160, Nagelkerke R2 = .492
As Table 10 shows, the interaction term i-stem/e-stem by verb length, which shows a high correlation coefficient in Table 9, is significant (.034). This shows that these factors do not play independent roles but contribute to the distribution of ra-Deletion in interaction with each other. Thus, the results partially support the interaction hypothesis in the sense that the independence between internal and external factors is confirmed, but there is some dependence among internal factors, although the external factors are independent of each other. 5.2.2. CSJ Next, I move on to the interaction among factors governing the distribution of raDeletion in CSJ. First, I show the correlation matrix. As Table 11 shows, the internal factors are mutually independent, and no internal factor shows any significant correlation with any external factor. On the other hand, within external factors, there are high correlation coefficients between gender and spontaneity (.667), birth year and education (.943), and speech skill and
Real-Time Demonstration of the Interaction among Internal and External Factors in Language Change
21
Table 11. Correlation matrix for dependent variable and independent variables (ra-Deletion, CSJ) Verb i-stem/ Mono/ Length e-stem Complex
Embeddedness
Birth Speech Gender Year Type
GeoEduca- Spongraphition taneity cal
Constant
Aff/ Neg
Constant
1.000
-.046
-.062
-.058
-.120
-.069
-.019
-.198 -.888
-.082
-.876
Aff/Neg
-.046 1.000
-.034
-.020
-.029
-.077
.097
-.006
.011
-.001
.020
Verb Length
-.062
-.034 1.000
.387
-.018
-.018
.140
-.010 -.033
.017
i-stem/e-stem
-.058
-.020
.387 1.000
-.095
-.057
.017
.016 -.011
.004
Style
Skill
Experience
-.327 -.212 -.152
-.062
-.033
.008
-.013
-.028
.011 -.032 -.025
-.033
-.017
.007 -.038
-.002
.034
Mono/Complex -.120
-.029
-.018
-.095
1.000
.035
.038
.010
.014
.003
.017
.020 -.033
-.029
Embeddedness
-.069
-.077
-.018
-.057
.035
1.000
-.042
-.029
.014
-.001
.031
.019 -.029 -.018
-.026
Speech Type
-.019
.097
.140
.017
.038
-.042 1.000
-.200
.125
-.076
.071
.052 -.105 -.025
-.204
Gender
-.198
-.006
-.010
.016
.010
-.029
-.200 1.000
.014
-.001
.010
.667
.020 -.065
-.030
Birth Year
-.888
.011
-.033
-.011
.014
.014
.125
.014 1.000
-.009
.943
.052
.046 -.021
-.082
Geographical
-.082
-.001
.017
.004
.003
-.001
-.076
-.001 -.009
1.000
-.018
.036
.050 -.016
-.021
Education
-.876
.020
-.028
-.017
.017
.031
.071
.035 -.016 -.009
-.106
Spontaneity
-.327
-.033
.011
.007
-.011
.019
.052
.667
.052
.036
Style
-.212
.088
-.032
-.038
.020
-.029
-.105
.020
.046
.050
-.016
Skill
-.152
.008
-.025
.034
-.033
-.018
-.025
-.065 -.021
-.016
-.009
Experience
-.062
-.013
-.033
-.002
-.029
-.026
-.204
-.030 -.082
-.021
-.106
.010
.943
-.018 1.000
-.011
.088
.035 1.000
.189 -.093
.189 1.000
-.056
.044
.036
-.093
.044 1.000
.712
-.056
.036
.712 1.000
Table 12. Logistic regression results (ra-Deletion, CSJ) variables in the equation Aff/Neg Verb Length i-stem/e-stem Mono/Complex Embeddedness Speech Type Gender Birth Year Geographical Education Spontaneity Style Skill Experience Gender by Spontaneity Birth Year by Education Skill by Experience Constant
β
SE
Wald
d.f.
P-value
Exp(β)
-.152 -.496 .371 -.385 -.044 -2.873 1.126 .895 .108 1.300 .463 -.245 .401 .459 -.259 -.222 -.198 -7.816
.124 .067 .126 .145 .123 .217 .501 .203 .038 .454 .089 .074 .133 .147 .117 .073 .059 1.375
1.488 55.329 8.649 7.106 .128 175.518 5.053 19.364 7.920 8.192 27.339 11.105 9.083 9.794 4.905 9.170 11.245 32.290
1 1 1 1 1 1 1 1 1 1 1 1 1 1 1 1 1 1
.223 .000 .003 .008 .720 .000 .025 .000 .005 .004 .000 .001 .003 .002 .027 .002 .001 .000
.859 .609 1.449 .680 .957 .057 3.083 2.448 1.114 3.668 1.589 .783 1.493 1.582 .772 .801 .821 .000
-2 Log likelihood = 2264.354, Cox & Snell R2 = .126, Nagelkerke R2 = .336
22
Shin-ichiro Sano
speech experience (.712). Thus, these factors interact with each other. These results support the interaction hypothesis. Next, I show the logistic regression results in Table 12. As the table shows, all the interaction terms that show a high correlation coefficient in Table 11 are significant at the .05 level: gender and spontaneity (.027), birth year and education (.002), and speech skill and speech experience (.001). These results show that these factors affect the distribution of ra-Deletion by interacting with each other instead of playing independent roles. Thus, the results again support the interaction hypothesis. 5.3. Re-Insertion Finally, I present the results of the analysis of re-Insertion in CSJ. I begin with a discussion of the interaction among factors, based on the correlation matrix. Table 13. Correlation matrix for dependent variable and independent variables (re-Insertion, CSJ) Constant
Aff/ Neg
1.000
.055
-.019
-.058
-.122
-.047
.129
-.167 -.905
-.882
-.076
-.129
.055 1.000
-.171
-.152
-.044
.093
.144
.021 -.158
-.185
.205
.102
Verb Length
-.019 -.171 1.000
.687
.274
-.119
.010
-.072 -.008
.009
-.189
-.133
-.235
.132 -.016
Verb Type
-.058 -.152
Constant Aff/Neg
Mono/Complex -.122 -.044 Embeddedness
Verb Verb Mono/ Embed- Speech Gender Birth Geo- Educa- Spon- Style Length Type Complex dedness Type Year graphical tion taneity
.687 1.000
Skill Experience
-.120 -.245 -.043 .221 -.019 -.015
.471
-.144
-.095
-.047
.000
.003
-.070
-.150
-.116
.111
.274
.471
1.000
.053
.100
-.023
.032
.017
-.021
-.073
-.026
.020
.036 .023
-.035
.013
.018
-.115
.012
-.103 -.023
.092
-.021
-.256
.116
-.121
-.047
.093
-.119
-.144
.053
1.000
.064
.129
.144
.010
-.095
.100
.064
1.000
-.239 -.051
Gender
-.167
.021
-.072
-.047
-.023
-.035
-.239
1.000
.089
.046
.156
.002
Birth Year
-.905 -.158
-.008
.000
.032
.013
-.051
.089 1.000
.979
-.271
-.010
-.232
.197
.044
Geographical
-.882 -.185
.009
.003
.017
.018
-.021
.046
.979 1.000
-.302
-.016
-.265
.172
.044
Education
-.076
-.189
-.070
-.021
-.115
-.256
.156 -.271
1.000
.052
.909
Speech Type
.205
-.302
.043 -.172
.154 -.143 -.014
.033 -.150
Spontaneity
-.129
.102
-.133
-.150
-.073
.012
.116
.002 -.010
-.016
.052 1.000
Style
-.120
.221
-.235
-.116
-.026
-.103
-.121
.154 -.232
-.265
.909
.152 -.146 -.111
Skill
-.245 -.019
.132
.111
.020
-.023
.043
-.143
.197
.172
.033
-.146
-.006 1.000 -.271
Experience
-.043 -.015
-.016
.036
.023
.092
-.172
-.014
.044
.044
-.150
-.111
-.060 -.271 1.000
.152 1.000 -.006 -.060
As Table 13 shows, there are interactions between verb length and verb type (vowel verb/consonant verb) (.687) and between verb type and morphological structure of the preceding stem (monomorphemic verb/complex verb) (.471). This shows that verb length interacts with verb type and with morphological structure of the preceding stem, and that verb type interacts with morphological structure of the preceding stem. Similarly, within external factors, there are high correlations between birth year and geographical difference (.979) and between education and style (.909). Thus, these factors interact with each other. The results support the interaction hypothesis except for the interactions between internal factors.
Real-Time Demonstration of the Interaction among Internal and External Factors in Language Change
23
Next, I show the logistic regression results in Table 14. As the table shows, every interaction term except for birth year by geographical difference is significant, according to the P-values. These significant interaction terms show interactions between verb type and verb length, between morphological structure of the preceding stem and verb type, and between education and speech style. These factors do not all play independent roles; instead they contribute to the distribution of re-Insertion in interaction with each other. The results support the interaction hypothesis to a large extent. Table 14. Logistic regression results (re-Insertion, CSJ) variables in the equation Aff/Neg Verb Length Verb Type Mono/Complex Embeddedness Speech Type Gender Birth Year Geographical Education Spontaneity Style Skill Experience Verb Type by Verb Length Mono/Complex by Verb Type Birth Year by Geographical Education by Style Constant
β
SE
Wald
d.f.
P-value
Exp(β)
1.295 -1.898 -5.236 -.188 1.146 -2.564 1.221 -1.742 -3.730 3.391 .620 3.546 -1.004 .479 3.598 -3.719 .579 -1.434 2.461
.703 .371 1.815 .467 .693 .988 .651 1.198 2.616 1.569 .446 1.384 .692 .398 .614 1.549 .379 .681 8.175
3.398 26.175 8.324 .161 2.736 6.732 3.516 2.113 2.034 4.669 1.929 6.561 2.104 1.445 34.388 5.766 2.335 4.440 .091
1 1 1 1 1 1 1 1 1 1 1 1 1 1 1 1 1 1 1
.065 .000 .004 .688 .098 .009 .061 .146 .154 .031 .165 .010 .147 .229 .000 .016 .126 .035 1.763
3.651 .150 .005 .829 3.145 .077 3.391 .175 .024 29.684 1.859 34.661 .366 1.614 36.542 .024 1.785 .238 11.711
-2 Log likelihood = 150.625, Cox & Snell R2 = .023, Nagelkerke R2 = .324
At this point, I summarize the results of the analysis for each variable form. Table 15. Summary of interactions for each variable form interaction
variation sa-Insertion sa-Insertion ra-Deletion ra-Deletion re-Insertion (Diet) (CSJ) (Diet) (CSJ) (CSJ)
Internal × Internal External × External Internal × External
− + −
− + −
+ − −
− + −
+ + −
Three out of five cases are perfectly consistent with what the interaction hypothesis predicts, namely, that internal factors are mutually independent, internal factors
24
Shin-ichiro Sano
and external factors are also mutually independent, and external factors are interrelated. On the other hand, against the interaction hypothesis, internal-factor interactions are observed in ra-Deletion (Diet) and re-Insertion (CSJ), while there are no external-factor interactions in ra-Deletion (Diet). It is only the independence between internal and external factors that is maintained across all cases. Internalfactor interactions are counterexamples to the interaction hypothesis. Furthermore, the fact that internal-external interactions are never attested implies a clear-cut division between internal and external factors. Thus, I formulate a revised interaction hypothesis: Interaction hypothesis (revised) In language variation and change, internal and external factors may be mutually dependent intra-categorially, while they are independent inter-categorially. Taking the discussion one step further, we may argue that the internal and external factors occupy distinct spaces in human linguistic competence. 6. Conclusion In this paper, I examined the interaction among internal and external factors in light of the interaction hypothesis, in which it is assumed that, in language variation and change, internal factors are mutually independent, internal factors and external factors are also mutually independent, but external factors are interrelated (Labov 1982). Specifically, I conducted a statistical analysis of sa-Insertion, ra-Deletion, and re-Insertion employing the Diet database and CSJ. The results partially support the interaction hypothesis in the sense that the independence between internal and external factors is maintained consistently. On the other hand, internal-internal interactions are observed in two out of five cases, and one case does not show the predicted external-external interactions. The fact that an interaction between an internal factor and an external factor is never attested is indicative of a clear-cut division between the two in their roles governing language variation and change. Based on the results, I proposed a revised interaction hypothesis, which assumes the possibility of intra-categorial interaction and the nonexistence of inter-categorial interaction among internal and external factors. The revised interaction hypothesis provides a more straightforward account of the interactions of factors. I conclude by mentioning an issue to be addressed in the future. The interaction hypothesis, including the revised version proposed in this paper, should be subjected to more stringent verification in both quantitative and qualitative terms. The continuous real-time study of three verb-form variations in Japanese can contribute to the development of the hypothesis in one dimension (deepening); crosslinguistic research focusing on changes in progress in a wide variety of languages would be a strong contribution in the other dimension (broadening). In any case, the use of large-scale corpora should be of tremendous help in such endeavors.
Real-Time Demonstration of the Interaction among Internal and External Factors in Language Change
List of abbreviations ACC: Accusative AUX: Auxiliary CAUS: Causative DES: Desiderative GEN: Genitive LOC: Locative NOM: Nominative NONP: Nonpast PAST: Past POT: Potential QPART: Question Particle
25
COND: Conditional NEG: Negative POL: Polite TE: te-form of the verb
References Baayen, Harald (2008) Analyzing linguistic data: A practical introduction to statistics using R. Cambridge: Cambridge University Press. Bloch, Bernard (1946) Studies in colloquial Japanese: II Syntax. Language 22: 200–248. Inoue, Fumio (1998) Nihongo watching. Tokyo: Iwanami. Inoue, Fumio (2003) Nihongo wa nensoku ichi-kilo de ugoku. Tokyo: Kodansha. Inoue, Fumio and Kanetaka Yarimizu (2002) Jiten: atarashii nihongo. Tokyo: Taishukan. Ishimura, Sadao (2005) SPSS-niyoru tahenryoo deeta kaiseki-no tejun. Third edition. Tokyo: Tokyo Tosyo. Kanda, Sumiko (1964) Mireru dereru kanoo hyoogen no ugoki. In: Kenji Morioka, Masaru Nagano, Yutaka Miyaji, and Takashi Ichikawa (eds.) Koogo bumpoo kooza 3 Yureteiru bunpoo, 81–91. Tokyo: Meiji Syoin. Kinsui, Satoshi (2003) Ranuki kotoba no rekishi teki kenkyuu. Gengo 32(4): 56–62. Labov, William (1963) The social motivation of a sound change. Word 19: 273–309. Labov, William (1982) Building on empirical foundations. In: Winfred P. Lehmann and Yakov Malkiel (eds.) Perspectives on historical linguistics, 17–92. Amsterdam: John Benjamins. Maekawa, Kikuo (2004) Nihongo hanashikotoba koopasu no gaiyoo. Nihongo Kagaku 15: 111–133. Matsubara, Nozomu (1996) Wakariyasui tookeigaku. Tokyo: Maruzen. Matsuda, Kenjiro (1993) Dissecting analogical leveling quantitatively: The case of the innovative potential suffix in Tokyo Japanese. Language variation and change 5: 1–34. Matsuda, Kenjiro (2004) The on-line full text database of the Minutes of the Diet: Its potentials and limitations. Theoretical and Applied Linguistics at Kobe Shoin 7: 55–82. Matsuda, Kenjiro (2008) Tookyoo shusshin giin no hatsuwa ni miru ranuki kotoba no heni to henka. In: Kenjiro Matsuda (ed.) Kokkai kaigiroku-o tsukatta nihongo kenkyuu, 111–134. Tokyo: Hituzi Syobo. Matsuda, Kenjiro, Yoshiko Usui, Satoshi Nambu, and Hiroko. Okada (2008) Kokkai kaigiroku wa dorehodo hatsugen ni chuujitsu ka. In: Kenjiro Matsuda (ed.) Kokkaikaigiroku-o tsukatta nihongo kenkyu, 33–62. Tokyo: Hituzi Shobo. Nakamura, Michio (1953) Koreru, mireru, tabereru nado to iu iikata ni tsuite no oboegaki. In: Kindaichi hakase kokikinen rombunsyuu kankookai (ed.) Gengo minzokuronsoo: Kindaichi Kyoosuke hakase kokikinen, 579–594. Tokyo: Sanseido. Nambu, Satoshi (2005) Corpus-based study of the change in GA/NO conversion. M.A. Thesis, Kobe Shoin Women’s University. Okada, Judy (2003) Recent trends in Japanese causatives: The sa-insertion phenomenon. Japanese/Korean Linguistics 12: 28–39. Oyama, Reiko (2003) Kokkaigaku Nyuumon. Second edition. Tokyo: Sanseido. Peng, Chao-Ying Joanne, Kuk Lida Lee, and Gary M. Ingersoll (2002) An introduction to logistic regression analysis and reporting. Journal of Educational Research 96(1): 3–14. Sankoff, Gillian and William Labov (1979) On the use of variable rules. Language in Society
26
Shin-ichiro Sano
8: 189–222. Sano, Shin-ichiro (2008a) Nihongo hanashikotoba koopasu ni arawareru sairekotoba ni kansuru suuryooteki bunseki. Gengo Kenkyu 133: 77–106. Sano Shin-ichiro (2008b) Kokkai kaigiroku ni yoru saire kotoba no bunseki. In: Kenjiro Matsuda (ed.) Kokkaikaigiroku o tsukatta nihongo kenkyuu, 159–184. Tokyo: Hituzi Syobo. Sano Shin-ichiro (2009) Statistical analysis of sa-Insertion: via Diet database. Japanese/ Korean Linguistics 17: 471–485. Shibuya, Katsumi (1990) Nihongo kanoohyoogen no shosoo to hatten. Doctoral dissertation, University of Osaka. Shin, Sojung (2004) Linguistic vs. extra-linguistic determinants of ‘re-tasu’ verb frequencies: A comparison of native speakers vs. Japanese language lerners. Mathematical Linguistics 24(6): 290–307. Shioda, Takehiro (2000) Kotoba kotoba kotoba, ranuki kara retasu e. Hoosoo Kenkyuu to Choosa 50(8): 55. Wakui, Yoshiyuki and Sadami Wakui (2003) Excel-de manabu tookeikaiseki. Tokyo: Natsumesha. Weiner, E. Judith and William Labov (1983) Constraints on the agentless passive. Journal of Linguistics 19: 29–58. Weinreich, Uriel, William Labov, and Marvin I. Herzog (1968) Empirical foundations for a theory of language change. In: Winfred P. Lehmann and Yakov Malkiel (eds.) Directions for Historical Linguistics. A Symposium, 95–188. Austin: University of Texas Press. On-line full-text database of the Minutes of the Diet
(May 17, 2009) Author’s contact information: International Christian University 3-10-2 Osawa, Mitaka-shi Tokyo 181-8585, Japan e-mail: [email protected]
[Received 16 January 2010; Accepted 3 July 2010]
Real-Time Demonstration of the Interaction among Internal and External Factors in Language Change
27
【要 旨】
進行中の言語変化における言語内的・外的要因の相互作用の検証 ――コーパスを用いた研究―― 佐野真一郎 国際基督教大学 これまで多くの研究において,言語変異・変化においては言語外的要因内では交互作用が 見られる一方で,言語内的要因内では大抵交互作用はなく互いに独立である,更に言語外的 要因・言語内的要因間に関しても独立であるという傾向が観察されてきた(交互作用仮説)。 しかしながら,進行中の言語変化の初期段階における要因同士の交互作用の検証,或いは大 規模コーパスにおける大量の自然発話データに基づく詳細な検証は例がない。従って,本稿 では「国会会議録」, 「日本語話し言葉コーパス」を併用し, 「さ入れ言葉」, 「ら抜き言葉」, 「れ 足す言葉」という日本語の進行中の言語変化を例として,言語内的・外的要因の交互作用を 統計的手法により検証する。分析の結果,言語外的要因・言語内的要因間に関しては一貫し て独立であったが,言語内的要因内,言語外的要因内では仮説と異なる傾向が観察された。 この結果に基づき,修正版交互作用仮説を提案した。