Cape Elizabeth Schools, Community Services, Pool 10 Year Capital Stewardship Plan “Sustain and Renew”
1
Summary • Internal review and external engineering study indicate increasing capital improvement needs at schools, community services and pool • Current faciliEes provide sufficient capacity to meet student enrollment and community usage projecEons • Scheduled asset maintenance and capital investment needed to sustain quality of buildings, faciliEes and infrastructure • Scheduled bond reErements provide sufficient capital to fund capital improvement plan in a tax neutral manner 2
Capital Stewardship Plan Timeline Building and Grounds CommiMee (School Superintendent, School Business Manager, School Board Finance Chair, Director of FaciliEes) was formed to lead capital improvement project analysis •
Completed capital improvement projects review and presented findings to School Board -‐completed June 18, 2013
•
Developed funding opEons for school and community services/pool capital needs -‐preliminary analysis and recommendaEons included in presentaEon -‐on-‐going process; final recommendaEons will be presented to School Board in September/October
•
• •
Town Council and School Board Finance Chairs combine school, community services/pool and municipal capital needs and present findings/recommendaEons -‐Joint School Board and Town Council meeEng targeted for September/October Building and Ground CommiMee finalizes capital stewardship plan and presents plan to School Board in September/October for approval School Board takes necessary next steps to implement plan 3
School CIP Overview 2015-‐2024 • $11.8 million in total school capital improvement projects over ten years • Recommend $2.7 million in bond funding ($1.8 million in 2016, $850,000 in 2022) – Recommended bond funding is less than the $6.1 million in school bond reErements scheduled over next 10 years • $8.6 million funded through annual school CIP budget and $580,000 in other financing (municipal lease)
4
School CIP Summary Schools 10 Year Projected CIP (2015-‐2024) $11,837,343 CODE 0% ELECTRICAL 13%
STRUCTURAL 23%
EQUIPMENT 5%
HVAC 27% ROOF 32%
5
Annual Projected CIP Needs Schools (2015-‐2024) $1,700,000 $1,482,439 $1,472,939
$1,500,000 $1,300,000 $1,100,000
$1,196,115
$1,093,250
$1,083,521
$1,330,547 $1,229,000
$1,101,647 $913,615
$900,000
$934,271
Projected CIP 10 Year Average $1,184,000
$700,000 $500,000 $300,000
$339,500 2014 2015 2016 2017 2018 2019 2020 2021 2022 2023 2024
• difficult to fund year to year changes through annual school CIP budget • creates volaEle local appropriaEons/tax changes each year • 2016 and 2017 are peak years
6
Annual Recommended School CIP 2015-‐2024 $2,600,000 $2,600,000 $2,400,000 $2,200,000 $2,000,000
$1,750,000
$1,800,000
$1,750,000
$1,600,000 $1,400,000
School Recommended CIP
$1,200,000
$1,000,000
$938,000 $950,000 $950,000 $950,000 $950,000
$1,000,000 $800,000 $600,000
Bond/Lease Funded Projects $850,000 $900,000 $850,000
$580,000
$400,000 $200,000
$0
$0
$0
$0
$0
2017
2018
2019
2020
2021
$0
$0
2023
2024
$0 2015
2016
2022
• Bond funding addresses peak years needs in 2016 and 2017 • Bond funding creates sustainable annual school CIP budget model 7
School Bond Funding RaEonale •
MulEple large dollar projects (15 projects over $150,000, 8 projects over $250,000, 5 projects over $500,000) -‐recognizes difficulty in funding large dollar projects through annual school CIP budget -‐reduces annual volaElity of local appropriaEons
•
Long-‐life projects (avg. project has 20-‐30 year esEmated life)
-‐allows prudent stewardship sharing of long-‐life project funding between current taxpayers and future
taxpayers
•
Projects are not discreEonary nor expansionary (e.g. roof replacement, HVAC equipment, electrical upgrades) and cannot be deferred -‐encourages scheduled asset maintenance which is prudent and cost effecEve
•
Provides opportunity to reduce overall annual tax impact for school CIP projects – – – –
provides path to reduce overall tax funding for CIP and debt service over the ten year plan single largest annual tax increase is 0.15% peak year of taxes is 2017, 0.02% increase over current avg. tax bill 2024 taxes are esEmated to decline -‐0.6% from current avg. tax bill
8
School Bond and Lease Project RecommendaEons 2015 Municipal Lease Projects MS Boiler Plant Replacement
$
580,000
HS Roof Replacement
$
800,000
MS Roof Replacement
$
175,000
PC Roof Replacement
$
175,000
MS Roof Top Heating Recovery Unit
$
325,000
Electrical Primary Service Entrance
$
275,000
Total 2016 Bonding Projects
$ 1,750,000
2016 Bond Projects
2022 Bond Projects HS Roof Replacement
$
600,000
MS Roof Replacement
$
250,000
Total 2022 Bonding Projects
$
850,000 9
School Annual CIP Budget (CIP Only) $1,050,000 $938,000
$950,000
$950,000
$950,000
$950,000
$950,000 $900,000
$900,000
$850,000
$850,000
$850,000
$750,000
$650,000
$550,000
$420,000
$450,000
$350,000
$339,500
$250,000 2014
2015
2016
2017
2018
2019
2020
2021
2022
2023
2024
• Amounts represent annual CIP funding through annual school CIP budget; excludes debt service payments • 2016 and 2017 CIP increases offset by decreased debt service requirements
10
School Total CIP Budget Funding (CIP and Debt Service) $1,750,000
$1,700,000
$1,702,440 $1,697,605
$1,696,633 $1,698,661
$1,679,607 $1,663,141
$1,662,394 $1,644,890 $1,638,329
$1,650,000
$1,615,258 $1,600,000
$1,547,062
$1,550,000
$1,500,000 2014
2015
2016
2017
Tax Analysis Single Largest Annual Increase Peak Year
0.15% 2017
Peak Year Increase Over Avg. Current Bill
0.02%
2024 Tax Change over Avg. Current Bill
-0.6%
2018
2019
2020
Bond Assumptions: Interest Rate: Payback Years:
2021
2022
2023
4.00% Median Household: 20 Town Value ($1000)
2024
$320,000 $1,648,500
11
Community Services/Pool CIP Overview 2015-‐2024 • $2.2 million in total capital improvement projects over ten years – Community Services: $537,000 – Pool: $1.7 million • Recommend $1,025,000 in bond/municipal lease funding ($675,000 in 2021, $350,000 in 2023) • $1.2 million funded through annual Community Services\Pool CIP budget 12
Community Services 10 Year Projected CIP (2015-‐2024) $537,400 ELECTRICAL 9%
ROOF 15%
STRUCTURAL 46%
EQUIPMENT 3%
HVAC 25% CODE 2%
13
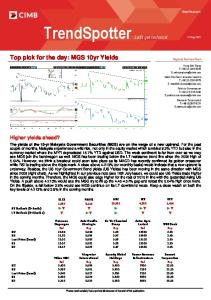
Pool 10 Year Projected CIP (2015-‐2024) $1,701,800 ELECTRICAL 8%
STRUCTURAL 18%
ROOF 21%
CODE 4%
EQUIPMENT 4%
HVAC 45%
14
Annual Projected CIP Needs Community Services/Pool (2015-‐2024) $500,000 $484,700
$456,150 $426,950
$400,000 $300,000
Projected CIP 10 Year Average
$200,000 $187,700
$167,600 $100,000
$131,300
$124,400
$93,050
$88,600
$69,750 $78,750
$223,000
$0 2014
2015
2016
2017
2018
2019
2020
2021
2022
2023
2024
• 2020, 2021 and 2023 are peak years • Difficult to fund year to year change through annual CS CIP budget 15
CS/Pool Recommended Annual CIP $900,000 $790,000
$800,000
$725,000
$700,000 $600,000
Community Services/Pool Recommended CIP
$482,600
$500,000
Bond/Lease Funded Projects
$400,000
$325,000
$300,000 $200,000 $100,000
$131,300
$125,400
$93,700 $83,000
$88,500
$69,750 $78,700
$197,700
$168,300
$0
$0
$0
$0
$0
$0
$0
2014
2015
2016
2017
2018
2019
2020
$0
$0
$0 2021
2022
2023
2024
• Bond/lease funding addresses peak years needs • Bond/lease funding creates more sustainable annual CS CIP budget model
16
CS/Pool Bond Funding RaEonale • MulEple large dollar projects (3 projects over $325,000)
-‐recognizes difficulty in funding large dollar projects through annual CIP budget -‐reduces annual volaElity of local appropriaEons
• Long-‐life projects (avg. project has 15-‐30 year esEmated life)
-‐allows prudent stewardship sharing of long-‐life project funding between current
taxpayers and future taxpayers
• Projects are not discreEonary nor expansionary (e.g. roof replacement, HVAC ) and cannot be deferred -‐encourages scheduled asset maintenance which is prudent and cost effecEve
• Provides opportunity to reduce overall annual tax impact for CS/Pool CIP projects – reduces annual volaElity of local appropriaEons – single largest annual tax increase is 0.29% – peak year of taxes is 2024, 0.40% increase over current avg. tax bill
17
CS/Pool Bond and Lease Project RecommendaZons
2021 Bond Projects HVAC System Replacement
$ 375,000
Pool Roof
$ 350,000
Total 2021 Bond Projects
$ 725,000
2023 Municipal Lease Project Solar Reheat System
$ 325,000
18
CS/Pool Annual CIP Budget (CIP Only) $220,000 $197,700
$200,000 $180,000
$168,300 $157,600
$160,000 $140,000
$131,300
$125,400
$120,000 $100,000
$93,700
$88,500
$80,000 $69,750
$83,000
$78,700
$65,000
$60,000 2014
2015
2016
2017
2018
2019
2020
2021
2022
2023
2024
• Amounts represent annual CIP funding through annual CS CIP budget; excludes debt service payments
19
CS/Pool Total CIP Budget Funding (CIP & Debt Service) $273,260
$280,000 $257,400
$260,000
$254,448 $233,160
$240,000 $223,600 $220,000 $195,923
$200,000 $180,000
$165,250
$179,200
$172,600
$176,200 $163,625
$160,000 2014
2015
2016
2017
2018
2019
2020
2021
2022
2023
2024
Tax Analysis Single Largest Annual Increase
2018
Peak Year
2024
0.29%
Peak Year Increase Over Avg. Current Bill
0.40%
2024 Tax Change over Avg. Current Bill
0.40%
Bond Assumptions: Interest Rate: Payback Years:
4.00% Median Household: 20 Town Value ($1000)
• Assumes no CS/pool user fee increases; all incremental funding by local appropriaEons
$320,000 $1,648,500
20
Combined School/CS/ Pool CIP 2015-2024 % of Total Combined Capital Improvement Projects $ 14,076,543 100%
Description School, Community Services, Pool
Categories: CODE ELECTRICAL EQUIPMENT HVAC ROOF STRUCTURAL RECURRING Total Capital Improvement Needs
Fire Egress/Alarms, Emergency Lighting, ADA Primary Service Entrance, Classrooms, Generator Locker Rooms, Restrooms, Phone and Intercom Boiler Plant, Rooftop Heating Recovery, Ventilation, Ducts Roof Replacement and Recertificatioin Cafeteria Split Level Upgrade, Wall Repair, Columns Repair, Floor Replacement, Brickwork Food Service, Custodial and Maintenance Equipment, Non Bus Vehicles
Departments: School Community Services Pool
147,250 1,689,750 707,450 3,948,600 4,027,500 3,117,000 438,993 $ 14,076,543
1% 12% 5% 28% 29% 22% 3% 100%
2015-2024 % of Total $ 11,837,343 84% $ 537,400 4% $ 1,701,800 12% $ 14,076,543 100%
21
School/CS/Pool Total CIP Budget Funding (CIP & Debt Service) $2,000,000 $1,955,005
$1,900,000 $1,861,883
$1,871,561
$1,892,777
$1,886,741 $1,881,640 $1,855,807 $1,826,019
$1,848,418
$1,840,812
$1,820,323
$1,800,000
$1,700,000 2014
2015
2016
Tax Analysis Single Largest Annual Increase 2018 Peak Year 2018 Peak Year Increase Over Avg. Current Bill 2024 Tax Change over Avg. Current Bill
2017
2018
0.27% 0.35% -0.15%
2019
2020
Bond Assumptions: Interest Rate: Payback Years:
2021
2022
2023
2024
4.00% Median Household: 20 Town Value ($1000)
$320,000 $1,648,500
• Stable, manageable annual CIP and debt service model • Favorable tax impact over 10 year plan; minimizes year to year tax volaElity
22
Summary • Capital investment needs are clear and required • Broad stakeholder use of faciliEes and expectaEon that assets are maintained • Clear path to tax neutral impact through sustained annual CIP budgeEng and new bond funding
23