Co. Reg No: 198700034E MICA (P) : 099/03/2012
Singapore Company Update
7 October 2013
SIA Engineering
Buy (unchanged) Share price: Target price:
Customer Fleet Growth A Positive
SGD4.90 SGD6.19 (unchanged)
VietJetAir to expand A320 fleet, boon for SIAEC’s FMP service. VietJetAir, a Vietnam-based low-cost carrier, announced recently that it has signed a memorandum of understanding with Airbus for up to 92 A320s (42 A320neo, 14 A320ceo, six A321ceo and 30 purchase rights). It also said it will lease another eight A320s from third-party lessors. This means there is scope for SIAEC to extend the service contract under its Fleet Management Programme (FMP) to the future fleet of A320s, given that VietJetAir is an existing customer. The A320 family of aircraft forms the bulk of the fleet under its management and we believe this business segment will benefit from economies of scale as its customers continue to expand their fleet.
Derrick HENG
[email protected] (65) 6432 1446 Mohshin Aziz
[email protected] (603) 2297 8692 Stock Information Description: SIA Engineering Company (SIAEC) is a leading maintenance, repair & overhaul (MRO) service provider and is majority owned by Singapore Airlines. The company is a dominant line maintenance player at Singapore’s Changi Airport with a market share of about 80%. SIAEC also holds significant stakes in joint ventures that contribute to more than half of the group’s profits. Ticker: Shares Issued (m): Market Cap (USD m): 3-mth Avg Daily Turnover (USD m): ST Index: Free float (%):
SIE SP 1,113.0 4,373.6 1.3 3,138.08 21.4
Major Shareholders: Singapore Airlines
% 78.6
Key Indicators ROE – annualised (%) Net cash (SGD m): NTA/shr (SGD): Interest cover (x):
20.8 619 1.25 n.m.
Cash pile too high; time to review conservative capital structure? Over the past two years, we note that SIAEC has been hoarding cash and believe that it should increase its dividend distribution to shareholders. While the SIA Group has little problem funding the huge aircraft orders placed over the past year, we think SIAEC should return the excess cash to its parent company, which can then be redeployed to fund these future capital expenditure. In other words, perhaps the time is ripe for SIAEC to conduct a radical review of its conservative balance sheet and consider a more aggressive capital structure. Top pick in the sector, reiterate BUY. SIAEC is our top pick in Singapore’s Transportation space as it is a pure play to the aviation growth story in the region (click for sector note). Reiterate BUY with TP of SGD6.19.
Historical Chart 5.40
Changi Airport traffic growing from strength to strength. A total of 29,600 landings and take-offs were recorded at Changi Airport in Aug 2013, up 8.2% YoY. The increase was driven by a sustained uptrend in traffic growth momentum over the past few months. Longer term, traffic growth at the airport will remain highly visible as Singapore aims to double its terminal handling capacity by mid-2020s. As a dominant player at Changi Airport, we expect this development will keep SIAEC’s line maintenance division highly profitable.
SIE SP Equity
5.20
SIA Engineering – Summary Earnings Table
5.00 4.80 4.60 4.40 4.20 4.00 Oct-12
Dec-12
Feb-13
Performance: 52-week High/Low Absolute (%) Relative (%)
Apr-13
Jun-13
Aug-13
Oct-13
SGD5.32/SGD4.13
1-mth
3-mth
6-mth
1-yr
YTD
5.2 1.1
-2.0 -1.7
3.2 8.8
16.9 15.1
11.6 12.7
FYE Mar (SGD m) Revenue EBITDA Recurring Net Profit Recurring Basic EPS (cents) EPS Growth (%) DPS (cents)
2012 1,170 169 269 24.4 4.1% 21.0
2013 1,147 163 270 24.3 0.3% 22.0
2014F 1,181 169 276 24.8 2.2% 23.0
2015F 1,209 179 299 26.8 8.3% 24.0
2016F 1,230 182 312 28.0 4.2% 25.0
PER (x) EV/EBITDA (x) Div Yield (%) P/BV (x)
20.2 28.7 4.3% 4.3
20.1 29.7 4.5% 4.2
19.7 28.7 4.7% 4.1
18.2 27.0 4.9% 4.0
17.5 26.6 5.1% 3.9
495 21.1% 16.9%
517 21.1% 17.0%
510 20.9% 16.9% 285
494 22.1% 17.8% 304
480 22.5% 18.1% 326
Net Cash ROE (%) ROA (%) Consensus Net Profit (SGD m) Source: Company, Maybank KE
SEE APPENDIX I FOR IMPORTANT DISCLOSURES AND ANALYST CERTIFICATIONS
SIA Engineering
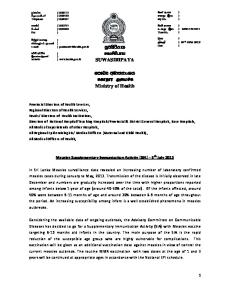
VietJetAir to expand A320 fleet, boon for SIAEC’s FMP service. VietJetAir, a Vietnam-based low-cost carrier, announced recently that it has signed a memorandum of understanding with Airbus for up to 92 A320s (42 A320neo, 14 A320ceo, six A321ceo and 30 purchase rights). It also said it will lease another eight A320s from third-party lessors. Currently, six of VietJetAir’s fleet of A320s are serviced by SIAEC under a five-year Fleet Management Programme (FMP) service agreement signed in 2010. This means there is scope for SIAEC to extend its existing service contract to cover VietJetAir’s future fleet of A320s. FMP contributions on the rise. Driven by a growing fleet under management, contributions from SIAEC’s FMP service offering have steadily increased over the past decade. The A320 family of aircraft forms the bulk of the fleet under its management (May 2013: 106 aircraft, 73% of fleet) and we believe this business segment will benefit from economies of scale as its customers continue to expand their fleet. While the transition of SilkAir’s fleet from A320s to B737s will reduce the number of A320s under the programme, we expect SIAEC to roll out FMP services for B737s to support fleet development at the regional carrier. If so, we believe this new offering will help SIAEC to attract even more customers to the programme. Figure 1: Increasing contributions from FMP over the past decade 250 200
Figure 2: A320 family of aircraft forms majority of fleet under FMP programme A340-500, 5 , 4%
FMP Revenue (SGD'm)
B747-400, 5 , 3%
B777, 9 , 6%
150 100
A330-300, 20 , 14%
50 0
A319/A320, 106 , 73%
FY04 FY05 FY06 FY07 FY08 FY09 FY10 FY11 FY12 FY13
Source: SIAEC, Maybank KE
Source: SIAEC, Maybank KE
Changi Airport traffic growing from strength to strength. Recent data points suggest that the slowdown in traffic growth at Changi Airport in 2012 is now behind us. A total of 29,600 landings and take-offs were recorded in August 2013, up 8.2% YoY. The increase was driven by a sustained uptrend in traffic growth momentum over the past few months. Longer term, traffic growth at the airport will remain highly visible as Singapore aims to double its terminal handling capacity by mid-2020s (135m passengers in mid-2020s vs 66m passengers in 2012). As a dominant player at Changi Airport, we expect this development will keep SIAEC’s line maintenance division highly profitable (FY13 EBIT: SGD88m; 69% of group EBIT).
7 October 2013
Page 2 of 9
SIA Engineering Figure 4: ...and stands to benefit from the sustained uptrend in flight traffic growth momentum
Source: Maybank KE estimates
Dec-13
21% 18% 15% 12% 9% 6% 3% 0% -3% -6%
Dec-12
Dec-11
Dec-10
Dec-09
Dec-08
Dec-04
SIAEC, 70%
Dec-05
Others, 30%
Dec-07
Changi Airport Flight Traffic (no.) 3mma y-y (%)
32,000 30,000 28,000 26,000 24,000 22,000 20,000 18,000 16,000 14,000
Dec-06
Figure 3: SIAEC is a dominant line maintenance player at Changi Airport...
Source: CAG, CEIC, Maybank KE
Cash pile remains too high. Prior to the 2008-2009 Global Financial Crisis, SIAEC had paid out dividends of at least 25 Singapore cents per share whenever its annual cash hoard exceeded SGD450m. However, after declaring DPS of 30 Singapore cents in FY11, management became fairly conservative in dividend distribution. Over the past two years, we note that SIAEC has been hoarding cash and believe that it should increase its dividend distribution to shareholders. Even assuming an annual increment in DPS of 1 Singapore cent over the next few years, we estimate SIAEC’s cash pile would still be well above SGD450m throughout our forecast years. Figure 5: Huge cash pile, likely higher payout support our DPS forecasts 700
30
600
30
25 21
20
500
16
400
22
23
24
35 25
20 15
8 4
10
4
Cash, LHS (SGD'm)
FY16E
FY13
FY12
FY11
FY10
FY09
FY08
FY07
FY06
FY05
FY04
FY03
FY02
FY01
100
FY15E
5
FY14E
3
30 25
18
12
300 200
Cash level remains too high?
0
DPS, RHS (Scents)
Source: Maybank KE
Time ripe for radical review of conservative capital structure? The significant number of aircraft orders placed by the SIA Group over the past year is a much-discussed topic in the market. While the group would have little problem funding its capex commitments in view of its strong balance sheet, we think SIAEC should return the excess cash to its parent company (SIA owns 79% of SIAEC), which can then be redeployed to fund these future capital expenditure. Besides, dividend contributions from its network of joint ventures will continue to drive up its cash levels in the future. Hence, in our view, SIAEC should conduct a radical review of its conservative balance sheet and consider a more aggressive capital structure. In order to return even more capital to its parent, we reckon SIAEC should consider separate spin-offs of its JVs.
7 October 2013
Page 3 of 9
SIA Engineering Figure 6: Capex commitments for SIA Group peaked in recent years 14,000
SIA Group (SGD'm)
13,226
13,000 12,000
10,964
11,000 10,000
8,996
8,972
9,277
9,000 7,582
8,000
7,511 6,557
7,000 6,000
FY13
FY12
FY11
FY10
FY09
FY08
FY07
FY06
5,000
Source: Maybank KE
Top pick in the sector, reiterate BUY. SIAEC is our top pick in Singapore’s Transportation space as it is a pure play to the aviation growth story in the region (click for sector note). We value the stock using the SOTP methodology as we believe this would better reflect the underlying value of its associates and JVs. We thus arrive at a TP of SGD6.19. Almost half of the stock’s valuation resides in the key JVs with Rolls-Royce (SAESL + IECO), reflecting the positive outlook and strong economic moats of their business. While the P/E multiples appear rich relative to the stock’s historical trading range, we argue that there is hidden value within its business units that are not fully reflected via a P/E valuation method. Special dividends and separate listings of its units are potential stock catalysts, in our view.
7 October 2013
Page 4 of 9
SIA Engineering PROFIT AND LOSS (SGD m)
BALANCE SHEET (SGD m)
FYE Mar
2012
2013
2014F
2015F
2016F
FYE Mar
2012
2013
2014F
2015F
2016F
Revenue EBITDA Depreciation & Amortisation Operating profit Interest (Exp)/Inc Associates Exceptional items Other items Pretax profit Income taxes Minority interests Reported Net Profit Core Net Profit
1,170 169 (40) 130 15 157 0 2 303 (31) (3) 269 269
1,147 163 (35) 128 18 159 0 1 306 (32) (4) 270 270
1,181 169 (39) 130 18 165 0 0 313 (33) (4) 276 276
1,209 179 (41) 139 19 180 0 0 338 (35) (4) 299 299
1,230 182 (42) 140 20 192 0 0 352 (36) (4) 312 312
Revenue Growth (%) EBITDAR Growth (%) EBIT Growth (%) Net Profit Growth (%) Recurring Net Profit Growth Tax Rate (%)
5.7% -3.4% -4.5% 4.1% 4.1% 10.3%
-2.0% -3.6% -1.2% 0.3% 0.3% 10.4%
3.0% 3.8% 1.7% 2.2% 2.2% 10.5%
2.4% 6.0% 6.6% 8.3% 8.3% 10.4%
1.7% 1.7% 1.1% 4.2% 4.2% 10.3%
Total assets Current assets Cash & ST investment Inventories Accounts receivable Others Other assets LT investments Net fixed assets Others Total liabilities Current liabilities Accounts payable ST borrowings Others Long-term liabilities Long-term debts Others Shareholder's equity Minority interests
1,599 820 498 118 205 (41) 779 15 309 456 320 293 264 2 27 26 0 26 1,254 25
1,633 837 523 108 206 (41) 796 15 305 476 304 278 249 6 24 25 0 25 1,302 27
1,681 840 515 115 210 (0) 840 15 319 506 318 293 263 6 24 25 0 25 1,335 28
1,719 834 499 119 215 51 885 15 331 539 323 298 268 6 24 25 0 25 1,368 28
1,759 828 486 123 219 102 931 15 342 574 328 302 273 6 24 25 0 25 1,403 28
CASH FLOW (SGD m) FYE Mar
2012
2013
2014F
2015F
2016F
KEY RATIOS FYE Mar
2012
2013
2014F
2015F
2016F
Operating cash flow Operating profit Depreciation & amortisation Change in working capital Others Investment cash flow Net capex Change in LT investment Other investment CF Cash flow after invt. Financing cash flow Change in share capital Net change in debt Dividends to shareholders Change in other LT liab. Net cash flow
135 130 40 (12) (22) 99 (42) (3) 144 234 (317) 14 1 (329) (3) (83)
134 128 35 (4) (25) 110 (45) 0 156 244 (219) 23 3 (242) (2) 25
140 130 39 3 (33) 100 (55) 0 155 239 (247) 0 0 (243) (4) (8)
139 139 41 (5) (35) 114 (55) 0 169 253 (269) 0 0 (265) (4) (16)
143 140 42 (3) (36) 124 (55) 0 179 267 (280) 0 0 (277) (4) (13)
5.7% -4.5% -3.4% 4.1% 4.1%
-2.0% -1.2% -3.6% 0.3% 0.3%
3.0% 1.7% 3.8% 2.2% 2.2%
2.4% 6.6% 6.0% 8.3% 8.3%
1.7% 1.1% 1.7% 4.2% 4.2%
14.5% 11.1% 14.5% 23.3% 16.9% 21.1%
14.2% 11.2% 14.2% 23.9% 17.0% 21.1%
14.3% 11.0% 14.3% 23.7% 16.9% 20.9%
14.8% 11.5% 14.8% 25.1% 17.8% 22.1%
14.8% 11.4% 14.8% 25.7% 18.1% 22.5%
0.2% -38.7% >100 51.7 >100 53.9 2.8 2.4 495
0.4% -38.9% >100 22.3 >100 23.3 3.0 2.6 517
0.4% -37.4% >100 22.5 >100 24.1 2.9 2.5 510
0.4% -35.4% >100 23.9 >100 24.0 2.8 2.4 494
0.4% -33.6% >100 24.1 >100 24.6 2.7 2.3 480
0.25 (0.08) 1.14 1.07 0.15 0.21
0.25 0.02 1.18 1.04 0.15 0.22
0.25 (0.01) 1.21 1.07 0.15 0.23
0.27 (0.01) 1.24 1.09 0.16 0.24
0.28 (0.01) 1.27 1.11 0.16 0.25
Growth (% YoY) Sales Operating profit EBITDA Net profit EPS Profitability (%) EBITDAR margin Operating margin EBITDA margin Net margin ROA ROE Stability Gross debt/equity (%) Net debt/equity (%) Int. coverage (X) Int. & ST debt coverage (X) Cash flow int. coverage (X) Cash flow int. & ST debt (X) Current ratio (X) Quick ratio (X) Net cash/(debt) (SGD m) Per share data (SGD) EPS CFPS BVPS SPS EBITDA/share DPS
Source: Company, Maybank KE
7 October 2013
Page 5 of 9
SIA Engineering
RESEARCH OFFICES REGIONAL WONG Chew Hann, CA Regional Head, Institutional Research (603) 2297 8686
[email protected] Alexander GARTHOFF Institutional Product Manager (852) 2268 0638
[email protected] ONG Seng Yeow Regional Head, Retail Research (65) 6432 1453
[email protected]
MALAYSIA WONG CHEW HANN, CA Head of Research (603) 2297 8686
[email protected] Strategy DESMOND CH’NG, ACA (603) 2297 8680
[email protected] Banking & Finance LIAW THONG JUNG (603) 2297 8688
[email protected] Oil & Gas – Regional Shipping ONG CHEE TING, CA (603) 2297 8678
[email protected] Plantations – Regional MOHSHIN AZIZ (603) 2297 8692
[email protected] Aviation – Regional Petrochem YIN SHAO YANG, CPA (603) 2297 8916
[email protected] Gaming – Regional Media TAN CHI WEI, CFA (603) 2297 8690
[email protected] Power Telcos WONG WEI SUM, CFA (603) 2297 8679
[email protected] Property & REITs LEE YEN LING (603) 2297 8691
[email protected] Building Materials Glove producers CHAI LI SHIN (603) 2297 8684
[email protected] Plantation Construction & Infrastructure KANG CHUN EE (603) 2297 8675
[email protected] Consumer IVAN YAP (603) 2297 8612
[email protected] Automotive LEE Cheng Hooi, Regional Chartist (603) 2297 8694
[email protected] Tee Sze Chiah, Head of Retail Research (603) 2297 6858
[email protected]
HONG KONG / CHINA Howard WONG Head of Research (852) 2268 0648
[email protected] Oil & Gas - Regional Alexander LATZER (852) 2268 0647
[email protected] Metals & Mining - Regional Jacqueline KO, CFA (852) 2268 0633
[email protected] Consumer Terence LOK (852) 2268 0630
[email protected] Consumer Jeremy TAN (852) 2268 0635
[email protected] Gaming Karen KWAN (852) 2268 0640
[email protected] HK & China Property Philip TSE (852) 2268 0643
[email protected] HK & China Property Warren LAU (852) 2268 0644
[email protected] Technology – Regional
INDIA Jigar SHAH Head of Research (91) 22 6623 2601
[email protected] Oil & Gas Automobile Cement Anubhav GUPTA (91) 22 6623 2605
[email protected] Metal & Mining Capital goods Property Urmil SHAH (91) 22 6623 2606
[email protected] Technology Media
7 October 2013
ECONOMICS Suhaimi ILIAS Chief Economist Singapore | Malaysia (603) 2297 8682
[email protected]
JUNIMAN Chief Economist, BII Indonesia (62) 21 29228888 ext 29682
[email protected]
Luz LORENZO Philippines (63) 2 849 8836
[email protected]
Josua PARDEDE Economist / Industry Analyst, BII Indonesia (62) 21 29228888 ext 29695
[email protected]
Tim LEELAHAPHAN Thailand (662) 658 1420
[email protected]
SINGAPORE Gregory YAP Head of Research (65) 6432 1450
[email protected] Technology & Manufacturing Telcos Wilson LIEW (65) 6432 1454
[email protected] Property Developers James KOH (65) 6432 1431
[email protected] Consumer - Regional YEAK Chee Keong, CFA (65) 6432 1460
[email protected] Offshore & Marine Alison FOK (65) 6432 1447
[email protected] Small & Mid Caps Construction ONG Kian Lin (65) 6432 1470
[email protected] S-REITs Wei Bin (65) 6432 1455
[email protected] Commodity Logistics S-chips Derrick HENG (65) 6432 1446
[email protected] Transport (Land, Shipping & Aviation) John CHEONG (65) 6432 1461
[email protected] Small & Mid Caps Healthcare
INDONESIA Lucky ARIESANDI, CFA (62) 21 2557 1127
[email protected] Base metals Mining Oil & Gas Wholesale Pandu ANUGRAH (62) 21 2557 1137
[email protected] Automotive Heavy equipment Plantation Toll road Rahmi MARINA (62) 21 2557 1128
[email protected] Banking Multifinance Adi N. WICAKSONO (62) 21 2557 1128
[email protected] Generalist Anthony YUNUS (62) 21 2557 1139
[email protected] Cement Infrastructure Property
PHILIPPINES Luz LORENZO Head of Research (63) 2 849 8836
[email protected] Strategy Laura DY-LIACCO (63) 2 849 8840
[email protected] Utilities Conglomerates Telcos Lovell SARREAL (63) 2 849 8841
[email protected] Consumer Media Cement Luz LORENZO (63) 2 849 8836
[email protected] Conglomerates Property Ports/ Logistics Gaming Katherine TAN (63) 2 849 8843
[email protected] Banks Construction Ramon ADVIENTO (63) 2 849 8845
[email protected] Mining
THAILAND Sukit UDOMSIRIKUL Head of Research (66) 2658 6300 ext 5090
[email protected] Maria LAPIZ Head of Institutional Research Dir (66) 2257 0250 | (66) 2658 6300 ext 1399
[email protected] Consumer/ Big Caps Mayuree CHOWVIKRAN (66) 2658 6300 ext 1440
[email protected] Strategy Padon Vannarat (66) 2658 6300 ext 1450
[email protected] Strategy Surachai PRAMUALCHAROENKIT (66) 2658 6300 ext 1470
[email protected] Auto Conmat Contractor Steel Suttatip PEERASUB (66) 2658 6300 ext 1430
[email protected] Media Commerce Sutthichai KUMWORACHAI (66) 2658 6300 ext 1400
[email protected] Energy Petrochem Termporn TANTIVIVAT (66) 2658 6300 ext 1520
[email protected] Property Woraphon WIROONSRI (66) 2658 6300 ext 1560
[email protected] Banking & Finance Jaroonpan WATTANAWONG (66) 2658 6300 ext 1404
[email protected] Transportation Small cap. Chatchai JINDARAT (66) 2658 6300 ext 1401
[email protected] Electronics
VIETNAM Michael KOKALARI, CFA Head of Research (84) 838 38 66 47
[email protected] Strategy Nguyen Thi Ngan Tuyen (84) 844 55 58 88 x 8081
[email protected] Food and Beverage Oil and Gas Hang Vu (84) 844 55 58 88 x 8087
[email protected] Banking Trinh Thi Ngoc Diep (84) 844 55 58 88 x 8242
[email protected] Technology Utilities Construction Dang Thi Kim Thoa (84) 844 55 58 88 x 8083
[email protected] Consumer Nguyen Trung Hoa (84) 844 55 58 88 x 8088
[email protected] Steel Sugar Resources
Page 6 of 9
SIA Engineering APPENDIX I: TERMS FOR PROVISION OF REPORT, DISCLAIMERS AND DISCLOSURES DISCLAIMERS This research report is prepared for general circulation and for information purposes only and under no circumstances should it be considered or intended as an offer to sell or a solicitation of an offer to buy the securities referred to herein. Investors should note that values of such securities, if any, may fluctuate and that each security’s price or value may rise or fall. Opinions or recommendations contained herein are in form of technical ratings and fundamental ratings. Technical ratings may differ from fundamental ratings as technical valuations apply different methodologies and are purely based on price and volume-related information extracted from the relevant jurisdiction’s stock exchange in the equity analysis. Accordingly, investors’ returns may be less than the original sum invested. Past performance is not necessarily a guide to future performance. This report is not intended to provide personal investment advice and does not take into account the specific investment objectives, the financial situation and the particular needs of persons who may receive or read this report. Investors should therefore seek financial, legal and other advice regarding the appropriateness of investing in any securities or the investment strategies discussed or recommended in this report. The information contained herein has been obtained from sources believed to be reliable but such sources have not been independently verified by Maybank Investment Bank Berhad, its subsidiary and affiliates (collectively, “MKE”) and consequently no representation is made as to the accuracy or completeness of this report by MKE and it should not be relied upon as such. Accordingly, MKE and its officers, directors, associates, connected parties and/or employees (collectively, “Representatives”) shall not be liable for any direct, indirect or consequential losses or damages that may arise from the use or reliance of this report. Any information, opinions or recommendations contained herein are subject to change at any time, without prior notice. This report may contain forward looking statements which are often but not always identified by the use of words such as “anticipate”, “believe”, “estimate”, “intend”, “plan”, “expect”, “forecast”, “predict” and “project” and statements that an event or result “may”, “will”, “can”, “should”, “could” or “might” occur or be achieved and other similar expressions. Such forward looking statements are based on assumptions made and information currently available to us and are subject to certain risks and uncertainties that could cause the actual results to differ materially from those expressed in any forward looking statements. Readers are cautioned not to place undue relevance on these forward-looking statements. MKE expressly disclaims any obligation to update or revise any such forward looking statements to reflect new information, events or circumstances after the date of this publication or to reflect the occurrence of unanticipated events. MKE and its officers, directors and employees, including persons involved in the preparation or issuance of this report, may, to the extent permitted by law, from time to time participate or invest in financing transactions with the issuer(s) of the securities mentioned in this report, perform services for or solicit business from such issuers, and/or have a position or holding, or other material interest, or effect transactions, in such securities or options thereon, or other investments related thereto. In addition, it may make markets in the securities mentioned in the material presented in this report. MKE may, to the extent permitted by law, act upon or use the information presented herein, or the research or analysis on which they are based, before the material is published. One or more directors, officers and/or employees of MKE may be a director of the issuers of the securities mentioned in this report. This report is prepared for the use of MKE’s clients and may not be reproduced, altered in any way, transmitted to, copied or distributed to any other party in whole or in part in any form or manner without the prior express written consent of MKE and MKE and its Representatives accepts no liability whatsoever for the actions of third parties in this respect. This report is not directed to or intended for distribution to or use by any person or entity who is a citizen or resident of or located in any locality, state, country or other jurisdiction where such distribution, publication, availability or use would be contrary to law or regulation. This report is for distribution only under such circumstances as may be permitted by applicable law. The securities described herein may not be eligible for sale in all jurisdictions or to certain categories of investors. Without prejudice to the foregoing, the reader is to note that additional disclaimers, warnings or qualifications may apply based on geographical location of the person or entity receiving this report. Malaysia Opinions or recommendations contained herein are in the form of technical ratings and fundamental ratings. Technical ratings may differ from fundamental ratings as technical valuations apply different methodologies and are purely based on price and volume-related information extracted from Bursa Malaysia Securities Berhad in the equity analysis. Singapore This report has been produced as of the date hereof and the information herein may be subject to change. Maybank Kim Eng Research Pte. Ltd. (“Maybank KERPL”) in Singapore has no obligation to update such information for any recipient. For distribution in Singapore, recipients of this report are to contact Maybank KERPL in Singapore in respect of any matters arising from, or in connection with, this report. If the recipient of this report is not an accredited investor, expert investor or institutional investor (as defined under Section 4A of the Singapore Securities and Futures Act), Maybank KERPL shall be legally liable for the contents of this report, with such liability being limited to the extent (if any) as permitted by law. Thailand The disclosure of the survey result of the Thai Institute of Directors Association (“IOD”) regarding corporate governance is made pursuant to the policy of the Office of the Securities and Exchange Commission. The survey of the IOD is based on the information of a company listed on the Stock Exchange of Thailand and the market for Alternative Investment disclosed to the public and able to be accessed by a general public investor. The result, therefore, is from the perspective of a third party. It is not an evaluation of operation and is not based on inside information.The survey result is as of the date appearing in the Corporate Governance Report of Thai Listed Companies. As a result, the survey may be changed after that date. Maybank Kim Eng Securities (Thailand) Public Company Limited (“MBKET”) does not confirm nor certify the accuracy of such survey result. Except as specifically permitted, no part of this presentation may be reproduced or distributed in any manner without the prior written permission of MBKET. MBKET accepts no liability whatsoever for the actions of third parties in this respect. US This research report prepared by MKE is distributed in the United States (“US”) to Major US Institutional Investors (as defined in Rule 15a-6 under the Securities Exchange Act of 1934, as amended) only by Maybank Kim Eng Securities USA Inc (“Maybank KESUSA”), a broker-dealer registered in the US (registered under Section 15 of the Securities Exchange Act of 1934, as amended). All responsibility for the distribution of this report by Maybank KESUSA in the US shall be borne by Maybank KESUSA. All resulting transactions by a US person or entity should be effected through a registered broker-dealer in the US. This report is not directed at you if MKE is prohibited or restricted by any legislation or regulation in any jurisdiction from making it available to you. You should satisfy yourself before reading it that Maybank KESUSA is permitted to provide research material concerning investments to you under relevant legislation and regulations. UK This document is being distributed by Maybank Kim Eng Securities (London) Ltd (“Maybank KESL”) which is authorized and regulated, by the Financial Services Authority and is for Informational Purposes only. This document is not intended for distribution to anyone defined as a Retail Client under the Financial Services and Markets Act 2000 within the UK. Any inclusion of a third party link is for the recipients convenience only, and that the firm does not take any responsibility for its comments or accuracy, and that access to such links is at the individuals own risk. Nothing in this report should be considered as constituting legal, accounting or tax advice, and that for accurate guidance recipients should consult with their own independent tax advisers.
7 October 2013
Page 7 of 9
SIA Engineering DISCLOSURES Legal Entities Disclosures Malaysia: This report is issued and distributed in Malaysia by Maybank Investment Bank Berhad (15938-H) which is a Participating Organization of Bursa Malaysia Berhad and a holder of Capital Markets and Services License issued by the Securities Commission in Malaysia. Singapore: This material is issued and distributed in Singapore by Maybank KERPL (Co. Reg No 197201256N) which is regulated by the Monetary Authority of Singapore. Indonesia: PT Kim Eng Securities (“PTKES”) (Reg. No. KEP-251/PM/1992) is a member of the Indonesia Stock Exchange and is regulated by the BAPEPAM LK. Thailand: MBKET (Reg. No.0107545000314) is a member of the Stock Exchange of Thailand and is regulated by the Ministry of Finance and the Securities and Exchange Commission. Philippines: Maybank ATRKES (Reg. No.01-2004-00019) is a member of the Philippines Stock Exchange and is regulated by the Securities and Exchange Commission. Vietnam: Maybank Kim Eng Securities JSC (License Number: 71/UBCK-GP) is licensed under the State Securities Commission of Vietnam.Hong Kong: KESHK (Central Entity No AAD284) is regulated by the Securities and Futures Commission. India: Kim Eng Securities India Private Limited (“KESI”) is a participant of the National Stock Exchange of India Limited (Reg No: INF/INB 231452435) and the Bombay Stock Exchange (Reg. No. INF/INB 011452431) and is regulated by Securities and Exchange Board of India. KESI is also registered with SEBI as Category 1 Merchant Banker (Reg. No. INM 000011708) US: Maybank KESUSA is a member of/ and is authorized and regulated by the FINRA – Broker ID 27861. UK: Maybank KESL (Reg No 2377538) is authorized and regulated by the Financial Services Authority.
Disclosure of Interest Malaysia: MKE and its Representatives may from time to time have positions or be materially interested in the securities referred to herein and may further act as market maker or may have assumed an underwriting commitment or deal with such securities and may also perform or seek to perform investment banking services, advisory and other services for or relating to those companies. Singapore: As of 7 October 2013, Maybank KERPL and the covering analyst do not have any interest in any companies recommended in this research report. Thailand: MBKET may have a business relationship with or may possibly be an issuer of derivative warrants on the securities /companies mentioned in the research report. Therefore, Investors should exercise their own judgment before making any investment decisions. MBKET, its associates, directors, connected parties and/or employees may from time to time have interests and/or underwriting commitments in the securities mentioned in this report. Hong Kong: KESHK may have financial interests in relation to an issuer or a new listing applicant referred to as defined by the requirements under Paragraph 16.5(a) of the Hong Kong Code of Conduct for Persons Licensed by or Registered with the Securities and Futures Commission. As of 7 October 2013, KESHK and the authoring analyst do not have any interest in any companies recommended in this research report. MKE may have, within the last three years, served as manager or co-manager of a public offering of securities for, or currently may make a primary market in issues of, any or all of the entities mentioned in this report or may be providing, or have provided within the previous 12 months, significant advice or investment services in relation to the investment concerned or a related investment and may receive compensation for the services provided from the companies covered in this report.
OTHERS Analyst Certification of Independence The views expressed in this research report accurately reflect the analyst’s personal views about any and all of the subject securities or issuers; and no part of the research analyst’s compensation was, is or will be, directly or indirectly, related to the specific recommendations or views expressed in the report. Reminder Structured securities are complex instruments, typically involve a high degree of risk and are intended for sale only to sophisticated investors who are capable of understanding and assuming the risks involved. The market value of any structured security may be affected by changes in economic, financial and political factors (including, but not limited to, spot and forward interest and exchange rates), time to maturity, market conditions and volatility and the credit quality of any issuer or reference issuer. Any investor interested in purchasing a structured product should conduct its own analysis of the product and consult with its own professional advisers as to the risks involved in making such a purchase. No part of this material may be copied, photocopied or duplicated in any form by any means or redistributed without the prior consent of MKE.
Ong Seng Yeow | Executive Director, Maybank Kim Eng Research
Definition of Ratings Maybank Kim Eng Research uses the following rating system: BUY
Return is expected to be above 10% in the next 12 months (excluding dividends)
HOLD
Return is expected to be between - 10% to +10% in the next 12 months (excluding dividends)
SELL
Return is expected to be below -10% in the next 12 months (excluding dividends)
Applicability of Ratings The respective analyst maintains a coverage universe of stocks, the list of which may be adjusted according to needs. Investment ratings are only applicable to the stocks which form part of the coverage universe. Reports on companies which are not part of the coverage do not carry investment ratings as we do not actively follow developments in these companies.
Some common terms abbreviated in this report (where they appear): Adex = Advertising Expenditure BV = Book Value CAGR = Compounded Annual Growth Rate Capex = Capital Expenditure CY = Calendar Year DCF = Discounted Cashflow DPS = Dividend Per Share EBIT = Earnings Before Interest And Tax EBITDA = EBIT, Depreciation And Amortisation EPS = Earnings Per Share EV = Enterprise Value
7 October 2013
FCF = Free Cashflow FV = Fair Value FY = Financial Year FYE = Financial Year End MoM = Month-On-Month NAV = Net Asset Value NTA = Net Tangible Asset P = Price P.A. = Per Annum PAT = Profit After Tax PBT = Profit Before Tax
PE = Price Earnings PEG = PE Ratio To Growth PER = PE Ratio QoQ = Quarter-On-Quarter ROA = Return On Asset ROE = Return On Equity ROSF = Return On Shareholders’ Funds WACC = Weighted Average Cost Of Capital YoY = Year-On-Year YTD = Year-To-Date
Page 8 of 9
SIA Engineering
Malaysia
Maybank Investment Bank Berhad (A Participating Organisation of Bursa Malaysia Securities Berhad) 33rd Floor, Menara Maybank, 100 Jalan Tun Perak, 50050 Kuala Lumpur Tel: (603) 2059 1888; Fax: (603) 2078 4194 Stockbroking Business: Level 8, Tower C, Dataran Maybank, No.1, Jalan Maarof 59000 Kuala Lumpur Tel: (603) 2297 8888 Fax: (603) 2282 5136
Singapore
Maybank Kim Eng Securities Pte Ltd Maybank Kim Eng Research Pte Ltd 9 Temasek Boulevard #39-00 Suntec Tower 2 Singapore 038989
Hong Kong
Kim Eng Securities (HK) Ltd Level 30, Three Pacific Place, 1 Queen’s Road East, Hong Kong
Tel: (852) 2268 0800 Fax: (852) 2877 0104
Philippines
Maybank ATR Kim Eng Securities Inc. 17/F, Tower One & Exchange Plaza Ayala Triangle, Ayala Avenue Makati City, Philippines 1200
Tel: (63) 2 849 8888 Fax: (63) 2 848 5738
South Asia Sales Trading
Kevin FOY
[email protected] Tel: (65) 6336-5157 US Toll Free: 1-866-406-7447
Thailand
Maybank Kim Eng Securities (Thailand) Public Company Limited 999/9 The Offices at Central World, 20th - 21st Floor, Rama 1 Road Pathumwan, Bangkok 10330, Thailand Tel: (66) 2 658 6817 (sales) Tel: (66) 2 658 6801 (research)
Maybank Kim Eng Securities (London) Ltd 6/F, 20 St. Dunstan’s Hill London EC3R 8HY, UK
Tel: (44) 20 7621 9298 Dealers’ Tel: (44) 20 7626 2828 Fax: (44) 20 7283 6674
Tel: (65) 6336 9090 Fax: (65) 6339 6003
London
Indonesia
PT Maybank Kim Eng Securities Plaza Bapindo Citibank Tower 17th Floor Jl Jend. Sudirman Kav. 54-55 Jakarta 12190, Indonesia
Vietnam
In association with
Maybank Kim Eng Securities JSC 1st Floor, 255 Tran Hung Dao St. District 1 Ho Chi Minh City, Vietnam Tel : (84) 844 555 888 Fax : (84) 838 38 66 39
Maybank Kim Eng Securities USA Inc 777 Third Avenue, 21st Floor New York, NY 10017, U.S.A. Tel: (212) 688 8886 Fax: (212) 688 3500
India
Kim Eng Securities India Pvt Ltd 2nd Floor, The International 16, Maharishi Karve Road, Churchgate Station, Mumbai City - 400 020, India Tel: (91).22.6623.2600 Fax: (91).22.6623.2604
Tel: (62) 21 2557 1188 Fax: (62) 21 2557 1189
New York
Saudi Arabia In association with
Anfaal Capital Villa 47, Tujjar Jeddah Prince Mohammed bin Abdulaziz Street P.O. Box 126575 Jeddah 21352 Tel: (966) 2 6068686 Fax: (966) 26068787
North Asia Sales Trading
Eddie LAU
[email protected] Tel: (852) 2268 0800 US Toll Free: 1 866 598 2267
www.maybank-ke.com | www.maybank-keresearch.com
7 October 2013
Page 9 of 9