a r t ic l e s
Transitions in neural oscillations reflect prediction errors generated in audiovisual speech
© 2011 Nature America, Inc. All rights reserved.
Luc H Arnal1, Valentin Wyart2 & Anne-Lise Giraud1,3 According to the predictive coding theory, top-down predictions are conveyed by backward connections and prediction errors are propagated forward across the cortical hierarchy. Using MEG in humans, we show that violating multisensory predictions causes a fundamental and qualitative change in both the frequency and spatial distribution of cortical activity. When visual speech input correctly predicted auditory speech signals, a slow delta regime (3–4 Hz) developed in higher-order speech areas. In contrast, when auditory signals invalidated predictions inferred from vision, a low-beta (14–15 Hz) / high-gamma (60–80 Hz) coupling regime appeared locally in a multisensory area (area STS). This frequency shift in oscillatory responses scaled with the degree of audio-visual congruence and was accompanied by increased gamma activity in lower sensory regions. These findings are consistent with the notion that bottom-up prediction errors are communicated in predominantly high (gamma) frequency ranges, whereas top-down predictions are mediated by slower (beta) frequencies. Predictive coding and other models of perception based upon hierarchical Bayesian inference1–3 assume that neural representations are optimized to reduce ‘prediction error’. This error is classically defined as the difference between the representations (neuronal activity) at each cortical level and the ‘predictions’ or expectations arising from the level above or cascading back from higher cognitive levels. Hence, the better the prediction, the smaller the prediction error. This reciprocal relationship between predictions and prediction errors is overtly or covertly exploited by several experimental paradigms (for example, oddball, violation and adaptation paradigms) that rely on the contrast between neural responses to anticipated and unexpected stimuli and that report stronger responses to stimuli that are not or are incorrectly anticipated. There is also growing evidence that perception involves coordinated slow and fast brain oscillations, typically theta/gamma nesting4–6, and new hypotheses suggest that bottom-up information could be propagated forward on a gamma frequency channel from superficial cortical layers, whereas top-down information would be propagated backward on a beta frequency channel from deep cortical layers7. How the coding of cognitive content and properties of electrical signaling articulate with each other is unclear. Here we set out to experimentally address whether the rate and distribution of neural activity depends on correct or incorrect anticipation of the stimulus, and whether sensory predictions and prediction errors are conveyed using different frequency channels. Audio-visual speech provides an ideal setting in which to test these hypotheses8. Our experimental paradigm capitalizes on a natural ~150-ms temporal lag between the onset of facial movements and vocal chord vibration that naturally occurs when we speak9. This lag allows the observer to synthesize phonological predictions before auditory
onset on the basis of visual information. This also gives the experimenter the opportunity to temporally distinguish the neural effects related to these visually induced predictions and the prediction errors that emerge during audio-visual integration if predictions are invalidated. Here, sensory prediction errors were induced experimentally by violating the congruence between visual and auditory information. We also exploited the specificity with which visual input predicts auditory input to create a gradient of perceived incongruence8–10. We thus induced graded prediction errors by varying audio-visual congruence and expected them to be manifest at the neural level in the interaction between the amount of predictive information conveyed by the visual input (predictiveness) and the validity of this information with respect to incoming auditory input (audio-visual congruence). We quantified this ‘predictiveness-by-validity’ interaction on neuromagnetic eventrelated fields (ERFs) measured with magnetoencephalography (MEG) and determined the oscillatory processes underlying prediction error using time-frequency analyses of the MEG data. We report qualitative differences in neural dynamics as a function of the validity of visual predictions; that is, the amount of prediction error. Our central hypothesis was that there should be a fundamental and qualitative change in neuronal message-passing when sensory predictions are invalidated. In particular, audiovisual mismatch detection should enhance coordinated beta and gamma activities associated with the propagation of revised predictions and the redeployment of new prediction errors, respectively. Whereas we observed distributed slow delta activity in higher-level cortical areas during the perception of congruent stimuli, faster local cortical activity replaced these slow interactions when predictions from visual modality were invalidated by auditory inputs. In agreement with our hypothesis, beta activity appeared in regions where visual and auditory information
1Inserm
U960 - École Normale Supérieure, Paris, France. 2Université Pierre et Marie Curie - Paris 6, Centre de Recherche de l’Institut du Cerveau et de la MoëlleEpinière, Centre National de la Recherche Scientifique Unité Mixte de Recherche 7225, Inserm U975, Paris, France. 3Centre de Neuroimagerie de Recherche, Hôpital de la Pitié-Salpêtrière, Paris, France. Correspondence should be addressed to A.-L.G. (
[email protected]). Received 20 January; accepted 15 March; published online 8 May 2011; doi:10.1038/nn.2810
nature NEUROSCIENCE VOLUME 14 | NUMBER 6 | JUNE 2011
797
converge—that is, where multisensory predictions are generated— whereas gamma activity was seen in lower sensory cortices where prediction errors emerge and are propagated forward. RESULTS We presented 15 subjects with stimuli in one of three conditions: videos (audio-visual: AV condition) of a speaker pronouncing the syllables /pa/, / a/, /la/, /ta/, /ga/ and /fa/ (International Phonetic Alphabet notation); an auditory track of these videos combined with a still face (auditory: A condition); or a mute visual track (visual: V condition). The videos could be either natural or a random combination of auditory and visual tracks, creating conditions in which auditory and visual tracks were congruent (AVc condition) and ones in which they were incongruent (AVi condition; see Online Methods and Supplementary Fig. 1). Incongruent combinations yielding fusion illusory percepts—that is, McGurk stimuli—were excluded 8,11. Subjects performed an unrelated target detection task on the syllable /fa/ that was presented in A, V or AVc form in 13% of the trials (97% correct detection). These trials were subsequently excluded from the analyses. The five other syllables were chosen because they yielded graded recognition accuracy when presented visually (Fig. 1a), resulting from an increasing predictiveness10. The phonological prediction conveyed by mouth movements (visemes) varies in specificity depending on the pronounced syllable. Typically, syllables beginning with a consonant that is formed at the front of the mouth (/p/, /m/) convey a more specific prediction than those formed at the back (/g/, /k/, /r/, /l/)8. Our second experimental factor pertained to the validity of the visual prediction with respect to the auditory input. Physically, the audio-visual stimuli could be either congruent (valid prediction) or incongruent (invalid prediction), while perceptually, the level of incongruence varied gradually as a function of visual predictiveness: for example, the strongest perceived incongruence was reported for the most predictive visemes in incongruent stimuli (see Supplementary Data). Predictiveness-by-validity interaction was tested in several different data features to establish when and where in the brain prediction errors were expressed. We used the amplitude of ERFs over auditory regions to produce statistics as a function of predictiveness and validity across the peri-stimulus time course (Supplementary Fig. 2a). This indicates 798
a
b ERF amplitude (fT)
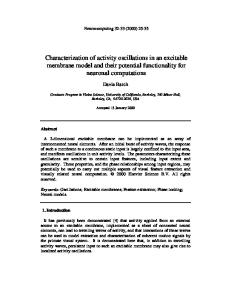
Figure 1 Interaction between predictiveness and validity in ERFs. (a) Predictiveness was assessed behaviorally as the recognition rate of syllables presented in the visual (V) condition. Normalized predictiveness of each syllable was then correlated with experimental measures. (b) Main ERF components evoked on auditory sensors by the presentation of AVc (dashed line) and AVi (solid line) stimuli. Gray surfaces between dashed and solid lines delimit time periods showing a main effect of validity (**P < 0.01). (c) Correlations between ERF (AV – A) amplitude and predictiveness (predict.) were computed at each time bin, separately for AVc (dashed line) and AVi (solid line) conditions. ERFs and correlation lines are locked to visual onset on the left of the vertical double bar, and to on auditory onset on its right (see Online Methods). Windows 1, 2 and 3 (shaded columns in b and c) indicate the time periods where correlation is significant (signed r2). Black horizontal lines delimit statistical threshold P < 0.01 (**P < 0.01, *P < 0.05). In window 1, the visually evoked response increased with visual predictiveness but was not affected by prediction validity (interaction, P = 0.93). In window 2, the decrease in M100A was accelerated proportionally to visual predictiveness, confirming that visual input sped up8,10 and ‘sharpened’48 early auditory evoked responses proportionally to its informational value, yet without prediction error computation (nonsignificant interaction in window 2; P = 0.52). Prediction errors (visual predictiveness-by-validity interaction) emerged in window 3. Gray surfaces between dashed and solid lines in window 3 delimit significant interaction, P < 0.001.
Visual syllables
/ga/ V
/ta/ V
/la/ V
/ a/ V
/pa/ V
Normalized recognition rates (mean ± s.d.)
–1.61 ± 0.18
0.01 ± 0.38
0.18 ± 0.39
0.7 ± 0.16
0.72 ± 0.15
M100A
300
AVi AVc
**
M300
200
** **
M170V
**
100
c
1 0.2
2 Predict. × ERF (r )
© 2011 Nature America, Inc. All rights reserved.
a r t ic l e s
0.1
2
3
** **
*
*
*
P < 0.01
0 P < 0.01
–0.1 –0.2 –0.1
** ** 0
0.1
0.2
0.3
0.4
0.5
0.6
Time (s)
at which time points ERFs are modulated by (i) visual prediction validity (main effect of audio-visual congruence), (ii) visual predictiveness separately under valid and invalid conditions and (iii) prediction errors (predictiveness-by-validity interaction). We went on to characterize the specific time-frequency patterns underlying ERF amplitude variations reflecting prediction error, by exploring time-frequency data in a manner constrained by the time course of ERFs. This methodological approach exploits ERF amplitude variability across stimuli to specifically probe time-frequency phase-locking and power effects that are sensitive to the experimental factors (Supplementary Fig. 2b). This method thus enhances the temporal sensitivity of the timefrequency analysis by revealing stimulus-induced and/or phase-locked oscillatory patterns underlying ERF modulations (see ref. 12, Online Methods and Supplementary Fig. 2b). This ultimately permits us to precisely identify the key frequencies, phase-locking and nesting principles that specifically underlie the expression of prediction error. Finally, to establish the regional specificity of these findings, we broadened the correlations between neuromagnetic indices of prediction error and time-frequency responses to all MEG channels. Late ERF oscillatory regime reflects prediction errors Our first analysis step was to correlate the amplitude of ERFs (AV – A conditions that is, audio-visual integration index; see Online Methods) in response to each of the five syllables with their corresponding predictiveness value—that is, the recognition level they yielded when presented as visemes (Fig. 1a)—over the whole peri-stimulus time course (−100 to 600 ms relative to auditory onset; Supplementary Fig. 2a). The first two ERF components evoked by audio-visual syllables on the sensors that responded best to auditory stimuli corresponded to feed-forward visual and auditory responses13. We refer to these components as M170V and M100A, respectively. Reflecting the natural delay between visual and auditory onsets, M170V and M100A were separated by approximately 100 ms. A main effect of visual prediction validity (audio-visual congruence) was detected after the M100A peak in four distinct ~20 ms time windows (Fig. 1b). Critically, we detected an effect of predictiveness (P < 0.01; Fig. 1b,c) on M170V preceding VOLUME 14 | NUMBER 6 | JUNE 2011 nature NEUROSCIENCE
a r t ic l e s
Beta and delta regimes show distinct spatial dynamics To check whether these two distinct phase-locking modes were implemented through spatially distinct neural networks, we broadened the analysis to the whole scalp surface while focusing on the two timefrequency clusters reflecting the difference between valid and invalid conditions (Fig. 2a). We computed Pearson correlations at each sensor, between their PLF values in these time-frequency windows and the ERF amplitude of auditory sensors (Supplementary Fig. 2b). Scalp topographies of correlation values showed diverging spatial patterns of stimulus phase-locked oscillatory activity depending on the validity of visual prediction (Fig. 2c). When prediction was valid, phaselocked delta activity (3–4 Hz) emerged across regions usually involved in high-order language processing—namely, the ventral temporal cortex and the angular gyrus14 (Fig. 2c, left). When visual prediction was invalid, the phase-locked pattern in the beta band (14–15 Hz) remained nature NEUROSCIENCE VOLUME 14 | NUMBER 6 | JUNE 2011
© 2011 Nature America, Inc. All rights reserved.
PLF freq. (Hz)
AVc
20
2
r corr.
0.2 0.1
10
10
2
2
0 –0.1
b
***
0.2 0 –0.2 0
c
AVi
20
2
auditory onset (window 1) and on M100A (window 2) in both AVc and AVi conditions (Fig. 1c). The parametric effect on M100A responses confirms that the independently assessed behavioral gradient was recovered by early physiological signals despite an unrelated task instruction. A further late predictiveness effect was observed in AVi stimuli only, at around 350–500 ms, during the M300 component (window 3). Accordingly, the predictiveness-by-validity interaction emerged within this third window (Fig. 1c; interaction, P < 0.001). These data confirm that prediction errors only occurred late, after cross-modal prediction had emerged at cortical levels higher than auditory cortex, presumably at the superior temporal sulcus (STS) level and possibly above. We addressed a potential divergence in neural dynamics between the processing of correctly and incorrectly anticipated stimuli by comparing the time-frequency structure of evoked responses in valid and invalid conditions (see Online Methods). Consistent with the ERF data, timefrequency correlation maps (Fig. 2a) show that whereas AVc and AVi conditions evoked similar early (−100 to 300 ms) phase-locking factor (PLF) increases in the delta–theta band (2–9 Hz), diverging patterns occurred during the last time window (350–550 ms). When visual prediction was valid, the amplitude of late ERFs correlated with an increase in slow delta (3–4 Hz) phase-locking (Fig. 2a,b, left panel, P < 0.001; interaction, P = 0.04) and a decrease in theta phase-locking. Conversely, when the prediction was invalidated by auditory input (Fig. 2a,b, right panel), ERF variations were associated with an increase in PLF in a low-beta band (14–15 Hz, 400–550 ms, P = 0.045; interaction, P = 0.13) and a PLF decrease in the theta range (5–6 Hz, 350–500 ms, P = 0.018; interaction, P = 0.05). The departure of predictiveness-dependent phase-locking from the theta band to adopt either a slower regime when predictions were valid or a faster one when they were not supports our hypothesis that visual prediction validity determines a transition in neural dynamics.
a
r
Figure 2 Late low-frequency oscillatory patterns depend on the validity of inferences. (a) Correlation strength (signed r2) between ERF amplitude and PLF of low (2–20 Hz) frequency (freq.) bands. Time is expressed relative to auditory stimulus onset. Contours delimit statistical thresholds of P < 0.05, P < 0.01 and P < 0.001. Arrows indicate time-frequency effects of interest, subsequently used for topographical rendering (see c). (b) Significance of the correlation (corr.) strength (cluster corrected for multiple comparisons) across time in selected frequency bands, in AVc condition (delta–theta (350–500 ms, 3–4 Hz)) and in AVi condition (delta– theta (350–500 ms, 5–6 Hz) and beta (400–550, 14–15 Hz)). Thick lines indicate cluster P < 0.05 across time (***P < 0.001, *P < 0.05). Gray shading, mean and s.d. of the corresponding null distributions across 1,000 permutations. (c) Topographical renderings obtained by computing Pearson correlations between amplitude of late ERFs (on auditory sensors) and PLF values of selected time and frequency windows of interest (see a and b) at each sensor for AVc (left) and AVi (right) conditions.
*** 0.2 0.4 Time (s)
–0.2
3–4 Hz
0.6
0.2 0 –0.2
*** 0
*
0.2 0.4 Time (s)
*
5–6 Hz 14–15 Hz
0.6
confined to the posterior middle temporal region (Fig. 2c, right), presumably the STS, which is often described as a convergence point of visual and auditory (speech) inputs15–17. The location of this effect converges with functional magnetic resonance imaging results obtained in an independent study in which we also probed predictiveness-by-validity interaction using a similar experimental design (Supplementary Data and Supplementary Figs. 3 and 4). The transition in frequency regime when predictions were invalidated was thus associated with a marked change in response topography, presumably reflecting a change in message-passing mode emphasizing top-down processing. Prediction invalidation increases beta PLF and gamma power An important implication of predictive coding1,3 is that the brain dedicates more resources to unexpected than to anticipated events. As highfrequency oscillations are energetically more demanding than slow oscillations18–20, we checked whether oscillations in the gamma range could explain late ERF amplitude modulations associated with prediction errors (window 3 in Fig. 1b,c). This analysis hence focused on late prediction error effects, 350 ms after auditory onset. We performed the same correlation analysis as above, using the sensors (n = 10) that showed the strongest validity effect at the group level. These sensors were situated over posterior superior and middle temporal regions. Whereas low-frequency (<30 Hz) phase-locking and power correlation maps showed the same patterns for these sensors as for ‘auditory’ sensors, we detected several clusters showing significant correlations between ERF amplitude and high-frequency power. The largest effect occurred in the AVi condition between 350 and 500 ms in the 70–90 Hz range (Fig. 3a, P < 0.001; interaction, P = 0.01). Prediction invalidation hence increased late gamma power. We further tested for a possible coordinated activity (see Online Methods) between low-frequency phase-locking and high-frequency gamma power (Fig. 3b). When the prediction was invalid (AVi), late (350–500 ms) mid- and high-gamma power distinctly correlated with the two low-frequency phase-locking patterns shown in the right panels in Figure 2a,b. Prediction error resulted in (i) a joint increase in mid-gamma (60–70 Hz) power and PLF in low-beta frequencies (14–15 Hz) suggestive of oscillation hierarchical coupling (nesting)4–6 and (ii) an increase in high-gamma (70–90 Hz) power with a PLF decrease in the theta band (5–6 Hz) (Fig. 3b). The transition to a beta phase-locked mode likely gated an increase in mid-gamma oscillation power, whereas the increase in high-gamma power was accompanied by a dissolution of phase-locked oscillations in the theta band. Finally, to address whether high-gamma power modulations in the AVi condition reflected the degree of prediction error, and if so where this 799
a r t ic l e s
800
© 2011 Nature America, Inc. All rights reserved.
80
80
60
60
40
40 0.2 0 –0.2
b
0.6
2
0.4 0.2 Time (s)
c
5–6 Hz 14–15 Hz
AVi (350–500 ms)
120
Power freq. (Hz)
100 80
0
*
60
0
–0.1 –0.2
*** 0
0.2 0.4 Time (s)
70–90 Hz 0.6
0.1
0.1
*
0.2 0.1
r corr.
Power freq. (Hz)
100
0
AVi
120
100
–0.1
0 r2
DISCUSSION Our results support theoretical models assuming that the brain uses prediction estimation procedures to construct percepts1,3,26–28 and control action29. In sensory perception, the concept is that the brain continuously uses available information to update internal estimates that are used to predict the subsequent input. In this view, the information that is propagated forward reflects the difference between incoming input and expectation (that is, what remains to be explained), whereas predictions are propagated backward. In our experimental setting, the earlier arrival of visual signals allows the generation of predictions, which are then confronted with incoming auditory signals8. Consistent with predictive models, detectable correlates of prediction error were confined to late responses (~350 ms). This is because they are most strongly manifest after auditory and visual signals have converged on the STS, where phonological predictions generated on the basis of the visual input are effective (see Supplementary Data). We hypothesized that the invalidation of predictions would induce a qualitative shift in neural dynamics that determines the messagepassing mode. As expected, in the case of visual prediction validation, we observed stimulus-locked slow neural activity in a large, highorder integrative network. In contrast, visual prediction invalidation induced the dissolution of distributed low-frequency oscillations and the emergence of higher-frequency activity in the STS. Consistent with previous studies19,20, this increased high-frequency activity colocalized with an increase in blood oxygenation level–dependent (BOLD) signal (Supplementary Fig. 4). The oscillatory pattern involved low-beta and gamma activity locally in the STS and high-gamma
AVc
120
r2
occurred at the scalp, we averaged power values in the time-frequency window defined by the interaction described above (350–500 ms, 70–90 Hz; Fig. 3a) and computed Pearson correlations with visual predictiveness at each sensor. The highest correlation values were visible over the left occipital and temporal sensors, mainly distributed between early visual areas, auditory areas and the STS (Fig. 3c). When visual prediction was both strong and invalid, high-gamma power increased in low-level sensory regions. The increase in beta phase-locking in the STS was seen conjointly with an increase in gamma activity locally and in lower-tier sensory areas. This supports the proposal that the beta range is involved in inter-areal coupling17,21–23, and more specifically used in feedback projections24,25, and further suggests that the gamma range serves to propagate prediction error forward.
a
r2
Figure 3 Late high-frequency activity reflects prediction error computation. (a) Correlation between ERF amplitude over sensors showing a significant effect of validity (located over the STS; see Online Methods) and power of high (30–120 Hz) frequency (freq.) bands for AVc (left) and AVi (right) stimuli. Black arrows indicate time and frequency windows of interest used for subsequent analysis. Bottom right, corrected r2 correlations (corr.) for the frequency bands of clusters of interest (AVi: high-gamma (350–500 ms, 70–90 Hz); thick line indicates cluster P < 0.05; ***P < 0.001). (b) Correlation strength between high-frequency (30–120 Hz) power and low-frequency (2–30 Hz) PLF for AVi stimuli (averaged across time between 350 and 500 ms). Contours delimit statistical thresholds of P < 0.05, P < 0.01 and P < 0.001. Significant theta/gamma and low-beta/gamma correlations only occurred in the invalid condition. Right, corrected r2 for the frequency bands of selected clusters of interest (theta (5–6 Hz) and beta (14–15 Hz)). Gray shading, mean and s.d. of corresponding null distributions across 1,000 permutations (thick line indicates cluster P < 0.05; *P < 0.05). (c) Scalp topography of power × predictiveness correlation strength for AVi condition. Correlation strength (signed r 2) between normalized predictiveness rates and power, averaged across time (350–500 ms) and frequency (70–90 Hz) windows, were computed at each sensor.
–0.1
40 2
10
20
30 –0.1
PLF freq. (Hz)
0.1
r 2 corr.
(70–90 Hz) activity in early auditory and visual processing systems. In other words, we observed a transition from a smooth distributed flow of information to a fast, local processing, presumably aiming at (i) resolving the conflict at the stage where audio-visual phonological incongruence is registered by forming new plausible sensory predictions and (ii) estimating these predictions in lower processing stages. Superficial layers of the cortex are the predominant source of gamma oscillations30, and the notion that prediction error is indexed by increased gamma power in lower-tier sensory areas is therefore consistent with the proposal that superficial pyramidal cells, which originate forward projections in cortical hierarchies, report prediction error1 (Supplementary Fig. 5). That low-beta activity increased in the STS, a higher hierarchical stage, also fits with the idea that deeper layer pyramidal cells, notionally representational units originating backward predictions31, are associated with beta activity7,24,25,32. Given that superficial pyramidal cells receive their input from layer 4 and project back on deep layers33, an increase in prediction error enhancing superficial gamma activity likely strengthens connections across superficial and deep cortical layers. This coupling between superficial and deep layers generates a low-beta rhythm (15 Hz) that changes the nature of message-passing34,35. Functionally, the emergence of this common rhythm across superficial and deep layers could reflect (i) the convergence of error and representation units on a new representational solution (prediction error minimization) and (ii) top-down propagation of this solution to hierarchically lower regions. A slower frequency channel for top-down than for bottom-up signal propagation could reflect that top-down predictions result from the accumulation of bottom-up prediction errors. The emergence of low-beta activity (14–15 Hz) in the STS and increased high-gamma activity locally and in lower-tier sensory areas could signal the redeployment of prediction errors due to alternative prediction testing operations (Supplementary Fig. 5). Whereas beta and high gamma (80 Hz) activity (and BOLD response) indexed prediction error and its resolution, slower delta and theta oscillatory activity signaled further processing of correctly anticipated stimuli. Delta (3–4 Hz) activity in our data localized to distributed lexico-semantic areas, suggesting that late slow, stimulus-locked oscillatory activity reflects higher stages of speech processing36,37 and stabilizes sensory representations38,39. It is unclear how slow activity precisely relates to perception. Perception is often thought to rely on synchronization of focal neuronal assemblies in the gamma range40–42. Delta and theta activity, VOLUME 14 | NUMBER 6 | JUNE 2011 nature NEUROSCIENCE
a r t ic l e s
© 2011 Nature America, Inc. All rights reserved.
by contrast, has been suggested to shape gamma activity in superficial cortical layers43 that propagate information to the next hierarchical stage44. Accordingly, we observed that gamma activity related to prediction error was accompanied by a decrease in theta phase-locking (Fig. 3b). The observation that mid- and high-gamma activity were related to the phase consistency of beta and theta activity, respectively, extends the ideas that gamma frequency variations reflect information routing32,34,45,46 and that message-passing is indexed by specific hierarchical combinations of slow and high frequencies (low/high frequency ratio)47. The current data demonstrate that violating intermodal expectations changes the neural dynamics of slow (delta and theta) brain activity, and increases the coordination between local low-beta and high-gamma oscillatory activity. Our data suggest that this transition occurs in brain regions where audio-visual predictions are likely updated (STS) and new prediction errors generated (auditory and visual cortices). These findings suggest a tight relationship between particular high-frequency modes of activity and prediction errors, and suggest that slow cortical activity contains a previously unappreciated wealth of information that reflects perceptual expectations. Methods Methods and any associated references are available in the online version of the paper at http://www.nature.com/natureneuroscience/. Note: Supplementary information is available on the Nature Neuroscience website. Acknowledgments We thank the staff of the Centre de Neuroimagerie de Recherche and the Magnetoencephalography Center (Hôpital de la Pitié-Salpêtrière), in particular J.-D. Lemarechal, A. Ducorps and D. Schwarz, and the colleagues who commented on this work: V. van Wassenhove, B. Morillon, A. Hyafil, S. Denève, L. Melloni, F. Griffon, A. Kleinschmidt, E. Koechlin, B. Fischer, K. Friston and C. TallonBaudry. This work was supported by the Centre National de la Recherche Scientifique (A.-L.G.) and the Fondation Fyssen (V.W.). AUTHOR CONTRIBUTIONS Conceived and designed the experiments: L.H.A., A.-L.G.; performed the experiments: L.H.A.; analyzed the data: L.H.A., V.W., A.-L.G.; contributed to analysis tools: L.H.A., V.W.; wrote the paper: L.H.A., V.W., A.-L.G. COMPETING FINANCIAL INTERESTS The authors declare no competing financial interests. Published online at http://www.nature.com/natureneuroscience/. Reprints and permissions information is available online at http://www.nature.com/ reprints/index.html. 1. Friston, K. A theory of cortical responses. Phil. Trans. R. Soc. Lond. B 360, 815–836 (2005). 2. Mumford, D. On the computational architecture of the neocortex. II. The role of cortico-cortical loops. Biol. Cybern. 66, 241–251 (1992). 3. Rao, R.P. & Ballard, D.H. Predictive coding in the visual cortex: a functional interpretation of some extra-classical receptive-field effects. Nat. Neurosci. 2, 79–87 (1999). 4. Buzsáki, G. & Draguhn, A. Neuronal oscillations in cortical networks. Science 304, 1926–1929 (2004). 5. Canolty, R.T. et al. High gamma power is phase-locked to theta oscillations in human neocortex. Science 313, 1626–1628 (2006). 6. Lakatos, P. et al. An oscillatory hierarchy controlling neuronal excitability and stimulus processing in the auditory cortex. J. Neurophysiol. 94, 1904–1911 (2005). 7. Wang, X.J. Neurophysiological and computational principles of cortical rhythms in cognition. Physiol. Rev. 90, 1195–1268 (2010). 8. van Wassenhove, V., Grant, K.W. & Poeppel, D. Visual speech speeds up the neural processing of auditory speech. Proc. Natl. Acad. Sci. USA 102, 1181–1186 (2005). 9. Chandrasekaran, C., Trubanova, A., Stillittano, S., Caplier, A. & Ghazanfar, A.A. The natural statistics of audiovisual speech. PLOS Comput. Biol. 5, e1000436 (2009). 10. Arnal, L.H., Morillon, B., Kell, C.A. & Giraud, A.-L. Dual neural routing of visual facilitation in speech processing. J. Neurosci. 29, 13445–13453 (2009). 11. McGurk, H. & MacDonald, J. Hearing lips and seeing voices. Nature 264, 746–748 (1976). 12. Shah, A.S. et al. Neural dynamics and the fundamental mechanisms of event-related brain potentials. Cereb. Cortex 14, 476–483 (2004).
nature NEUROSCIENCE VOLUME 14 | NUMBER 6 | JUNE 2011
13. Garrido, M.I., Kilner, J.M., Kiebel, S.J., Stephan, K.E. & Friston, K.J. Dynamic causal modelling of evoked potentials: a reproducibility study. Neuroimage 36, 571–580 (2007). 14. Hickok, G. & Poeppel, D. The cortical organization of speech processing. Nat. Rev. Neurosci. 8, 393–402 (2007). 15. Beauchamp, M.S., Lee, K.E., Argall, B.D. & Martin, A. Integration of auditory and visual information about objects in superior temporal sulcus. Neuron 41, 809–823 (2004). 16. Ghazanfar, A.A., Chandrasekaran, C. & Logothetis, N.K. Interactions between the superior temporal sulcus and auditory cortex mediate dynamic face/voice integration in rhesus monkeys. J. Neurosci. 28, 4457–4469 (2008). 17. Kayser, C. & Logothetis, N.K. Directed interactions between auditory and superior temporal cortices and their role in sensory integration. Front. Integr. Neurosci. 3, 7 (2009). 18. Koch, S.P., Werner, P., Steinbrink, J., Fries, P. & Obrig, H. Stimulus-induced and state-dependent sustained gamma activity is tightly coupled to the hemodynamic response in humans. J. Neurosci. 29, 13962–13970 (2009). 19. Mukamel, R. et al. Coupling between neuronal firing, field potentials, and FMRI in human auditory cortex. Science 309, 951–954 (2005). 20. Niessing, J. et al. Hemodynamic signals correlate tightly with synchronized gamma oscillations. Science 309, 948–951 (2005). 21. Engel, A.K. & Fries, P. Beta-band oscillations—signalling the status quo? Curr. Opin. Neurobiol. 20, 156–165 (2010). 22. von Stein, A., Chiang, C. & Konig, P. Top-down processing mediated by interareal synchronization. Proc. Natl. Acad. Sci. USA 97, 14748–14753 (2000). 23. Womelsdorf, T. et al. Modulation of neuronal interactions through neuronal synchronization. Science 316, 1609–1612 (2007). 24. Sejnowski, T.J. & Paulsen, O. Network oscillations: emerging computational principles. J. Neurosci. 26, 1673–1676 (2006). 25. Wróbel, A. Beta activity: a carrier for visual attention. Acta Neurobiol. Exp. (Warsz.) 60, 247–260 (2000). 26. Neisser, U. Cognitive Psychology (Appleton-Century-Crofts, New York, 1967). 27. Poeppel, D., Idsardi, W.J. & van Wassenhove, V. Speech perception at the interface of neurobiology and linguistics. Phil. Trans. R. Soc. Lond. B 363, 1071–1086 (2008). 28. Stevens, K.N. & Halle, M. Remarks on analysis by synthesis and distinctive features. in Models for the Perception of Speech and Visual Form: Proceedings of a Symposium (ed. Wathen-Dunn, W.) 88–102 (MIT Press, Cambridge, Massachusetts, USA, 1967). 29. Wolpert, D.M., Ghahramani, Z. & Jordan, M.I. An internal model for sensorimotor integration. Science 269, 1880–1882 (1995). 30. Roopun, A.K. et al. Period concatenation underlies interactions between gamma and beta rhythms in neocortex. Front. Cell. Neurosci. 2, 1 (2008). 31. Spratling, M.W. Reconciling predictive coding and biased competition models of cortical function. Front. Comput. Neurosci. 2, 4 (2008). 32. Buschman, T.J. & Miller, E.K. Top-down versus bottom-up control of attention in the prefrontal and posterior parietal cortices. Science 315, 1860–1862 (2007). 33. George, D. & Hawkins, J. Towards a mathematical theory of cortical micro-circuits. PLOS Comput. Biol. 5, e1000532 (2009). 34. Kopell, N., Kramer, M.A., Malerba, P. & Whittington, M.A. Are different rhythms good for different functions? Front. Hum. Neurosci. 4, 187 (2010). 35. Kramer, M.A. et al. Rhythm generation through period concatenation in rat somatosensory cortex. PLOS Comput. Biol. 4, e1000169 (2008). 36. Hagoort, P., Hald, L., Bastiaansen, M. & Petersson, K.M. Integration of word meaning and world knowledge in language comprehension. Science 304, 438–441 (2004). 37. Hald, L.A., Bastiaansen, M.C. & Hagoort, P. EEG theta and gamma responses to semantic violations in online sentence processing. Brain Lang. 96, 90–105 (2006). 38. Kayser, C., Montemurro, M.A., Logothetis, N.K. & Panzeri, S. Spike-phase coding boosts and stabilizes information carried by spatial and temporal spike patterns. Neuron 61, 597–608 (2009). 39. Schroeder, C.E. & Lakatos, P. The gamma oscillation: master or slave? Brain Topogr. 22, 24–26 (2009). 40. Engel, A.K., Fries, P. & Singer, W. Dynamic predictions: oscillations and synchrony in top-down processing. Nat. Rev. Neurosci. 2, 704–716 (2001). 41. Fries, P., Roelfsema, P.R., Engel, A.K., Konig, P. & Singer, W. Synchronization of oscillatory responses in visual cortex correlates with perception in interocular rivalry. Proc. Natl. Acad. Sci. USA 94, 12699–12704 (1997). 42. Wyart, V. & Tallon-Baudry, C. Neural dissociation between visual awareness and spatial attention. J. Neurosci. 28, 2667–2679 (2008). 43. Schroeder, C.E. & Lakatos, P. Low-frequency neuronal oscillations as instruments of sensory selection. Trends Neurosci. 32, 9–18 (2009). 44. Rockland, K.S. & Pandya, D.N. Laminar origins and terminations of cortical connections of the occipital lobe in the rhesus monkey. Brain Res. 179, 3–20 (1979). 45. Akam, T. & Kullmann, D.M. Oscillations and filtering networks support flexible routing of information. Neuron 67, 308–320 (2010). 46. Colgin, L.L. et al. Frequency of gamma oscillations routes flow of information in the hippocampus. Nature 462, 353–357 (2009). 47. Panzeri, S., Brunel, N., Logothetis, N.K. & Kayser, C. Sensory neural codes using multiplexed temporal scales. Trends Neurosci. 33, 111–120 (2010). 48. Grill-Spector, K., Henson, R. & Martin, A. Repetition and the brain: neural models of stimulus-specific effects. Trends Cogn. Sci. 10, 14–23 (2006).
801
ONLINE METHODS
© 2011 Nature America, Inc. All rights reserved.
Subjects. All subjects gave written informed consent to take part in these studies that were approved of by the local ethics committee (Comité Consultatif de Protection des Personnes se prêtant à des Recherches Biomédicales Paris-Cochin, no. RBM 01-04). Thirty-four healthy French native speakers (right-handed, 19 females; age range, 20–53 years) participated in two behavioral pilot experiments (see Supplementary Data) and two neuroimaging experiments. Nineteen participants took part in the behavioral experiments. Fifteen other participants participated in the MEG experiment. Sixteen people participated in the functional magnetic resonance imaging experiment. Twelve of them participated in both neuroimaging studies. Experimental procedures. Stimuli were excerpts from digital videos of a male speaker pronouncing consonant-vowel syllables (consonant /a/ syllables). Specific stimulus combinations and durations are provided in Supplementary Figure 1. Stimuli were presented using Presentation software (Neurobehavioral Systems). Two preliminary experiments served to (i) establish a behavioral gradient of visual predictiveness, which was subsequently normalized and correlated with MEG signals (see below) and (ii) assess how visual predictiveness interacts with the subjective percept as a function of audio-visual congruence (see Supplementary Data). During the MEG experiment, participants sat at a distance of 1 m from the monitor, the movie (720 × 576 pixels) subtending 10.5° (horizontal) and 8.5° (vertical) visual angles. To prevent eye movements, subjects were asked to fixate a cross and blink only after giving their motor response (after the video). Thus, only few trials (less than 5%) were contaminated by eye movement artifacts and were excluded. Each stimulus was presented 54 times in a pseudo-randomized order. MEG recordings and data processing. Continuous cerebral activity was recorded with a whole-head MEG system (Omega 151, CTF Systems) with 151 axial gradio meters over the scalp, at a sampling rate of 1,250 Hz, and low-pass filtered online at 300 Hz. Data were preprocessed, analyzed and visualized using both in-house software (http://cogimage.dsi.cnrs.fr/logiciels/) and programs written in Matlab (MathWorks). Eye movements and blinks were monitored with four ocular electrodes (Viasys Healthcare) and automatically marked when they deviated by 2 s.d. from the mean. This technique, however, does not detect microsaccades. One supplementary electrode was used to monitor cardiac activity. We rejected off-line trials that were contaminated by eye or head movement, muscle contractions or electromagnetic artifacts. Artifacts related to cardiac activity were eliminated by using a heartbeat trace–matched filter. ERFs and time-frequency signals (phase-locking factor and oscillatory power; see below) were analyzed on a 1,200-ms interval centered on auditory onset (−600 to 600 ms) and baselinecorrected (when appropriate) on the interval −600 to −300 ms (that is, during the presentation of a still face) to ensure that the correction occurred before mouth movement onset. High-pass (0.15 Hz) and low-pass (30 Hz) filters were applied before averaging epochs to obtain ERFs. All signals were smoothed across time using a 20-ms sliding-average window. Time-frequency analyses. Time-frequency wavelet transforms were applied to each trial at each MEG sensor using a family of complex Morlet wavelets (m = 8), resulting in estimates of PLF49 at each time sample and at each frequency between 2 and 30 Hz (frequency step, 1 Hz) and of oscillatory power at each time sample and frequencies ranging from low (2–30 Hz; frequency step, 1 Hz) to high (30–120 Hz; frequency step, 2 Hz). Baseline-corrected power was defined at each time sample and frequency as the increase of oscillatory power relative to baseline in logarithmic units. The log-transformed data were distributed normally, which allowed us to use standard parametric statistical tests (for example, paired t tests and Pearson correlations). Statistical analyses. We first computed Pearson correlations between the magnitude of ERF amplitude and predictiveness (Fig. 1c). To measure the effect of predictiveness in early auditory regions, we extracted the time courses of ERFs from auditory sensors selected individually as the three sensors where M100A amplitude was maximal. Pearson correlations were computed across subjects between visual predictiveness and AV – A ERFs at each time bin of peri-stimulus time, and significance was assumed for P < 0.01. (A detailed description of the correlation method is illustrated in Supplementary Fig. 2a.) To measure the interaction between validity and predictiveness on ERFs, we computed two-sample t tests at
nature NEUROSCIENCE
each time bin of peri-stimulus time by using individual regression slopes of the predictiveness × ERF amplitude correlation (Fig. 1c, significance assumed for P < 0.05). To correct for slight latency differences between the onsets of visual mouth movements and auditory onsets depending on the syllable (see Supplementary Fig. 1b), we separated the analysis into two parts: the first part (Fig. 1b,c, left of the double vertical bar) was synchronized to mouth movement onset, and the second one (Fig. 1b,c, right of the bar) was synchronized to auditory onset. For each syllable, mouth movement onset was detected by measuring the overall color change of pixels (contained in a 321 × 151 pixel rectangle surrounding the center of the mouth) between successive frames of the videos. Mouth movement onset was therefore defined as the time point where the average of pixel colors of a frame deviated 2 s.d. from the previous frame. The M170V component, resulting from averaging neuromagnetic fields time-locked on mouth movement onset, peaked 170 ms after mouth movement onset. Although the M170 response to faces is classically detected in the fusiform cortex, mouth movement onset elicited a specific response in motion-sensitive cortex, previously identified as area MT (V5)10. As there was a delay of about 25 ms between response to visual input in MT (V5) and that in auditory regions, we conclude that the component measured by auditory sensors resulted from direct cross-modal (lateral) input to auditory cortex10 and not from volume conduction. We assume that this component is specifically related to visual mouth movement, as we used a static face as a baseline (see Supplementary Fig. 1). Pearson correlations between ERF amplitude and time-frequency signals (power or PLF) were computed after normalization across experimental conditions (that is, zero mean and unit variance) at the single-subject level to correct for any possible influence of outliers. (A detailed illustration of the correlation method is provided in Supplementary Fig. 2b.) To determine the oscillatory structure underlying modulations of ERF amplitude, we computed correlation maps (Fig. 2a) by correlating time-frequency signals (low-frequency (2–30 Hz) PLF and power, respectively) with the amplitude of ERFs on individually selected auditory sensors. Because ERF-by-power and ERF-by-PLF maps did not qualitatively differ, and because there was no significant cluster above 20 Hz at P < 0.05, we restricted the results presented to ERF-by-PLF maps between 2 and 20 Hz. We then focused on window 3 to determine the spectral signature of the predictivenessby-validity interaction. From AVc and AVi maps in Figure 2a, we selected two time-frequency windows overlapping with window 3 and showing significant positive correlation strengths during time periods exceeding 100 ms (Fig. 2a: AVc 350–500 ms, 3–4 Hz; and AVi 400–550 ms, 14–15 Hz). In each of these time-frequency windows, we measured the interaction between predictiveness and validity by computing two-sample t tests using individual regression slopes between PLF values and predictiveness. This interaction was not significant for the 14–15 Hz cluster shown in Figure 2a (P = 0.13), but was significant when extending the frequency range to 12–15 Hz (P = 0.017), consistent with the spread of the beta-gamma ‘nesting’ cluster shown in Figure 3b. Scalp topographies in Figure 2c were obtained by correlating PLF values (averaged across time and frequency windows of interest) at each sensor of the scalp with the amplitude of ERFs extracted on auditory sensors (averaged across the same time window). The following analysis aimed at determining the high-frequency (30–120 Hz) spectral signature of late prediction error effects. Correlation maps in Figure 3a were obtained by correlating high-frequency power with the amplitude of ERFs extracted from ‘validity sensors’ (the n = 10 occipito-temporal sensors selected at the group level as showing a significant (P < 0.01) main effect of validity on ERF amplitude). The predictiveness-by-validity interaction was measured by computing two-sample t tests using individual regression slopes between predictiveness and power values, averaged across time (350–500 ms) and frequency (70–90 Hz). Hierarchical coupling across frequencies (reflecting nesting) (Fig. 3b) was obtained by computing, for each participant, correlations between low-frequency PLF and high-frequency power, averaged across time (350–500 ms) and frequency (70–90 Hz). Whereas previous studies investigated nesting by looking at power changes in one frequency related to the phase of another frequency, we explored whether low oscillatory activity time- and phase-locked to the stimulus (irrespective of the relative phase value) was consistently associated with power increase. Finally, scalp topography in Figure 3c was obtained by correlating high power values at each sensor, averaged across time (350–500 ms) and frequencies (70–90 Hz), with normalized visual predictiveness of syllables. To assess the strength of the observed effects and correct for type I errors potentially arising from multiple comparisons performed at single time points
doi:10.1038/nn.2810
was computed by comparing the null distribution of cluster-level statistics to the original cluster-level statistic. Cluster-corrected P statistics were computed with respect to the null distribution of the maximum cluster-level statistics: this statistical test hence controls the false alarm rate for all clusters. All reported results and P values were corrected at the cluster level following this procedure, and correlations maps in Figures 2 and 3 only display clusters that reached a corrected P value < 0.05.
49. Tallon-Baudry, C., Bertrand, O., Delpuech, C. & Pernier, J. Stimulus specificity of phase-locked and non-phase-locked 40 Hz visual responses in human. J. Neurosci. 16, 4240–4249 (1996). 50. Maris, E. & Oostenveld, R. Nonparametric statistical testing of EEG- and MEG-data. J. Neurosci. Methods 164, 177–190 (2007).
© 2011 Nature America, Inc. All rights reserved.
within each frequency band, we used nonparametric cluster statistics50. This analysis consists of clustering adjacent time samples that show similar modulations between conditions, or similar correlations with ERFs. As a first step, we selected all time samples in a variable of interest (ERF amplitude, PLF or power in specific frequency bands) whose r2 difference exceeded P < 0.05. Then the selected samples were clustered in connected sets on the basis of temporal adjacency. The cluster selection criterion in Figure 3b was based on the extraction of contiguous samples in PLF frequency bands of interest. A cluster-level statistic was then computed by taking the sum of the r2 values within a cluster. Nonparametric statistics were computed using permutation tests. To assess the null distribution, the syllable labels were randomly intermixed within each subject and the r2 difference was computed and a P < 0.05 threshold applied. This procedure was repeated 1,000 times. For each of these permutations, the maximum cluster-level statistic was extracted. The nonparametric P statistic
doi:10.1038/nn.2810
nature NEUROSCIENCE