Chapter 1 Introduction
Why this book?
R D EV O IE N W O T CO D P IS Y TR IB U
1.1
TE
This section provides a brief overview of the goals and structure of the book.
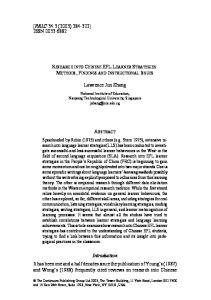
The world has changed for empirical social scientists. The new types of “big data” have generated an entire new research field—that of data science. That world is dominated by computer scientists who have generated new ways of creating and collecting data, developed new analytical and statistical techniques, and provided new ways of visualizing and presenting information. These new sources of data and techniques have the potential to transform the way applied social science is done. Research has certainly changed. Researchers draw on data that are “found” rather than “made” by federal agencies; those publishing in leading academic journals are much less likely today to draw on preprocessed survey data (Figure 1.1). The way in which data are used has also changed for both government agencies and businesses. Chief data officers are becoming as common in federal and state governments as chief economists were decades ago, and in cities like New York and Chicago, mayoral offices of data analytics have the ability to provide rapid answers to important policy questions [233]. But since federal, state, and local agencies lack the capacity to do such analysis themselves [8], they must make these data available either to consultants or to the research community. Businesses are also learning that making effective use of their data assets can have an impact on their bottom line [56]. And the jobs have changed. The new job title of “data scientist” is highlighted in job advertisements on CareerBuilder.com and Burning-glass.com—in the same category as statisticians, economists, and other quantitative social scientists if starting salaries are useful indicators.
1
1. Introduction
100 AER JPE
QJE ECMA
80
60
40
20
0 1990
2000 2010 Year Note: “Pre-existing survey” data sets refer to micro surveys such as the CPS or SIPP and do not include surveys designed by researchers for their study. Sample excludes studies whose primary data source is from developing countries.
R D EV O IE N W O T CO D P IS Y TR IB U
1980
TE
Micro-data Base Articles using Survey Data (%)
2
Figure 1.1. Use of pre-existing survey data in publications in leading journals, 1980–2010 [74]
The goal of this book is to provide social scientists with an understanding of the key elements of this new science, its value, and the opportunities for doing better work. The goal is also to identify the many ways in which the analytical toolkits possessed by social scientists can be brought to bear to enhance the generalizability of the work done by computer scientists. We take a pragmatic approach, drawing on our experience of working with data. Most social scientists set out to solve a realworld social or economic problem: they frame the problem, identify the data, do the analysis, and then draw inferences. At all points, of course, the social scientist needs to consider the ethical ramifications of their work, particularly respecting privacy and confidentiality. The book follows the same structure. We chose a particular problem—the link between research investments and innovation— because that is a major social science policy issue, and one in which social scientists have been addressing using big data techniques. While the example is specific and intended to show how abstract concepts apply in practice, the approach is completely generalizable. The web scraping, linkage, classification, and text analysis methods on display here are canonical in nature. The inference
1.2. Defining big data and its value
3
and privacy and confidentiality issues are no different than in any other study involving human subjects, and the communication of results through visualization is similarly generalizable.
1.2
Defining big data and its value ! This topic is discussed in more detail in Chapter 5.
R D EV O IE N W O T CO D P IS Y TR IB U
TE
There are almost as many definitions of big data as there are new types of data. One approach is to define big data as anything too big to fit onto your computer. Another approach is to define it as data with high volume, high velocity, and great variety. We choose the description adopted by the American Association of Public Opinion Research: “The term ‘Big Data’ is an imprecise description of a rich and complicated set of characteristics, practices, techniques, ethical issues, and outcomes all associated with data” [188]. The value of the new types of data for social science is quite substantial. Personal data has been hailed as the “new oil” of the twenty-first century, and the benefits to policy, society, and public opinion research are undeniable [139]. Policymakers have found that detailed data on human beings can be used to reduce crime, improve health delivery, and manage cities better [205]. The scope is broad indeed: one of this book’s editors has used such data to not only help win political campaigns but also show its potential for public policy. Society can gain as well—recent work shows datadriven businesses were 5% more productive and 6% more profitable than their competitors [56]. In short, the vision is that social science researchers can potentially, by using data with high velocity, variety, and volume, increase the scope of their data collection efforts while at the same time reducing costs and respondent burden, increasing timeliness, and increasing precision [265].
Example: New data enable new analyses
Spotshotter data, which have fairly detailed information for each gunfire incident, such as the precise timestamp and the nearest address, as well as the type of shot, can be used to improve crime data [63]; Twitter data can be used to improve predictions around job loss, job gain, and job postings [17]; and eBay postings can be used to estimate demand elasticities [104].
But most interestingly, the new data can change the way we think about measuring and making inferences about behavior. For
4
1. Introduction
R D EV O IE N W O T CO D P IS Y TR IB U
TE
example, it enables the capture of information on the subject’s entire environment—thus, for example, the effect of fast food caloric labeling in health interventions [105]; the productivity of a cashier if he is within eyesight of a highly productive cashier but not otherwise [252]. So it offers the potential to understand the effects of complex environmental inputs on human behavior. In addition, big data, by its very nature, enables us to study the tails of a distribution in a way that is not possible with small data. Much of interest in human behavior is driven by the tails of the distribution—health care costs by small numbers of ill people [356], economic activity and employment by a small number of firms [93,109]—and is impossible to study with the small sample sizes available to researchers. Instead we are still faced with the same challenges and responsibilities as we were before in the survey and small data collection environment. Indeed, social scientists have a great deal to offer to a (data) world that is currently looking to computer scientists to provide answers. Two major areas to which social scientists can contribute, based on decades of experience and work with end users, are inference and attention to data quality.
1.3
! This topic is discussed in more detail in Chapter 10.
Social science, inference, and big data
The goal of empirical social science is to make inferences about a population from available data. That requirement exists regardless of the data source—and is a guiding principle for this book. For probability-based survey data, methodology has been developed to overcome problems in the data generating process. A guiding principle for survey methodologists is the total survey error framework, and statistical methods for weighting, calibration, and other forms of adjustment are commonly used to mitigate errors in the survey process. Likewise for “broken” experimental data, techniques like propensity score adjustment and principal stratification are widely used to fix flaws in the data generating process. Two books provide frameworks for survey quality [35, 143]. Across the social sciences, including economics, public policy, sociology, management, (parts of) psychology and the like, we can identify three categories of analysis with three different inferential goals: description, causation, and prediction.
Description The job of many social scientists is to provide descriptive statements about the population of interest. These could be univariate, bivariate, or even multivariate statements. Chapter 6
1.3. Social science, inference, and big data
5
R D EV O IE N W O T CO D P IS Y TR IB U
Example: Descriptive statistics
TE
on machine learning will cover methods that go beyond simple descriptive statistics, known as unsupervised learning methods. Descriptive statistics are usually created based on census data or sample surveys to generate some summary statistics like a mean, median, or a graphical distribution to describe the population of interest. In the case of a census, the work ends right there. With sample surveys the point estimates come with measures of uncertainties (standard errors). The estimation of standard errors has been worked out for most descriptive statistics and most common survey designs, even complex ones that include multiple layers of sampling and disproportional selection probabilities [154, 385].
The US Bureau of Labor Statistics surveys about 60,000 households a month and from that survey is able to describe national employment and unemployment levels. For example, in November 2015, total nonfarm payroll employment increased by 211,000 in November, and the unemployment rate was unchanged at 5.0%. Job gains occurred in construction, professional and technical services, and health care. Mining and information lost jobs [57].
Proper inference, even for purely descriptive purposes, from a sample to the population rests usually on knowing that everyone from the target population had the chance to be included in the survey, and knowing the selection probability for each element in the population. The latter does not necessarily need to be known prior to sampling, but eventually a probability is assigned for each case. Getting the selection probabilities right is particularly important when reporting totals [243]. Unfortunately in practice, samples that start out as probability samples can suffer from a high rate of nonresponse. Because the survey designer cannot completely control which units respond, the set of units that ultimately respond cannot be considered to be a probability sample [257]. Nevertheless, starting with a probability sample provides some degree of comfort that a sample will have limited coverage errors (nonzero probability of being in the sample), and there are methods for dealing with a variety of missing data problems [240].
Causation In many cases, social scientists wish to test hypotheses, often originating in theory, about relationships between phenomena of interest. Ideally such tests stem from data that allow causal infer-
6
1. Introduction
TE
ence: typically randomized experiments or strong nonexperimental study designs. When examining the effect of X on Y , knowing how cases were selected into the sample or data set is much less important in the estimation of causal effects than for descriptive studies, for example, population means. What is important is that all elements of the inferential population have a chance of being selected for the treatment [179]. In the debate about probability and nonprobability surveys, this distinction is often overlooked. Medical researchers have operated with unknown study selection mechanisms for years: for example, randomized trials that enroll only selected samples.
Example: New data and causal inference
R D EV O IE N W O T CO D P IS Y TR IB U
One of the major risks with using big data without thinking about the data source is the misallocation of resources. Overreliance on, say, Twitter data in targeting resources after hurricanes can lead to the misallocation of resources towards young, Internet-savvy people with cell phones, and away from elderly or impoverished neighborhoods [340]. Of course, all data collection approaches have had similar risks. Bad survey methodology led the Literary Digest to incorrectly call the 1936 election [353]. Inadequate understanding of coverage, incentive and quality issues, together with the lack of a comparison group, has hampered the use of administrative records—famously in the case of using administrative records on crime to make inference about the role of death penalty policy in crime reduction [95].
Of course, in practice it is difficult to ensure that results are generalizable, and there is always a concern that the treatment effect on the treated is different than the treatment effect in the full population of interest [365]. Having unknown study selection probabilities makes it even more difficult to estimate population causal effects, but substantial progress is being made [99, 261]. As long as we are able to model the selection process, there is no reason not to do causal inference from so-called nonprobability data.
Prediction Forecasting or prediction tasks are a little less common among applied social science researchers as a whole, but are certainly an important element for users of official statistics—in particular, in the context of social and economic indicators—as generally for decision-makers in government and business. Here, similar to the causal inference setting, it is of utmost importance that we do know the process that generated the data, and we can rule out any unknown or unobserved systematic selection mechanism.
1.4. Social science, data quality, and big data
7
Example: Learning from the flu
1.4
R D EV O IE N W O T CO D P IS Y TR IB U
TE
“Five years ago [in 2009], a team of researchers from Google announced a remarkable achievement in one of the world’s top scientific journals, Nature. Without needing the results of a single medical check-up, they were nevertheless able to track the spread of influenza across the US. What’s more, they could do it more quickly than the Centers for Disease Control and Prevention (CDC). Google’s tracking had only a day’s delay, compared with the week or more it took for the CDC to assemble a picture based on reports from doctors’ surgeries. Google was faster because it was tracking the outbreak by finding a correlation between what people searched for online and whether they had flu symptoms. . . . “Four years after the original Nature paper was published, Nature News had sad tidings to convey: the latest flu outbreak had claimed an unexpected victim: Google Flu Trends. After reliably providing a swift and accurate account of flu outbreaks for several winters, the theory-free, data-rich model had lost its nose for where flu was going. Google’s model pointed to a severe outbreak but when the slow-and-steady data from the CDC arrived, they showed that Google’s estimates of the spread of flu-like illnesses were overstated by almost a factor of two. “The problem was that Google did not know—could not begin to know—what linked the search terms with the spread of flu. Google’s engineers weren’t trying to figure out what caused what. They were merely finding statistical patterns in the data. They cared about correlation rather than causation” [155].
Social science, data quality, and big data
Most data in the real world are noisy, inconsistent, and suffers from missing values, regardless of its source. Even if data collection is cheap, the costs of creating high-quality data from the source— cleaning, curating, standardizing, and integrating—are substantial. Data quality can be characterized in multiple ways [76]:
• Accuracy: How accurate are the attribute values in the data? • Completeness: Is the data complete?
• Consistency: How consistent are the values in and between the database(s)?
• Timeliness: How timely is the data? • Accessibility: Are all variables available for analysis?
! This topic is discussed in more detail in Chapter 3.
8
1. Introduction
R D EV O IE N W O T CO D P IS Y TR IB U
TE
Social scientists have decades of experience in transforming messy, noisy, and unstructured data into a well-defined, clearly structured, and quality-tested data set. Preprocessing is a complex and time-consuming process because it is “hands-on”—it requires judgment and cannot be effectively automated. A typical workflow comprises multiple steps from data definition to parsing and ends with filtering. It is difficult to overstate the value of preprocessing for any data analysis, but this is particularly true in big data. Data need to be parsed, standardized, deduplicated, and normalized. Parsing is a fundamental step taken regardless of the data source, and refers to the decomposition of a complex variable into components. For example, a freeform address field like “1234 E 56th St” might be broken down into a street number “1234” and a street name “E 56th St.” The street name could be broken down further to extract the cardinal direction “E” and the designation “St.” Another example would be a combined full name field that takes the form of a comma-separated last name, first name, and middle initial as in “Miller, David A.” Splitting these identifiers into components permits the creation of more refined variables that can be used in the matching step. In the simplest case, the distinct parts of a character field are delimited. In the name field example, it would be easy to create the separate fields “Miller” and “David A” by splitting the original field at the comma. In more complex cases, special code will have to be written to parse the field. Typical steps in a parsing procedure include: 1. Splitting fields into tokens (words) on the basis of delimiters, 2. Standardizing tokens by lookup tables and substitution by a standard form, 3. Categorizing tokens,
4. Identifying a pattern of anchors, tokens, and delimiters, 5. Calling subroutines according to the identified pattern, therein mapping of tokens to the predefined components.
Standardization refers to the process of simplifying data by replacing variant representations of the same underlying observation by a default value in order to improve the accuracy of field comparisons. For example, “First Street” and “1st St” are two ways of writing the same street name, but a simple string comparison of these values will return a poor result. By standardizing fields—and
1.5. New tools for new data
9
using the same standardization rules across files!—the number of true matches that are wrongly classified as nonmatches (i.e., the number of false nonmatches) can be reduced. Some common examples of standardization are:
• Standardization of different spellings of frequently occurring words: for example, replacing common abbreviations in street names (Ave, St, etc.) or titles (Ms, Dr, etc.) with a common form. These kinds of rules are highly country- and languagespecific. to all uppercase and removing punctuation and digits.
TE
• General standardization, including converting character fields
R D EV O IE N W O T CO D P IS Y TR IB U
Deduplication consists of removing redundant records from a single list, that is, multiple records from the same list that refer to the same underlying entity. After deduplication, each record in the first list will have at most one true match in the second list and vice versa. This simplifies the record linkage process and is necessary if the goal of record linkage is to find the best set of one-to-one links (as opposed to a list of all possible links). One can deduplicate a list by applying record linkage techniques described in this chapter to link a file to itself. Normalization is the process of ensuring that the fields that are being compared across files are as similar as possible in the sense that they could have been generated by the same process. At minimum, the same standardization rules should be applied to both files. For additional examples, consider a salary field in a survey. There are number different ways that salary could be recorded: it might be truncated as a privacy-preserving measure or rounded to the nearest thousand, and missing values could be imputed with the mean or with zero. During normalization we take note of exactly how fields are recorded.
1.5
New tools for new data
The new data sources that we have discussed frequently require working at scales for which the social scientist’s familiar tools are not designed. Fortunately, the wider research and data analytics community has developed a wide variety of often more scalable and flexible tools—tools that we will introduce within this book. Relational database management systems (DBMSs) are used throughout business as well as the sciences to organize, process,
! This topic is discussed in more detail in Chapter 4.
10
1. Introduction
R D EV O IE N W O T CO D P IS Y TR IB U
TE
and search large collections of structured data. NoSQL DBMSs are used for data that is extremely large and/or unstructured, such as collections of web pages, social media data (e.g., Twitter messages), and clinical notes. Extensions to these systems and also specialized single-purpose DBMSs provide support for data types that are not easily handled in statistical packages such as geospatial data, networks, and graphs. Open source programming systems such as Python (used extensively throughout this book) and R provide high-quality implementations of numerous data analysis and visualization methods, from regression to statistics, text analysis, network analysis, and much more. Finally, parallel computing systems such as Hadoop and Spark can be used to harness parallel computer clusters for extremely large data sets and computationally intensive analyses. These various components may not always work together as smoothly as do integrated packages such as SAS, SPSS, and Stata, but they allow researchers to take on problems of great scale and complexity. Furthermore, they are developing at a tremendous rate as the result of work by thousands of people worldwide. For these reasons, the modern social scientist needs to be familiar with their characteristics and capabilities.
1.6
⋆ UMETRICS: Universities Measuring the Impact of Research on Innovation and Science [228] ! iris.isr.umich.edu
The book’s “use case”
This book is about the uses of big data in social science. Our focus is on working through the use of data as a social scientist normally approaches research. That involves thinking through how to use such data to address a question from beginning to end, and thereby learning about the associated tools—rather than simply engaging in coding exercises and then thinking about how to apply them to a potpourri of social science examples. There are many examples of the use of big data in social science research, but relatively few that feature all the different aspects that are covered in this book. As a result, the chapters in the book draw heavily on a use case based on one of the first large-scale big data social science data infrastructures. This infrastructure, based on UMETRICS* data housed at the University of Michigan’s Institute for Research on Innovation and Science (IRIS) and enhanced with data from the US Census Bureau, provides a new quantitative analysis and understanding of science policy based on large-scale computational analysis of new types of data.
1.6. The book’s “use case”
11
The infrastructure was developed in response to a call from the President’s Science Advisor (Jack Marburger) for a science of science policy [250]. He wanted a scientific response to the questions that he was asked about the impact of investments in science.
Example: The Science of Science Policy
R D EV O IE N W O T CO D P IS Y TR IB U
TE
Marburger wrote [250]: “How much should a nation spend on science? What kind of science? How much from private versus public sectors? Does demand for funding by potential science performers imply a shortage of funding or a surfeit of performers? These and related science policy questions tend to be asked and answered today in a highly visible advocacy context that makes assumptions that are deserving of closer scrutiny. A new ‘science of science policy’ is emerging, and it may offer more compelling guidance for policy decisions and for more credible advocacy. . . . “Relating R&D to innovation in any but a general way is a tall order, but not a hopeless one. We need econometric models that encompass enough variables in a sufficient number of countries to produce reasonable simulations of the effect of specific policy choices. This need won’t be satisfied by a few grants or workshops, but demands the attention of a specialist scholarly community. As more economists and social scientists turn to these issues, the effectiveness of science policy will grow, and of science advocacy too.”
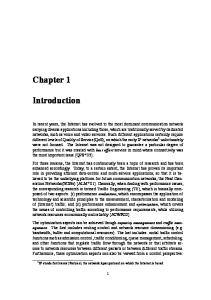
Responding to this policy imperative is a tall order, because it involves using all the social science and computer science tools available to researchers. The new digital technologies can be used to capture the links between the inputs into research, the way in which those inputs are organized, and the subsequent outputs [396, 415]. The social science questions that are addressable with this data infrastructure include the effect of research training on the placement and earnings of doctoral recipients, how university trained scientists and engineers affect the productivity of the firms they work for, and the return on investments in research. Figure 1.2 provides an abstract representation of the empirical approach that is needed: data about grants, the people who are funded on grants, and the subsequent scientific and economic activities. First, data must be captured on what is funded, and since the data are in text format, computational linguistics tools must be applied (Chapter 7). Second, data must be captured on who is funded, and how they interact in teams, so network tools and analysis must be used (Chapter 8). Third, information about the type of results must be gleaned from the web and other sources (Chapter 2).
12
1. Introduction
Co-Author
Collaborate Train
Pro du c e&
Pays for &
Products
Aw
R D EV O IE N W O T CO D P IS Y TR IB U
Is Awarded to
Institutions
TE
e us
Em
People oy pl
or
de
ts
ar
d
to
Su
pp
Funding
Figure 1.2. A visualization of the complex links between what and who is funded, and the results; tracing the direct link between funding and results is misleading and wrong
Finally, the disparate complex data sets need to be stored in databases (Chapter 4), integrated (Chapter 3), analyzed (Chapter 6), and used to make inferences (Chapter 10). The use case serves as the thread that ties many of the ideas together. Rather than asking the reader to learn how to code “hello world,” we build on data that have been put together to answer a real-world question, and provide explicit examples based on that data. We then provide examples that show how the approach generalizes. For example, the text analysis chapter (Chapter 7) shows how to use natural language processing to describe what research is being done, using proposal and award text to identify the research topics in a portfolio [110, 368]. But then it also shows how the approach can be used to address a problem that is not just limited to science policy—the conversion of massive amounts of knowledge that is stored in text to usable information.
1.7. The structure of the book
13
⋆ Application Programming Interfaces
1.7
R D EV O IE N W O T CO D P IS Y TR IB U
TE
Similarly, the network analysis chapter (Chapter 8) gives specific examples using the UMETRICS data and shows how such data can be used to create new units of analysis—the networks of researchers who do science, and the networks of vendors who supply research inputs. It also shows how networks can be used to study a wide variety of other social science questions. In another example, we use APIs* provided by publishers to describe the results generated by research funding in terms of publications and other measures of scientific impact, but also provide code that can be repurposed for many similar APIs. And, of course, since all these new types of data are provided in a variety of different formats, some of which are quite large (or voluminous), and with a variety of different timestamps (or velocity), we discuss how to store the data in different types of data formats.
The structure of the book
We organize the book in three parts, based around the way social scientists approach doing research. The first set of chapters addresses the new ways to capture, curate, and store data. The second set of chapters describes what tools are available to process and classify data. The last set deals with analysis and the appropriate handling of data on individuals and organizations.
1.7.1
Part I: Capture and curation
The four chapters in Part I (see Figure 1.3) tell you how to capture and manage data. Chapter 2 describes how to extract information from social media about the transmission of knowledge. The particular application will be to develop links to authors’ articles on Twitter using PLOS articles and to pull information about authors and articles from web sources by using an API. You will learn how to retrieve link data from bookmarking services, citations from Crossref, links from Facebook, and information from news coverage. In keeping with the social science grounding that is a core feature of the book, the chapter discusses what data can be captured from online sources, what is potentially reliable, and how to manage data quality issues. Big data differs from survey data in that we must typically combine data from multiple sources to get a complete picture of the activities of interest. Although computer scientists may sometimes
14
1. Introduction
API and Web Scraping
Chapter 2: Different ways of collecting data
Chapter 3: Combining different data sets
Storing Data
Chapter 4: Ingest, query and export data
Chapter 5: Output (creating innovation measures)
R D EV O IE N W O T CO D P IS Y TR IB U
Processing Large Data Sets
TE
Record Linkage
Figure 1.3. The four chapters of Part I focus on data capture and curation
simply “mash” data sets together, social scientists are rightfully concerned about issues of missing links, duplicative links, and erroneous links. Chapter 3 provides an overview of traditional rule-based and probabilistic approaches to data linkage, as well as the important contributions of machine learning to the linkage problem. Once data have been collected and linked into different files, it is necessary to store and organize it. Social scientists are used to working with one analytical file, often in statistical software tools such as SAS or Stata. Chapter 4, which may be the most important chapter in the book, describes different approaches to storing data in ways that permit rapid and reliable exploration and analysis. Big data is sometimes defined as data that are too big to fit onto the analyst’s computer. Chapter 5 provides an overview of clever programming techniques that facilitate the use of data (often using parallel computing). While the focus is on one of the most widely used big data programming paradigms and its most popular implementation, Apache Hadoop, the goal of the chapter is to provide a conceptual framework to the key challenges that the approach is designed to address.
1.7. The structure of the book
15
Chapter 6: Classifying data in new ways
Text Analysis
Chapter 7: Creating new data from text
Chapter 8: Creating new measures of social and economic activity
R D EV O IE N W O T CO D P IS Y TR IB U
Networks
TE
Machine Learning
Figure 1.4. The four chapters in Part II focus on data modeling and analysis
1.7.2
Part II: Modeling and analysis
The three chapters in Part II (see Figure 1.4) introduce three of the most important tools that can be used by social scientists to do new and exciting research: machine learning, text analysis, and social network analysis. Chapter 6 introduces machine learning methods. It shows the power of machine learning in a variety of different contexts, particularly focusing on clustering and classification. You will get an overview of basic approaches and how those approaches are applied. The chapter builds from a conceptual framework and then shows you how the different concepts are translated into code. There is a particular focus on random forests and support vector machine (SVM) approaches. Chapter 7 describes how social scientists can make use of one of the most exciting advances in big data—text analysis. Vast amounts of data that are stored in documents can now be analyzed and searched so that different types of information can be retrieved. Documents (and the underlying activities of the entities that generated the documents) can be categorized into topics or fields as well as summarized. In addition, machine translation can be used to compare documents in different languages.
16
1. Introduction
R D EV O IE N W O T CO D P IS Y TR IB U
TE
Social scientists are typically interested in describing the activities of individuals and organizations (such as households and firms) in a variety of economic and social contexts. The frames within which data are collected have typically been generated from tax or other programmatic sources. The new types of data permit new units of analysis—particularly network analysis—largely enabled by advances in mathematical graph theory. Thus, Chapter 8 describes how social scientists can use network theory to generate measurable representations of patterns of relationships connecting entities. As the author points out, the value of the new framework is not only in constructing different right-hand-side variables but also in studying an entirely new unit of analysis that lies somewhere between the largely atomistic actors that occupy the markets of neo-classical theory and the tightly managed hierarchies that are the traditional object of inquiry of sociologists and organizational theorists.
1.7.3
Part III: Inference and ethics
The four chapters in Part III (see Figure 1.5) cover three advanced topics relating to data inference and ethics—information visualization, errors and inference, and privacy and confidentiality—and introduce the workbooks that provide access to the practical exercises associated with the text.
Visualization
Inference
Privacy and Confidentiality
Workbooks
Chapter 9: Making sense of the data
Chapter 10: Drawing statistically valid conclusions
Chapter 11: Handling data appropriately
Chapter 12: Applying new models and tools
Figure 1.5. The four chapters in Part III focus on inference and ethics
1.8. Resources
17
R D EV O IE N W O T CO D P IS Y TR IB U
TE
Chapter 9 introduces information visualization methods and describes how you can use those methods to explore data and communicate results so that data can be turned into interpretable, actionable information. There are many ways of presenting statistical information that convey content in a rigorous manner. The goal of this chapter is to explore different approaches and examine the information content and analytical validity of the different approaches. It provides an overview of effective visualizations. Chapter 10 deals with inference and the errors associated with big data. Social scientists know only too well the cost associated with bad data—we highlighted the classic Literary Digest example in the introduction to this chapter, as well as the more recent Google Flu Trends. Although the consequences are well understood, the new types of data are so large and complex that their properties often cannot be studied in traditional ways. In addition, the data generating function is such that the data are often selective, incomplete, and erroneous. Without proper data hygiene, errors can quickly compound. This chapter provides a systematic way to think about the error framework in a big data setting. Chapter 11 addresses the issue that sits at the core of any study of human beings—privacy and confidentiality. In a new field, like the one covered in this book, it is critical that many researchers have access to the data so that work can be replicated and built on—that there be a scientific basis to data science. Yet the rules that social scientists have traditionally used for survey data, namely anonymity and informed consent, no longer apply when the data are collected in the wild. This concluding chapter identifies the issues that must be addressed for responsible and ethical research to take place. Finally, Chapter 12 provides an overview of the practical work that accompanies each chapter—the workbooks that are designed, using Jupyter notebooks, to enable students and interested practitioners to apply the new techniques and approaches in selected chapters. We hope you have a lot of fun with them.
1.8
Resources
For more information on the science of science policy, see Husbands et al.’s book for a full discussion of many issues [175] and the online resources at the eponymous website [352]. This book is above all a practical introduction to the methods and tools that the social scientist can use to make sense of big data, and thus programming resources are also important. We make
! See jupyter.org.
18
TE
http://bit.ly/
extensive use of the Python programming language and the MySQL database management system in both the book and its supporting workbooks. We recommend that any social scientist who aspires to work with large data sets become proficient in the use of these two systems, and also one more, GitHub. All three, fortunately, are quite accessible and are supported by excellent online resources. Time spent mastering them will be repaid many times over in more productive research. For Python, Alex Bell’s Python for Economists (available online [31]) provides a wonderful 30-page introduction to the use of Python in the social sciences, complete with XKCD cartoons. Economists Tom Sargent and John Stachurski provide a very useful set of lectures and examples at http://quant-econ.net/. For more detail, we recommend Charles Severance’s Python for Informatics: Exploring Information [338], which not only covers basic Python but also provides material relevant to web data (the subject of Chapter 2) and MySQL (the subject of Chapter 4). This book is also freely available online and is supported by excellent online lectures and exercises. For MySQL, Chapter 4 provides introductory material and pointers to additional resources, so we will not say more here. We also recommend that you master GitHub. A version control system is a tool for keeping track of changes that have been made to a document over time. GitHub is a hosting service for projects that use the Git version control system. As Strasser explains [363], Git/GitHub makes it straightforward for researchers to create digital lab notebooks that record the data files, programs, papers, and other resources associated with a project, with automatic tracking of the changes that are made to those resources over time. GitHub also makes it easy for collaborators to work together on a project, whether a program or a paper: changes made by each contributor are recorded and can easily be reconciled. For example, we used GitHub to create this book, with authors and editors checking in changes and comments at different times and from many time zones. We also use GitHub to provide access to the supporting workbooks. Ram [314] provides a nice description of how Git/GitHub can be used to promote reproducibility and transparency in research. One more resource that is outside the scope of this book but that you may well want to master is the cloud [21,236]. It used to be that when your data and computations became too large to analyze on your laptop, you were out of luck unless your employer (or a friend) had a larger computer. With the emergence of cloud storage and computing services from the likes of Amazon Web Services, Google, and Microsoft, powerful computers are available to anyone with a
R D EV O IE N W O T CO D P IS Y TR IB U
! Read this! 1VgytVV
1. Introduction
1.8. Resources
19
R D EV O IE N W O T CO D P IS Y TR IB U
TE
credit card. We and many others have had positive experiences using such systems for the analysis of urban [64], environmental [107], and genomic [32] data analysis and modeling, for example. Such systems may well represent the future of research computing.