Sherwood School District Sherwood, Oregon
“DRAFT” 10-Year Student Population Projections By Residence
Fall 2016-2025 (Based on Fall 2015 Data)
April 12, 2016
Prepared by
11850 Pierce Street, Suite 200 Riverside, California 92505 Phone: (951)-270-5211 Fax: (951) 270-5212 www.DavisDemographics.com
Sherwood School District
Methodology for Fall 2015 Projections
10 Year Projections by “Residence” for the Sherwood School District
(Based on Fall 2015/2016 K-12 Student Data)
The Sherwood School District (or the District) has requested Davis Demographics & Planning, Inc. (DDP) to assist in preparing a District-wide enrollment forecast based upon student residence. The projected student enrollments generated by DDP cover a ten year period that are based upon the actual Fall 2015 student enrollment figures. The projections conducted by DDP were calculated at the smallest level possible, the Study Area. The Sherwood School District has been divided into 104 individual “study areas.” No study area straddles two District attendance areas. Therefore, the projected number of students in each of the District’s current attendance areas are derived by the simple addition of all of the study areas that comprise that particular region. The District-wide projections is the summary of all 104 study areas. The concept of running projections at the “study area” level is ideal for a school district that plans on re-adjusting its current attendance areas. This then gives the District the ability to determine a variety of new attendance area scenarios and know approximately what the future number of students will be living in the proposed areas. A variety of factors go into the calculation of the “study area” projections. These components include the following: (1) examining the current and planned residential development over the next ten years; (2) calculating student yield factors to apply to this new development; (3) determining birth factors for this District area; and (4) calculating mobility factors, which examine the in/out migration of students within existing housing units (this factor, for example, takes the “resale” of units into account).
SOURCES OF DATA Historical Enrollment:
Obtained verified K-12 student data files downloaded by the District to DDP for each early October from Fall 2012 to Fall 2015.
Housing Information:
Obtained by DDP through information provided by District staff. In addition to data provided by city and county planning departments and developers were contacted when applicable. The use of aerial imagery and county parcel data in a GIS format were also used in this process.
Birth Data:
Live birth counts for the Sherwood area (by zipcode) were obtained from the State of Oregon, Center for Health Statistics Department.
(used for estimating incoming Kindergarten)
Davis Demographics & Planning, Inc.
Page 1
April 12, 2016
Sherwood School District
Methodology for Fall 2015 Projections
METHODOLOGY 1.
Graduate 12th grade: move up other grades.
2.
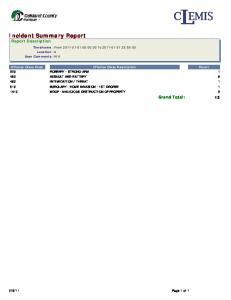
New residential development information was gathered and researched by DDP by speaking with District staff, contacting city planners, and contacting individual developers when applicable. The use of current and historical aerial imagery and county parcel data in a GIS format were also used in this process. DDP’s research has determined that there are 1,551 new residential units planned over the next ten years. Of these 1,551 units 1,155 are single family homes, 207 are apartments, and 189 are multi-family homes.
3.
Student yield factors are calculated for by geographically linking assessor parcel data with student data. For lack of a large enough sample size, DDP used Student Yield Factors from neighboring West Linn-Wilsonville SD (see below).
4.
Incoming Kindergarten estimates were calculated by gathering live birth counts by the District’s main zipcode (97140) and annual comparisons were made to the Fall 2015 Kindergarten class (born in 2010) as the base year.
5. Modify enrollment further by using student mobility factors as follows: Mobility refers to the in-out migration of students from existing housing. This variable reflects the percentage of students progressing through the grade ranges. The mobility factors help account for the following trends occurring throughout the District: existing housing resales, foreclosures, apartment migration and high school dropout rates. Student counts for each study area are available for the last Davis Demographics & Planning, Inc.
Page 2
April 12, 2016
Sherwood School District
Methodology for Fall 2015 Projections
four school years (Fall 2012 through Fall 2015). The mobility factors were conducted at the current primary school attendance boundary level. There was a total of 24 study areas were chosen from the Archer Glen ES attendance area; 20 study areas from the Edy Ridge ES attendance area; 33 from the Hopkins ES area and 27 study areas from Middleton ES’s area. The mobility factors that show no net increases or decreases (zero change in the number of students) over time is represented by a factor of 1.00 (blue). A net student loss is represented by a factor less than 1.00 (red) and a net gain by a factor greater than 1.00 (green). When the data is available, the typical method that DDP uses to calculate mobility factors is using four consecutive years of mapped student data which results in three years of change and then average it out to even out any anomalies. A comparison was made for the Fall 2012 K student population to the Fall 2013 1st grade students within a specific study area. This comparison was also conducted for the following pairings: Fall 2013 & Fall 2014 and the Fall 2014 & Fall 2015 school-years. In addition, middle school and high school grades were also looked at in this manner (all transitions from Kindergarten through 12th grade).
Student Mobility Factors (used in the Fall 2015 Projections)
“3 Years of Change” (Using Fall 2012 through Fall 2015 students) Sherwood School District Mobility (Using Fall 2012 through Fall 2015 Student Data) (Excluding Study Areas that H ave H ad Development and Ones that Contain Low Student Counts)
Archer Glen ES Edy Ridge ES Hopkins ES Middleton ES
6.
G1 1.190 1.140 1.160 1.090
G2 0.990 1.110 1.050 1.060
G3 1.070 1.070 1.050 1.040
G4 1.020 1.000 1.070 1.010
G5 1.010 1.020 1.040 1.050
G6 1.060 1.110 1.080 1.020
G7 1.040 1.010 1.050 0.990
G8 1.030 1.030 1.030 1.010
G9 1.100 1.080 0.990 1.020
G10 0.960 0.980 1.020 0.980
G11 0.970 0.990 0.990 0.990
G12 0.960 0.990 0.960 0.970
Each of the 104 Study Areas are then projected out over the next ten years (Fall 2016 through Fall 2025). From these study areas, individual Attendance Area reports are generated (see enclosed Attendance Area and Study Area Projections). Please refer to the attached map (11” X 17”) to see the individual study area locations as well as determining the study areas that comprise each Attendance Area.
These projections are based on where the students live and where they should be attending school. DDP uses the actual location of where the students reside, as opposed to their school of enrollment, in order to provide the most accurate depiction of where future schools (if necessary) should be located. The concept of running projections at the “study area” level is ideal for a school district that plans on re-adjusting its current attendance areas. The best way to plan for future schools is to know where the next group of students will be coming from, not necessarily which school they are currently attending.
Davis Demographics & Planning, Inc.
Page 3
April 12, 2016
COURT
MOHAVE
AD RO
86TH AVENUE
FE RR Y S NE BO O
MA N D PAC AN DR IFIC IV HIG E HWA Y
93RD AVENUE
95TH AVENUE
91ST AVENUE
119TH AVENUE
97TH AVENUE
TETON AVENUE
INDUS TRIAL
WAY 109TH TERRACE 107TH AVENUE 108TH AVENUE 106TH AVENUE 106TH AVENUE 105TH AVENUE 104TH AV E NUE
MURDOCK ROAD
82ND AVENUE
HWA Y
HIG
PAC IFIC
Basalt Creek Planning Area 162 APT Units
SALISH LANE
PROPOSED ROAD
New Housing Development streets
RIDDER ROAD
StudyAreas
JACK B UR
PARKWAY AV E NUE
OA D FE RR YR
GR AH AM S
GREENHILL LANE
DAY ROAD
GARDEN ACRES ROAD
MORGAN LANE
STONEHAVEN STREET
BAKER ROAD
BAKER ROAD
PLEASANT HILL ROAD
115TH AVENUE
PO PR O
OBERST ROAD
120TH AVENUE
SE D
RO
AD
RD
82A
E IV
LADD HILL ROAD
BA KE R
82B
95TH AVENUE
ROAD
84
CAHALIN ROAD
DR
REIN
MORGAN ROAD
D
0.8 Miles
Basalt Creek Planning Area 324 SFD Units
AN
0.4
R
AD
83
TONQUIN ROAD
L AT HE
0
C
L
Basalt Creek Planning Area 162 MFA Units
82C
W
April 12, 2016
85B
86C
M
O
IV E
LN
86A
C
EL
DR
A SC
Map Prepared by
SQUIRREL LANE
N
N
EY
E AL
87
OBERST LANE
O
WALDO W AY
ELWERT ROAD HIGHWAY
OLD PACIFIC
HW AY HIG IFIC PAC
PINE STREET
EASTVIEW ROAD
Brookman Road Concept Plan 362 SFD Units
VE DR I
BROOKMAN ROAD
BLAKE STREET
OTA
86D
81
80
ALSEA DRIVE
OA D
DAK
79
E
68
HIGHPOINT DRIVE
KI NL
RD
67
MC
IN
58
HO R
TONQUIN LOOP
QU
53
77
N TO
46B
66
ARAP A
PAULINA DRIVE
BROWN STREET
SMOCK S TREET
78
SIUSLAW LANE
REET UMATILLA ST
ONEIDA STREET
76
70
69
LN
48
Brookman Road Concept Plan 726 SFD Units 54
49
KE
46C
65
63
SUNSET BLVD
50
71
DIVISION STREET
59
HL DA
46A
IVE 57 FITCH DR 55
74
FOREST AVENUE
75
DRIVE
TAYLORS DRIVE
D
47
51
64
STREET
O OCHOC
IBACH STREET
OA
¯
44
WILLAMETTE
39 VILLA ROAD STELLAR DRIVE
73
72
Timber Crossing 18 SFD Units 38
56
43
31
R IN
IVE
28 SFD Units
KRUGER ROAD
45
40
34
30
SILETZ DRIVE
QU
41
35
24B
24A
N TO
9 33A
42
Sherwood Plaza Apartments 82 APT Units
32
12TH STREET 27
Cedar Brook PUD 50 MFA Units
DEWEY DR
6
5
10
AVERY STREET
TUALATIN-SHERWOOD ROAD
25A
NU VE HA
GILLETTE LA NE
20
25B
UE AVEN
11A
Cedar Brook PUD 15 SFD Units
Sherwood West SFD Units
4
11B
26
BR
DR
Active and Future Residential Development
H 112T
8
13 12
21
L GA
TH EA
AD
MANHASSET DRIVE
23B
E IV
RO
Sherwood School District
HER
N MA
MYSLONY STREET
E
Mandel Farms Subdivision 86 SFD Units
EDY ROAD
E NU
Roshun Village Townhomes 14 MFA Units
H AV
23A
15
129T
22
OA D
CONZELMANN ROAD
LE R
3
CIPO
SCHROEDER LANE
AY HW
90T
IF PAC
IG IC H
124TH AVENUE
1
NS BLV
D
Sherwood School District
Total SFD = 1155 Total MFA = 189
Total APT = 207
Total OTHER = 0
Study Area
10/2020 - 10/2021
10/2021 - 10/2022
10/2022 - 10/2023
10/2023 - 10/2024
10/2024 - 10/2025
SFD
MFA
APT
SFD
MFA
APT
SFD
MFA
APT
SFD
MFA
APT
SFD
MFA
APT
SFD
MFA
APT
SFD
MFA
APT
SFD
MFA
APT
SFD
MFA
APT
SFD
MFA
APT
Total
Study Area
Elementary School
Middle School
High School
8
9
0
0
38
0
0
39
0
0
0
0
0
0
0
0
0
0
0
0
0
0
0
0
0
0
0
0
0
0
0
86
8
Edy Ridge ES
Laurel Ridge MS
Sherwood HS Sherwood HS
10/2015 - 10/2016
10/2016 - 10/2017
10/2017 - 10/2018
10/2018 - 10/2019
10/2019 - 10/2020
9
5
20
0
10
30
0
0
0
0
0
0
0
0
0
0
0
0
0
0
0
0
0
0
0
0
0
0
0
0
0
65
9
Edy Ridge ES
Laurel Ridge MS
20
0
14
0
0
0
0
0
0
0
0
0
0
0
0
0
0
0
0
0
0
0
0
0
0
0
0
0
0
0
0
14
20
Edy Ridge ES
Laurel Ridge MS
Sherwood HS
26
0
0
0
0
0
60
0
0
22
0
0
0
0
0
0
0
0
0
0
0
0
0
0
0
0
0
0
0
0
0
82
26
Hopkins ES
Sherwood MS
Sherwood HS
37
0
0
0
0
0
0
9
0
0
9
0
0
0
0
0
0
0
0
0
0
0
0
0
0
0
0
0
0
0
0
18
37
Hopkins ES
Sherwood MS
Sherwood HS
42
0
0
0
0
0
0
0
0
0
14
0
0
14
0
0
0
0
0
0
0
0
0
0
0
0
0
0
0
0
0
28
42
Middleton ES
Sherwood MS
Sherwood HS
46C
0
0
0
0
0
0
25
0
0
35
0
0
35
0
0
35
0
0
35
0
0
35
0
0
28
0
0
0
0
0
228
46C
Middleton ES
Laurel Ridge MS
Sherwood HS
82B
0
0
0
0
0
0
0
0
0
0
0
0
0
0
0
30
25
25
75
25
25
75
25
25
75
25
25
69
25
25
574
82B
Hopkins ES
Sherwood MS
Sherwood HS
86D
0
0
0
0
0
0
50
0
0
75
0
0
75
0
0
75
0
0
75
0
0
75
0
0
31
0
0
0
0
0
456
86D
Archer Glen ES
Sherwood MS
Sherwood HS
Total
14
34
0
48
30
60
123
0
22
133
0
0
124
0
0
140
25
25
185
25
25
185
25
25
134
25
25
69
25
25
Total
Total 15 / 16
48
Contact/Owner Developer City of Sherwood City of Tualitan City of Tualitan City of Tualitan City of Sherwood City of Sherwood DR Horton DR Horton Venture Properties Roshun Village Mercury Development City of Sherwood City of Sherwood =
Created by DDP
Total 16 / 17
138
Total 17 / 18
145
Project/Area Unknown Basalt Creek Planning Area Basalt Creek Planning Area Basalt Creek Planning Area Brookman Road Concept Plan Brookman Road Concept Plan Cedar Brook PUD Cedar Brook PUD Mandel Farms Subdivision Roshun Village Townhomes Sherwood Plaza Apartments Sherwood West Timber Crossing
Total 18 / 19
Study Area 42 82B 82B 82B 86D 46C 9 9 8 20 26 4 37
133
Total Units 28 162 324 162 726 362 15 50 86 14 82 4400 18
Total 19 / 20
Type of Units SFD APT SFD MFA SFD SFD SFD MFA SFD MFA APT SFD SFD
124
Left to Build All All All All All All All All All All All All All
Total 20 / 21
190
Total 21 / 22
235
Total 22 / 23
235
Total 23 / 24
184
Total 24/ 25
119
Comments Talking about starting up again Talk to Cities of Tualatin & Wilsonville (162 APT) Talk to Cities of Tualatin & Wilsonville (324 SFD) Talk to Cities of Tualatin & Wilsonville (162 MFA) Outside of City - Could be Annexed soon? Outside of City - Could be Annexed soon? 50 townhomes & 15 SFD, Currently in progress 50 townhomes & 15 SFD, Currently in progress 1st 9 units by Fall 2016, Currently in progress 14 Townhomes, Currently in progress 82 Apts const in Jan 2017 Four distinct regions/A ways off 7+ yrs, still in planning 17-20 possible lots
Projects in progress
Draft Resdiential Development
4/12/2016
Sherwood School District
SY 2015/16 Projection
"DRAFT" District-Wide 10-Year Forecast Projection Date 10/7/2015
Sub Total of Resident Students:
K-5 6-8 9-12 K-12
Special Education Students:
K-5 6-8 9-12 K-12
Out-of-District Students:
K-5 6-8 9-12 K-12
Unmatched Students:
K-5 6-8 9-12 K-12
Actual Fall 2013 303 338 371 331 346 379 393 401 386 381 350 362 314 Fall 2013 2,068 1,180 1,407 4,655 Fall 2013 8 13 13 34 Fall 2013 58 36 91 185 Fall 2013 2 0 2 4
K-5 6-8 9-12 K-12
Fall 2013 2,136 1,229 1,513 4,878
K 1 2 3 4 5 6 7 8 9 10 11 12
Totals:
% Change:
K-5 Annual Change: 6-8 Annual Change: 9-12 Annual Change: K-12 Annual Change:
Actual Fall 2014 302 345 355 380 347 356 406 400 408 397 382 343 348 Fall 2014 2,085 1,214 1,470 4,769 Fall 2014 6 10 16 32 Fall 2014 40 28 82 150 Fall 2014 0 0 2 2
"Current" Fall 2015 337 344 371 386 391 367 380 411 408 428 399 375 335 Fall 2015 2,196 1,199 1,537 4,932 Fall 2015 4 5 18 27 Fall 2015 24 19 65 108 Fall 2015 0 0 0 0
Fall 2016 311.2 387.4 364.2 393.4 396.7 404.1 391.9 389.2 422.2 427.6 422.8 394.0 364.6 Fall 2016 2,257.0 1,203.3 1,609.0 5,069.3 Fall 2016 4.0 5.0 18.0 27.0 Fall 2016 24.0 19.0 65.0 108.0 Fall 2016 0.0 0.0 0.0 0.0
Fall 2017 342.4 360.7 410.2 389.2 406.2 413.1 435.0 403.5 402.6 444.1 423.9 419.6 385.0 Fall 2017 2,321.8 1,241.1 1,672.6 5,235.5 Fall 2017 4.0 5.0 18.0 27.0 Fall 2017 24.0 19.0 65.0 108.0 Fall 2017 0.0 0.0 0.0 0.0
Fall 2018 331.0 399.3 384.9 440.2 405.3 424.9 447.2 451.1 419.6 424.9 441.7 422.2 411.4 Fall 2018 2,385.6 1,317.9 1,700.2 5,403.7 Fall 2018 4.0 5.0 18.0 27.0 Fall 2018 24.0 19.0 65.0 108.0 Fall 2018 0.0 0.0 0.0 0.0
Projected Resident Student Counts Fall 2019 Fall 2020 Fall 2021 Fall 2022 311.5 335.1 333.7 337.2 386.4 363.6 392.5 393.5 425.2 411.0 388.5 420.9 413.6 455.7 442.3 420.8 458.2 430.4 475.3 463.9 423.8 478.0 451.0 499.4 459.4 459.9 517.5 490.9 463.0 475.0 478.2 540.0 469.0 480.5 494.3 500.4 442.8 495.7 507.5 525.4 423.3 440.3 493.3 507.2 439.4 421.3 439.4 492.6 414.1 429.8 414.2 433.1 Fall 2019 Fall 2020 Fall 2021 Fall 2022 2,418.7 2,473.8 2,483.3 2,535.7 1,391.4 1,415.4 1,490.0 1,531.3 1,719.6 1,787.1 1,854.4 1,958.3 5,529.7 5,676.3 5,827.7 6,025.3 Fall 2019 Fall 2020 Fall 2021 Fall 2022 4.0 4.0 4.0 4.0 5.0 5.0 5.0 5.0 18.0 18.0 18.0 18.0 27.0 27.0 27.0 27.0 Fall 2019 Fall 2020 Fall 2021 Fall 2022 24.0 24.0 24.0 24.0 19.0 19.0 19.0 19.0 65.0 65.0 65.0 65.0 108.0 108.0 108.0 108.0 Fall 2019 Fall 2020 Fall 2021 Fall 2022 0.0 0.0 0.0 0.0 0.0 0.0 0.0 0.0 0.0 0.0 0.0 0.0 0.0 0.0 0.0 0.0
Fall 2023 346.0 397.5 421.8 455.0 442.0 487.7 542.5 512.9 563.6 531.0 523.7 506.8 484.5 Fall 2023 2,550.0 1,619.0 2,046.0 6,215.0 Fall 2023 4.0 5.0 18.0 27.0 Fall 2023 24.0 19.0 65.0 108.0 Fall 2023 0.0 0.0 0.0 0.0
Fall 2024 347.1 404.9 423.5 453.4 474.8 462.7 527.3 563.3 533.3 594.7 528.8 520.9 496.8 Fall 2024 2,566.4 1,623.9 2,141.2 6,331.5 Fall 2024 4.0 5.0 18.0 27.0 Fall 2024 24.0 19.0 65.0 108.0 Fall 2024 0.0 0.0 0.0 0.0
Fall 2025 347.9 402.6 428.1 451.9 470.2 493.3 497.4 544.7 581.9 560.5 589.2 524.0 508.2 Fall 2025 2,594.0 1,624.0 2,181.9 6,399.9 Fall 2025 4.0 5.0 18.0 27.0 Fall 2025 24.0 19.0 65.0 108.0 Fall 2025 0.0 0.0 0.0 0.0
Fall 2014 2,131 1,252 1,570 4,953
Fall 2015 2,224 1,223 1,620 5,067
Fall 2016 2285.0 1227.3 1692.0 5204.3
Fall 2017 2349.8 1265.1 1755.6 5370.5
Fall 2018 2413.6 1341.9 1783.2 5538.7
Fall 2019 2446.7 1415.4 1802.6 5664.7
Fall 2020 2501.8 1439.4 1870.1 5811.3
Fall 2021 2511.3 1514.0 1937.4 5962.7
Fall 2022 2563.7 1555.3 2041.3 6160.3
Fall 2023 2578.0 1643.0 2129.0 6350.0
Fall 2024 2594.4 1647.9 2224.2 6466.5
Fall 2025 2622.0 1648.0 2264.9 6534.9
From '13 to '14
From '14 to '15
From '15 to '16
From '16 to '17
From '17 to '18
From '18 to '19
From '19 to '20
From '20 to '21
From '21 to '22
From '22 to '23
From '23 to '24
From '24 to '25
-0.2% 1.8% 3.6% 1.5%
4.2% -2.4% 3.1% 2.2%
2.7% 0.4% 4.3% 2.6%
2.8% 3.0% 3.6% 3.1%
2.6% 5.7% 1.5% 3.0%
1.4% 5.2% 1.1% 2.2%
2.2% 1.7% 3.6% 2.5%
0.4% 4.9% 3.5% 2.5%
2.0% 2.7% 5.1% 3.2%
0.6% 5.3% 4.1% 3.0%
0.6% 0.3% 4.3% 1.8%
Change from 20152025
# 398.0 425.0 644.9 1,467.9
% 17.9% 34.8% 39.8% 29.0%
1.1% 0.0% 1.8% 1.0%
The above projections are based upon a student data file provided to DDP by the Sherwood School District representing early October 2015. . 13 students with a grade = 13 and 28 PreK students were given to DDP in the original student data file and were excluded from the above projections.
April 12, 2016
Prepared by Davis Demographics and Planning, Inc.
Sherwood School District
Fall 2015/2016 Projection Report
Fall 2015/2016 K-5 (Elementary School) Attendance Matrix "Open Enrollment" Patterns
K-5 Students
Archer Glen ES
Edy Ridge ES
Hopkins ES
Middleton ES
SCHOOL OF RESIDENCE (BASED ON CURRENT ATTENDANCE AREAS)
SCHOOL OF ATTENDANCE
Transfer Out Rates
Archer Glen ES
507
486
6
10
5
4.1%
Edy Ridge ES
534
4
517
9
4
3.2%
Hopkins ES
549
17
5
510
17
7.1%
Middleton ES
606
11
6
3
586
3.3%
K-5 Sub-Totals:
2,196
518
534
532
612
PK
K-5 Totals:
28 4 24 2,252
0 0 7 525
0 0 5 539
28 0 7 567
0 4 5 621
# Enrolled, But Not Living in Attendance Area: Open Enrollment % ("Transfer In" %):
121
39
22
29
31
5.5%
7.5%
4.1%
5.5%
5.1%
Attendance Area
Special Education: Out of District:
District-wide
Prepared by Davis Demographics and Planning, Inc.
N UE
INVERURIE RD
AVE 72ND AVENUE
72ND
90TH AVE
86TH AVENUE
55TH AVENUE RO
AD
FROBASE ROAD
GA G
82A
95TH AVENUE E FIR A V
ON
ES
FE
RR YR
OA RO
GU
EL
N
60TH AVENUE
D
NV I LLE
RO
AD
BOBERG ROAD
KINSMAN ROAD PROPOSED ROAD
E IV DR IS O
D
BO
O AD ER R YR SF ON
R LE VIL
RI V
HOMESTEADER ROAD
BOECKMAN ROAD
MAIN STREET
GA TE D
ADVANCE ROAD
Archer Glen ES BRUCK LANE
IV
STAFFORD ROAD
RIDDER ROAD
SO
DR
EB
GR AH S WIL
ST
E
ROSE LANE WIL
D
LL B
EA
CANYON CREEK RO AD
AN
REEWAY
E
82C
82ND AVENUE
NORWOOD ROAD
65TH AVENUE
HIG PAC IFIC
70TH AVE
HWA Y
TETON AVENUE
108TH AVENUE 106TH AVENUE
105TH AVENUE
PROPOSED ROAD
92ND AV E NUE
E TRAIL SHAWNE
118TH AVENUE
UE
115TH AVENUE
ET ST RE
AM
145TH AVENUE
147TH AVENUE
MCCONNELL ROAD
IOWA DRIVE
RTLAND F
ROBBINS ROAD
ELLIGSEN ROAD
VI
RD
R
E
PACIFIC HIGHWAY
D
170TH AVENUE
OBERST LANE
OA LR HI L DD LA
D
HEATER RD
BAKER ROAD
IF PACIF IC IC HIG HI HW GH AY W AY
PA C
OL D RO A REIN
124TH AVEN
GERDA LANE
N O
O RE
G
CE OLDS PL A
SEELY LANE
ELWERT ROAD
EASTVIEW ROAD
RAMBLIN RECK ROAD
AEBISCHER
ROAD
207TH AVENUE
IVE
GARLAND ROAD
DR
MOUNTAIN HOME ROAD
NT
RD
RO
TS ER
EAST PO
A DRIV
ALSE
CLAY STREET
LL
1.5 Miles
MA
IN
0.75
SILETZ DRIVE
GREENHILL LANE
BE
April 12, 2016
0
CA
QU RD
AD
BELL ROAD
D OA
AVERY STREET
84
TOOZE ROAD
BORLAND ROAD
SAGERT STREET
HE
AT L
86B
SMITH RD
JOSHUA STREET
E
85A
Map Prepared by
W R
TM
NYBERG LANE
DAY ROAD CAHALIN ROAD
MORGAN ROAD
KE
N
AD
HEATER RO
I TA
RO
82B 83
ELLMAN LANE
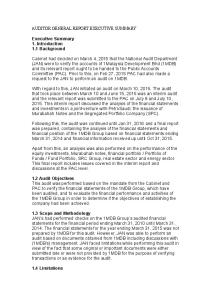
Elementary School AN Attendance Boundaries W KENNY STREET CE M and MCEWAN ROAD Study Areas DAW N ST JEAN ROAD
RD
CHILDS ROAD
TONQUIN ROAD
BA
85B
D
N OU
T RE
86C
N TO
86A
75
BAKER ROAD
5
Sherwood School District
IBACH STREET
73
72
BOND STREET
75TH AVENUE N UE 78TH AVE
30
24B
N
E
D
5
HELLS CANYON ROAD
R PA
41
5
Hopkins ES
STREET 37 34 36 WILLAMETTE 42 40 VILLA ROAD 31 74 64 71 43 56 39 76 38 59 63 Archer Glen ES Middleton ES SUNSET BLVD 65 69 77 47 51 54 68 62 58 HIGHPOINT DRIVE 81 49 53 46C 61 67 79 80 BROOKMAN ROAD 86D
SSE ROA
BELL ROAD
K E RO A
LABROU
195TH PLACE
87
MEINEC
29 25A
MC
6
32
MA
E NU H AV
9
7
5
RINGER STREET
10
24A
KE LN
5
26 27
HER
DAHL
Edy Ridge ES
8
HAIDE ROAD
20
23B
D
A RO
112T
14 EDY ROAD
18A 18C 19 21
OA D
15
23A
VD BL
AD
16
LEVETON DRIVE
LE R
CONZELMANN ROAD
45 CHAPMAN ROAD
¯
PA
22
OD
U
R GE
RO
108TH AVENUE
113TH AVENUE
HAZELBROOK ROAD
RI V
CIPO
CAPPOEN RD
LEBEAU ROAD
D IC CIF
ASHFORD STREET
E
DURHAM ROAD
TUALATIN ROAD
WO ER
KR
4
IELD DRIV
PARKWAY AVE
150TH AVENUE
APRIL LANE
FISCHER ROAD TIMARA LANE
SH
SCHMELTZER ROAD
MACBETH DRIVE
E
3
2
D
ND ROAD
BROWN ROAD
SCHOLLS-SHERWOOD ROA
BEEF BE
110TH AVENUE
1
ROY ROGERS ROAD
192ND AVENUE
PASCUZZI LANE
BELTON ROAD
SWANK ROAD SEIFFERT ROAD
LASICH LANE
SUMMERF
5
Schools
Edy Ridge ES
streets
Hopkins ES
StudyAreas
Middleton ES EILER
S RO
AD
Sherwood School District
Methodology for Fall 2015 Projections
Elementary School Attendance Area 10-Year Projections Attendance Area Archer Glen ES ACTUAL 2015 2016 2017 K 89.0 81.9 89.3 1 79.0 105.9 97.4 2 90.0 78.2 104.9 3 77.0 96.3 83.7 4 99.0 78.5 98.2 5 73.0 100.0 79.3 K-5
507.0
540.8
552.8
Projection PROJECTED 2018 87.5 109.0 98.8 114.7 87.8 101.6 599.4
Date 10/7/2015 RESIDENT STUDENTS 2019 2020 83.9 91.2 108.3 104.0 111.5 110.7 109.5 123.1 120.7 115.4 92.2 125.4
2021 91.5 112.8 106.5 122.3 129.2 120.1
2022 92.7 113.1 115.2 117.8 128.4 134.1
2023 95.6 114.6 115.5 127.0 123.8 133.3
2024 95.0 115.5 114.9 125.2 131.1 126.5
2025 94.3 113.1 114.4 122.9 127.7 132.4
626.1
682.4
701.3
709.8
708.2
704.8
669.8
Attendance Area Edy Ridge ACTUAL 2015 2016 K 69.0 64.7 1 94.0 80.0 2 91.0 105.7 3 100.0 98.7 4 93.0 101.2 5 87.0 96.1
ES
Projection Date 10/7/2015 PROJECTED RESIDENT STUDENTS 2017 2018 2019 2020 2021 72.6 69.9 64.4 68.6 67.4 76.9 84.9 79.7 73.4 78.2 91.9 87.4 94.2 88.5 81.5 116.0 100.3 93.5 100.8 94.7 101.4 117.9 100.3 93.5 100.8 106.0 105.3 120.2 102.3 95.4
2022 66.8 76.8 86.8 87.2 94.7 102.8
2023 67.6 76.2 85.2 92.9 87.2 96.6
2024 67.2 77.0 84.6 91.2 92.9 88.9
2025 67.2 76.6 85.5 90.5 91.2 94.8
K-5
564.8
518.0
515.1
505.7
501.8
505.8
Attendance Area Hopkins ES Projection Date 10/7/2015 ACTUAL PROJECTED RESIDENT STUDENTS 2015 2016 2017 2018 2019 2020 K 90.0 82.8 91.2 87.3 81.3 86.6 1 92.0 104.4 97.2 106.7 101.8 94.3 2 81.0 96.6 110.6 102.8 112.5 106.9 3 97.0 85.0 102.4 117.0 108.4 118.1 4 98.0 103.8 92.0 110.4 125.6 116.0 5 91.0 101.9 108.9 96.5 115.3 130.6
2021 87.2 103.0 101.3 114.6 128.8 123.0
2022 89.8 106.2 112.7 111.0 127.3 138.5
2023 93.1 109.2 116.1 122.9 123.4 136.9
2024 95.0 113.1 119.2 126.4 136.2 132.9
2025 97.1 115.0 123.0 129.5 139.7 145.9
K-5
657.9
685.5
701.6
722.8
750.2
Attendance Area Middleton ES Projection Date 10/7/2015 ACTUAL PROJECTED RESIDENT STUDENTS 2015 2016 2017 2018 2019 2020 2021 K 89.0 81.9 89.3 86.3 82.0 88.7 87.7 1 79.0 97.0 89.2 98.6 96.6 91.9 98.5 2 109.0 83.7 102.8 95.9 107.0 104.8 99.2 3 112.0 113.4 87.1 108.2 102.1 113.7 110.7 4 101.0 113.1 114.5 89.2 111.6 105.5 116.5 5 116.0 106.1 118.8 121.5 96.1 119.6 112.5
2022 87.8 97.4 106.1 104.9 113.5 124.0
2023 89.7 97.6 105.0 112.1 107.6 120.9
2024 89.8 99.2 104.8 110.5 114.6 114.4
2025 89.2 97.9 105.2 109.0 111.6 120.3
K-5
633.7
632.9
633.3
633.2
534.0
549.0
606.0
546.4
574.5
595.2
602.3
601.7
565.7
620.7
599.7
552.3
644.9
595.4
527.1
652.5
624.2
625.1
Above projections EXCLUDE Out-of-District, special education, and PreK students. Please see the Elementary School K-5 Attendance Matrix for a detailed breakdown of these student groups.
Davis Demographics & Planning, Inc.
Page 1
April 12, 2016
Sherwood School District
Fall 2015/2016 Projection Report
Fall 2015/2016 6-8 (Middle School) Attendance Matrix "Open Enrollment" Patterns
SCHOOL OF RESIDENCE (BASED ON CURRENT ATTENDANCE AREAS)
SCHOOL OF ATTENDANCE
Attendance Area
Laurel Ridge MS
Sherwood MS 6-8 Sub-Totals: Special Education: Out of District: 6-8 Totals: # Enrolled, But Not Living in Attendance Area: Open Enrollment % ("Transfer In" %):
6-8 Students
Laurel Ridge MS
Sherwood MS
Transfer Out Rates
481
464
17
3.5%
718 1,199
19 483
699 716
2.6%
5 19 1,223
1 5 489
4 14 734
55
24
31
4.6%
5.0%
4.3%
District-wide
Prepared by Davis Demographics and Planning, Inc.
Page XX
INVERURIE RD
AVE 72ND AVENUE
72ND
PROPOSED ROAD
N UE
AD RO E GA G
82A
95TH AVENUE E FIR A V
ON
ES
FE
RR YR
OA
60TH AVENUE
D
NV I LLE
RO
AD
BOBERG ROAD
KINSMAN ROAD PROPOSED ROAD
BO
D
BROWN ROAD
E IV DR IS O
ON
R LE VIL
BOECKMAN ROAD
MAIN STREET
RO
GU
EL
N
GA TE D
RI V
HOMESTEADER ROAD
ADVANCE ROAD
Laurel Ridge MS BRUCK LANE
IV
STAFFORD ROAD
RIDDER ROAD
O AD ER R YR SF AM GR AH S WIL
ST
E
Sherwood MS
SO
DR
LL B
EA
ROSE LANE WIL
D
REEWAY
55TH AVENUE
82ND AVENUE
65TH AVENUE
HWA Y HIG PAC IFIC
70TH AVE
108TH AVENUE
92ND AV E NUE
E TRAIL SHAWNE
90TH AVE
FROBASE ROAD
CANYON CREEK RO AD
AN
RTLAND F
ROBBINS ROAD
NORWOOD ROAD
82C
84
BAKER ROAD
145TH AVENUE
86TH AVENUE
115TH AVENUE
105TH AVENUE
UE
118TH AVENUE
TETON AVENUE
IOWA DRIVE
PACIFIC HIGHWAY
BAKER ROAD
E
A DRIV
ALSE
108TH AVENUE 106TH AVENUE
LANE
147TH AVENUE
MCCONNELL ROAD
AT L
EB
HEATER RD
124TH AVEN
GERDA LANE
CE OLDS PL A
BALER WAY
D
170TH AVENUE
OBERST LANE
OA LR HI L DD LA
D RO A REIN
BRITTANY
PINE STREET
PINEHURST DRIVE
W AY
HI GH C IF I
PA C
OL D
SEELY LANE
ELWERT ROAD
EASTVIEW ROAD
RAMBLIN RECK ROAD
207TH AVENUE
GARLAND ROAD
EAST PO
ELLIGSEN ROAD
VI
CAPPOEN RD
ROAD AEBISCHER
MOUNTAIN HOME ROAD
SILETZ DRIVE
HE
RD
R
AVERY STREET
75TH AVENUE N UE 78TH AVE
W
TOOZE ROAD
BORLAND ROAD
SAGERT STREET
CLAY STREET
LL
RO
TS ER
NYBERG LANE
GREENHILL LANE
BE
April 12, 2016
1.5 Miles
D OA
CHILDS ROAD
DAY ROAD CAHALIN ROAD
MORGAN ROAD
86B
SMITH RD
0.75
82B 83
BELL ROAD
0
IVE
AD
Map Prepared by
IV E
ELLMAN LANE
Middle School AN Attendance Boundaries W KENNY STREET CE M and MCEWAN ROAD Study Areas DAW N ST JEAN ROAD
RD
JOSHUA STREET
E
85A
Sherwood School District
TONQUIN ROAD
RD
TM
AD
81
DR
R
85B
EY
KE
N
79
BA
I TA
RO
HEATER RO
R PA
86C
D
¯
HELLS CANYON ROAD
T RE
68
77 KI NL
DR
86A
N OU
67
BROOKMAN ROAD 86D
SSE ROA
BELL ROAD
62
58 61
LABROU
87
54
MC
RD
47 49 53 46C
69
IN
RINGER STREET
46A
63 65
SUNSET BLVD
74 75
71
QU
195TH PLACE
45 CHAPMAN ROAD
59
64
38
NT
51
VILLA ROAD
N TO
56
44
5WILLAMETTE STREET
36
MA
42
37
CA
AV
IV
BOND STREET
IBACH STREET
D
W
DH OO
DR
Sherwood MS
OA
EN
31
MC
E
5
OA D
N
E
E CK E R
6
24B 30 24A
MA
E NU H AV
7
23B
KE LN
5
43
21
Laurel Ridge MS 26 27 12 20 32 10 29 9 34 MEIN
8
HAIDE ROAD
19 18B
HER
A RO
112T
14
18A
OA D
AD
15
23A
D
DAHL
RO
16
LE R
CONZELMANN ROAD
LEVETON DRIVE
CIPO
22
RI V
R IN
UG
ER
113TH AVENUE
HIGHW AY
HAZELBROOK ROAD
QU
KR
4
PA
D IC CIF
ASHFORD STREET
E
DURHAM ROAD
TUALATIN ROAD
LEBEAU ROAD
EDY ROAD
IELD DRIV
PARKWAY AVE
150TH AVENUE
APRIL LANE
FISCHER ROAD TIMARA LANE
N TO
SCHMELTZER ROAD
MACBETH DRIVE
E
3
2
D
ND ROAD
110TH AVENUE
SCHOLLS-SHERWOOD ROA
BEEF BE
PACIF IC
1
ROY ROGERS ROAD
192ND AVENUE
PASCUZZI LANE
BELTON ROAD
SWANK ROAD SEIFFERT ROAD
LASICH LANE
SUMMERF
EILER
S RO
AD
5
Schools streets StudyAreas
Sherwood School District
Methodology for Fall 2015 Projections
Middle School Attendance Area 10-Year Projections Attendance Area Laurel Ridge MS ACTUAL 2015 2016 2017 K 121.0 112.5 124.8 1 140.0 136.7 129.0 2 149.0 154.4 152.0 3 169.0 159.0 166.7 4 158.0 170.9 162.3 5 156.0 164.3 179.2 6 159.0 168.3 179.3 7 154.0 160.6 171.4 8 168.0 158.4 167.0
Projection Date 10/7/2015 PROJECTED RESIDENT STUDENTS 2018 2019 2020 120.8 112.9 121.2 143.0 137.0 128.1 143.9 157.6 151.0 164.0 154.0 168.5 170.3 166.3 156.3 170.5 177.0 173.4 195.6 185.1 193.1 182.8 197.7 187.3 178.2 188.5 203.8
2021 119.9 137.3 141.2 161.4 170.8 163.1 187.8 195.5 193.2
2022 119.8 135.8 151.2 151.0 163.8 178.1 176.6 189.8 201.8
2023 122.0 135.7 149.6 161.6 153.3 170.9 192.6 178.6 195.7
2024 122.0 137.8 149.1 159.5 163.6 159.8 184.3 194.3 183.9
2025 121.4 136.3 149.9 157.6 160.2 169.0 171.0 184.6 198.5
576.5
568.2
566.9
562.5
554.1
Attendance Area Sherwood MS Projection Date 10/7/2015 ACTUAL PROJECTED RESIDENT STUDENTS 2015 2016 2017 2018 2019 2020 K 216.0 198.7 217.6 210.2 198.7 213.9 1 204.0 250.6 231.7 256.2 249.4 235.6 2 222.0 209.8 258.2 241.0 267.6 260.0 3 217.0 234.4 222.5 276.2 259.6 287.2 4 233.0 225.8 243.8 235.0 291.8 274.1 5 211.0 239.7 233.9 254.4 246.8 304.6 6 221.0 223.6 255.7 251.6 274.2 266.8 7 257.0 228.7 232.1 268.4 265.3 287.7 8 240.0 263.7 235.6 241.4 280.4 276.7
2021 213.9 255.2 247.3 280.9 304.4 287.9 329.8 282.7 301.1
2022 217.4 257.7 269.6 269.8 300.1 321.3 314.3 350.2 298.6
2023 224.0 261.8 272.2 293.4 288.7 316.8 349.9 334.2 367.9
2024 225.1 267.1 274.4 293.9 311.1 302.9 343.0 369.1 349.4
2025 226.5 266.3 278.1 294.3 310.0 324.3 326.4 360.1 383.4
6-8
913.6
963.1
1052.0
1061.5
1069.9
6-8
481.0
718.0
487.3
716.0
517.7
723.4
556.6
761.4
571.3
819.9
584.2
831.2
Above projections EXCLUDE Out-of-District, special education. Please see the Middle School 6-8 Attendance Matrix for a detailed breakdown of these student groups.
Davis Demographics & Planning, Inc.
Page 2
April 12, 2016
Sherwood School District
Methodology for Fall 2015 Projections
High School Attendance Area 10-Year Projections Attendance Area Sherwood HS Projection Date 10/7/2015 ACTUAL PROJECTED RESIDENT STUDENTS 2015 2016 2017 2018 2019 2020 K 337.0 311.2 342.4 331.0 311.5 335.1 1 344.0 387.4 360.7 399.3 386.4 363.6 2 371.0 364.2 410.2 384.9 425.2 411.0 3 386.0 393.4 389.2 440.2 413.6 455.7 4 391.0 396.7 406.2 405.3 458.2 430.4 5 367.0 404.1 413.1 424.9 423.8 478.0 6 380.0 391.9 435.0 447.2 459.4 459.9 7 411.0 389.2 403.5 451.1 463.0 475.0 8 408.0 422.2 402.6 419.6 469.0 480.5 9 428.0 427.6 444.1 424.9 442.8 495.7 10 399.0 422.8 423.9 441.7 423.3 440.3 11 375.0 394.0 419.6 422.2 439.4 421.3 12 335.0 364.6 385.0 411.4 414.1 429.8 9-12
1537.0
1609.0
1672.6
1700.2
1719.6
1787.1
2021 333.7 392.5 388.5 442.3 475.3 451.0 517.5 478.2 494.3 507.5 493.3 439.4 414.2
2022 337.2 393.5 420.9 420.8 463.9 499.4 490.9 540.0 500.4 525.4 507.2 492.6 433.1
2023 346.0 397.5 421.8 455.0 442.0 487.7 542.5 512.9 563.6 531.0 523.7 506.8 484.5
2024 347.1 404.9 423.5 453.4 474.8 462.7 527.3 563.3 533.3 594.7 528.8 520.9 496.8
2025 347.9 402.6 428.1 451.9 470.2 493.3 497.4 544.7 581.9 560.5 589.2 524.0 508.2
1854.4
1958.3
2046.0
2141.2
2181.9
Above projections EXCLUDE Out-of-District and special education.
Davis Demographics & Planning, Inc.
Page 3
April 12, 2016