Japanese Cherry Packet - Sapporo (Group 1) Using the data in this packet your group will: ● Create and analyse a graph ● Create a trend line ● Compare Cherry Flowering to Temperature data ● Determine the story the data is telling 1. Graph the First Flowering data in the table below into the graph template. Year
First Flowering (Day of Year)
1980
135
1981
125
1982
124
1983
118
1984
133
1985
123
1986
125
1987
126
1988
124
1989
119
1990
115
1991
122
1992
125
1993
126
1994
126
1995
121
1996
126
1997
121
1998
124
1999
119
2000
115
2001
122
2002
125
2003
126
2004
126
2005
121
2. Create a trend line. a. As you look at the data you just graphed, you can see a basic trend in the data. The data is either trending downward or upward. b. Using a ruler, attempt to draw the trend line that best fits the trend that you see.
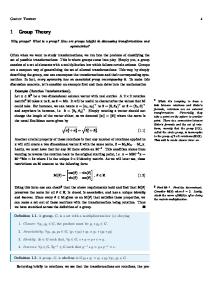
3. Compare the First Flowering graph you made above with the Mean Annual Temperature graph from the same region below.
4. What do you notice about the difference in the trend lines of each graph?
5. How does this difference in trend lines makes sense?
6. In the “Your response” column of the table below answer the associated questions. You will compare your responses to 3 other groups who have analysed different data in the next step. Your response Compare 1
Is the slope positive or negative? According to your trend line is the flowering of the Japanese Cherry happening earlier or later as time progresses? Assuming the trend continues, predict when flowering should occur in the year 2050. What was the earliest DOY your data showed the trees flowering What year did this earliest DOY occur? What is the relationship between the temperature graph and the First Flowering graph? Do you think temperature has an effect on the First Flowering of the Japanese Cherry?
Compare 2
Compare 3
7. Fill in the rest of the table by visiting 3 other groups. 8. Describe the similarities of your data with other groups data.
9. What were the differences between the groups?
10. The data you graphed is for Japanese Cherry in a specific city. Do you think the flowering would be the same in different parts of Japan?
11. There are many Japanese Cherry trees growing in Washington D.C. Do you think the graph of data for those trees would be identical to the one you created? a. Why or why not?
b. 12. Write a summary of your findings.
Japanese Cherry Packet - Fukushima (Group 2) Using the data in this packet your group will: ● Create and analyse a graph ● Create a trend line ● Compare Cherry Flowering to Temperature data ● Determine the story the data is telling 1. Graph the First Flowering data in the table below into the graph template. Year
First Flowering (Day of Year)
1980
104
1981
102
1982
98
1983
100
1984
116
1985
104
1986
107
1987
96
1988
107
1989
91
1990
93
1991
99
1992
96
1993
102
1994
98
1995
99
1996
106
1997
98
1998
97
1999
95
2000
104
2001
98
2002
88
2003
98
2004
94
2005
101
2. Create a trend line. a. As you look at the data you just graphed, you can see a basic trend in the data. The data is either trending downward or upward. b. Using a ruler, attempt to draw the trend line that best fits the trend that you see.
3. Compare the First Flowering graph you made above with the Mean Annual Temperature graph from the same region below.
4. What do you notice about the difference in the trend lines of each graph?
5. How does this difference in trend lines makes sense?
6. In the “Your response” column of the table below answer the associated questions. You will compare your responses to 3 other groups who have analysed different data in the next step. Your response Compare 1
Is the slope positive or negative? According to your trend line is the flowering of the Japanese Cherry happening earlier or later as time progresses? Assuming the trend continues, predict when flowering should occur in the year 2050. What was the earliest DOY your data showed the trees flowering What year did this earliest DOY occur? What is the relationship between the temperature graph and the First Flowering graph? Do you think temperature has an effect on the First Flowering of the Japanese Cherry?
Compare 2
Compare 3
7. Fill in the rest of the table by visiting 3 other groups. 8. Describe the similarities of your data with other groups data.
9. What were the differences between the groups?
10. The data you graphed is for Japanese Cherry in a specific city. Do you think the flowering would be the same in different parts of Japan?
11. There are many Japanese Cherry trees growing in Washington D.C. Do you think the graph of data for those trees would be identical to the one you created? a. Why or why not?
12. Write a summary of your findings.
Japanese Cherry Packet - Nagano (Group 3) Using the data in this packet your group will: ● Create and analyse a graph ● Create a trend line ● Compare Cherry Flowering to Temperature data ● Determine the story the data is telling 1. Graph the First Flowering data in the table below into the graph template. Year
First Flowering (Day of Year)
1980
109
1981
107
1982
103
1983
103
1984
117
1985
103
1986
110
1987
99
1988
111
1989
96
1990
97
1991
102
1992
100
1993
108
1994
105
1995
107
1996
114
1997
101
1998
100
1999
100
2000
109
2001
100
2002
92
2003
105
2004
97
2005
104
2. Create a trend line. a. As you look at the data you just graphed, you can see a basic trend in the data. The data is either trending downward or upward. b. Using a ruler, attempt to draw the trend line that best fits the trend that you see.
3. Compare the First Flowering graph you made above with the Mean Annual Temperature graph from the same region below.
4. What do you notice about the difference in the trend lines of each graph?
5. How does this difference in trend lines makes sense?
6. In the “Your response” column of the table below answer the associated questions. You will compare your responses to 3 other groups who have analysed different data in the next step. Your response Compare 1
Is the slope positive or negative? According to your trend line is the flowering of the Japanese Cherry happening earlier or later as time progresses? Assuming the trend continues, predict when flowering should occur in the year 2050. What was the earliest DOY your data showed the trees flowering What year did this earliest DOY occur? What is the relationship between the temperature graph and the First Flowering graph? Do you think temperature has an effect on the First Flowering of the Japanese Cherry?
Compare 2
Compare 3
7. Fill in the rest of the table by visiting 3 other groups. 8. Describe the similarities of your data with other groups data.
9. What were the differences between the groups?
10. The data you graphed is for Japanese Cherry in a specific city. Do you think the flowering would be the same in different parts of Japan?
11. There are many Japanese Cherry trees growing in Washington D.C. Do you think the graph of data for those trees would be identical to the one you created? a. Why or why not?
12. Write a summary of your findings.
Japanese Cherry Packet - Nagoya (Group 4) Using the data in this packet your group will: ● Create and analyse a graph ● Create a trend line ● Compare Cherry Flowering to Temperature data ● Determine the story the data is telling 1. Graph the First Flowering data in the table below into the graph template. Year
First Flowering (Day of Year)
1980
90
1981
87
1982
82
1983
90
1984
102
1985
87
1986
91
1987
84
1988
94
1989
76
1990
76
1991
87
1992
81
1993
85
1994
90
1995
86
1996
89
1997
82
1998
81
1999
83
2000
94
2001
85
2002
78
2003
83
2004
83
2005
90
2. Create a trend line. a. As you look at the data you just graphed, you can see a basic trend in the data. The data is either trending downward or upward. b. Using a ruler, attempt to draw the trend line that best fits the trend that you see.
3. Compare the First Flowering graph you made above with the Mean Annual Temperature graph from the same region below.
4. What do you notice about the difference in the trend lines of each graph?
5. How does this difference in trend lines makes sense?
6. In the “Your response” column of the table below answer the associated questions. You will compare your responses to 3 other groups who have analysed different data in the next step. Your response Compare 1
Is the slope positive or negative? According to your trend line is the flowering of the Japanese Cherry happening earlier or later as time progresses? Assuming the trend continues, predict when flowering should occur in the year 2050. What was the earliest DOY your data showed the trees flowering What year did this earliest DOY occur? What is the relationship between the temperature graph and the First Flowering graph? Do you think temperature has an effect on the First Flowering of the Japanese Cherry?
Compare 2
Compare 3
7. Fill in the rest of the table by visiting 3 other groups. 8. Describe the similarities of your data with other groups data.
9. What were the differences between the groups?
10. The data you graphed is for Japanese Cherry in a specific city. Do you think the flowering would be the same in different parts of Japan?
11. There are many Japanese Cherry trees growing in Washington D.C. Do you think the graph of data for those trees would be identical to the one you created? a. Why or why not?
12. Write a summary of your findings.
Japanese Cherry Packet - Tokyo (Group 5) Using the data in this packet your group will: ● Create and analyse a graph ● Create a trend line ● Compare Cherry Flowering to Temperature data ● Determine the story the data is telling 1. Graph the First Flowering data in the table below into the graph template. Year
First Flowering (Day of Year)
1980
91
1981
85
1982
82
1983
90
1984
102
1985
93
1986
93
1987
82
1988
93
1989
79
1990
79
1991
89
1992
84
1993
83
1994
90
1995
90
1996
91
1997
80
1998
86
1999
83
2000
90
2001
82
2002
75
2003
86
2004
78
2005
90
2. Create a trend line. a. As you look at the data you just graphed, you can see a basic trend in the data. The data is either trending downward or upward. b. Using a ruler, attempt to draw the trend line that best fits the trend that you see.
3. Compare the First Flowering graph you made above with the Mean Annual Temperature graph from the same region below.
4. What do you notice about the difference in the trend lines of each graph?
5. How does this difference in trend lines makes sense?
6. In the “Your response” column of the table below answer the associated questions. You will compare your responses to 3 other groups who have analysed different data in the next step. Your response Compare 1
Is the slope positive or negative? According to your trend line is the flowering of the Japanese Cherry happening earlier or later as time progresses? Assuming the trend continues, predict when flowering should occur in the year 2050. What was the earliest DOY your data showed the trees flowering What year did this earliest DOY occur? What is the relationship between the temperature graph and the First Flowering graph? Do you think temperature has an effect on the First Flowering of the Japanese Cherry?
Compare 2
Compare 3
7. Fill in the rest of the table by visiting 3 other groups. 8. Describe the similarities of your data with other groups data.
9. What were the differences between the groups?
10. The data you graphed is for Japanese Cherry in a specific city. Do you think the flowering would be the same in different parts of Japan?
11. There are many Japanese Cherry trees growing in Washington D.C. Do you think the graph of data for those trees would be identical to the one you created? a. Why or why not?
12. Write a summary of your findings.
Japanese Cherry Packet - Yokohama (Group 6) Using the data in this packet your group will: ● Create and analyse a graph ● Create a trend line ● Compare Cherry Flowering to Temperature data ● Determine the story the data is telling 1. Graph the First Flowering data in the table below into the graph template. Year
First Flowering (Day of Year)
1980
92
1981
86
1982
82
1983
92
1984
101
1985
91
1986
92
1987
80
1988
93
1989
80
1990
77
1991
88
1992
83
1993
83
1994
91
1995
90
1996
89
1997
84
1998
87
1999
83
2000
89
2001
81
2002
74
2003
86
2004
78
2005
92
2. Create a trend line. a. As you look at the data you just graphed, you can see a basic trend in the data. The data is either trending downward or upward. b. Using a ruler, attempt to draw the trend line that best fits the trend that you see.
3. Compare the First Flowering graph you made above with the Mean Annual Temperature graph from the same region below.
4. What do you notice about the difference in the trend lines of each graph?
5. How does this difference in trend lines makes sense?
6. In the “Your response” column of the table below answer the associated questions. You will compare your responses to 3 other groups who have analysed different data in the next step. Your response Compare 1
Is the slope positive or negative? According to your trend line is the flowering of the Japanese Cherry happening earlier or later as time progresses? Assuming the trend continues, predict when flowering should occur in the year 2050. What was the earliest DOY your data showed the trees flowering What year did this earliest DOY occur? What is the relationship between the temperature graph and the First Flowering graph? Do you think temperature has an effect on the First Flowering of the Japanese Cherry?
Compare 2
Compare 3
7. Fill in the rest of the table by visiting 3 other groups. 8. Describe the similarities of your data with other groups data.
9. What were the differences between the groups?
10. The data you graphed is for Japanese Cherry in a specific city. Do you think the flowering would be the same in different parts of Japan?
11. There are many Japanese Cherry trees growing in Washington D.C. Do you think the graph of data for those trees would be identical to the one you created? a. Why or why not?
12. Write a summary of your findings.
Japanese Cherry Packet - Kyoto (Group 7) Using the data in this packet your group will: ● Create and analyse a graph ● Create a trend line ● Compare Cherry Flowering to Temperature data ● Determine the story the data is telling 1. Graph the First Flowering data in the table below into the graph template. Year
First Flowering (Day of Year)
1980
96
1981
89
1982
83
1983
92
1984
100
1985
92
1986
93
1987
86
1988
96
1989
83
1990
80
1991
89
1992
87
1993
87
1994
93
1995
90
1996
91
1997
85
1998
83
1999
84
2000
94
2001
83
2002
77
2003
87
2004
84
2005
92
2. Create a trend line. a. As you look at the data you just graphed, you can see a basic trend in the data. The data is either trending downward or upward. b. Using a ruler, attempt to draw the trend line that best fits the trend that you see.
3. Compare the First Flowering graph you made above with the Mean Annual Temperature graph from the same region below.
4. What do you notice about the difference in the trend lines of each graph?
5. How does this difference in trend lines makes sense?
6. In the “Your response” column of the table below answer the associated questions. You will compare your responses to 3 other groups who have analysed different data in the next step. Your response Compare 1
Is the slope positive or negative? According to your trend line is the flowering of the Japanese Cherry happening earlier or later as time progresses? Assuming the trend continues, predict when flowering should occur in the year 2050. What was the earliest DOY your data showed the trees flowering What year did this earliest DOY occur? What is the relationship between the temperature graph and the First Flowering graph? Do you think temperature has an effect on the First Flowering of the Japanese Cherry?
Compare 2
Compare 3
7. Fill in the rest of the table by visiting 3 other groups. 8. Describe the similarities of your data with other groups data.
9. What were the differences between the groups?
10. The data you graphed is for Japanese Cherry in a specific city. Do you think the flowering would be the same in different parts of Japan?
11. There are many Japanese Cherry trees growing in Washington D.C. Do you think the graph of data for those trees would be identical to the one you created? a. Why or why not?
12. Write a summary of your findings.
Japanese Cherry Packet - Hiroshima (Group 8) Using the data in this packet your group will: ● Create and analyse a graph ● Create a trend line ● Compare Cherry Flowering to Temperature data ● Determine the story the data is telling 1. Graph the First Flowering data in the table below into the graph template. Year
First Flowering (Day of Year)
1980
92
1981
89
1982
83
1983
94
1984
99
1985
89
1986
92
1987
84
1988
94
1989
84
1990
79
1991
90
1992
87
1993
85
1994
90
1995
88
1996
92
1997
81
1998
79
1999
86
2000
88
2001
82
2002
79
2003
84
2004
79
2005
93
2. Create a trend line. a. As you look at the data you just graphed, you can see a basic trend in the data. The data is either trending downward or upward. b. Using a ruler, attempt to draw the trend line that best fits the trend that you see.
3. Compare the First Flowering graph you made above with the Mean Annual Temperature graph from the same region below.
4. What do you notice about the difference in the trend lines of each graph?
5. How does this difference in trend lines makes sense?
6. In the “Your response” column of the table below answer the associated questions. You will compare your responses to 3 other groups who have analysed different data in the next step. Your response Compare 1
Is the slope positive or negative? According to your trend line is the flowering of the Japanese Cherry happening earlier or later as time progresses? Assuming the trend continues, predict when flowering should occur in the year 2050. What was the earliest DOY your data showed the trees flowering What year did this earliest DOY occur? What is the relationship between the temperature graph and the First Flowering graph? Do you think temperature has an effect on the First Flowering of the Japanese Cherry?
Compare 2
Compare 3
7. Fill in the rest of the table by visiting 3 other groups. 8. Describe the similarities of your data with other groups data.
9. What were the differences between the groups?
10. The data you graphed is for Japanese Cherry in a specific city. Do you think the flowering would be the same in different parts of Japan?
11. There are many Japanese Cherry trees growing in Washington D.C. Do you think the graph of data for those trees would be identical to the one you created? a. Why or why not?
12. Write a summary of your findings.
Japanese Cherry Packet - Osaka (Group 9) Using the data in this packet your group will: ● Create and analyse a graph ● Create a trend line ● Compare Cherry Flowering to Temperature data ● Determine the story the data is telling 1. Graph the First Flowering data in the table below into the graph template. Year
First Flowering (Day of Year)
1980
94
1981
87
1982
82
1983
90
1984
101
1985
88
1986
92
1987
84
1988
96
1989
84
1990
80
1991
88
1992
86
1993
88
1994
90
1995
90
1996
91
1997
86
1998
84
1999
83
2000
93
2001
84
2002
79
2003
86
2004
83
2005
93
2. Create a trend line. a. As you look at the data you just graphed, you can see a basic trend in the data. The data is either trending downward or upward. b. Using a ruler, attempt to draw the trend line that best fits the trend that you see.
3. Compare the First Flowering graph you made above with the Mean Annual Temperature graph from the same region below.
4. What do you notice about the difference in the trend lines of each graph?
5. How does this difference in trend lines makes sense?
6. In the “Your response” column of the table below answer the associated questions. You will compare your responses to 3 other groups who have analyzed different data in the next step. Your response Compare 1
Is the slope positive or negative? According to your trend line is the flowering of the Japanese Cherry happening earlier or later as time progresses? Assuming the trend continues, predict when flowering should occur in the year 2050. What was the earliest DOY your data showed the trees flowering What year did this earliest DOY occur? What is the relationship between the temperature graph and the First Flowering graph? Do you think temperature has an effect on the First Flowering of the Japanese Cherry?
Compare 2
Compare 3
7. Fill in the rest of the table by visiting 3 other groups. 8. Describe the similarities of your data with other groups data.
9. What were the differences between the groups?
10. The data you graphed is for Japanese Cherry in a specific city. Do you think the flowering would be the same in different parts of Japan?
11. There are many Japanese Cherry trees growing in Washington D.C. Do you think the graph of data for those trees would be identical to the one you created? a. Why or why not?
12. Write a summary of your findings.
Japanese Cherry Packet - Nagasaki (Group 10) Using the data in this packet your group will: ● Create and analyse a graph ● Create a trend line ● Compare Cherry Flowering to Temperature data ● Determine the story the data is telling 1. Graph the First Flowering data in the table below into the graph template. Year
First Flowering (Day of Year)
1980
87
1981
81
1982
78
1983
88
1984
91
1985
88
1986
86
1987
82
1988
92
1989
77
1990
74
1991
86
1992
82
1993
89
1994
89
1995
90
1996
83
1997
77
1998
83
1999
81
2000
86
2001
81
2002
78
2003
78
2004
83
2005
91
2. Create a trend line. a. As you look at the data you just graphed, you can see a basic trend in the data. The data is either trending downward or upward. b. Using a ruler, attempt to draw the trend line that best fits the trend that you see.
3. Compare the First Flowering graph you made above with the Mean Annual Temperature graph from the same region below.
4. What do you notice about the difference in the trend lines of each graph?
5. How does this difference in trend lines makes sense?
6. In the “Your response” column of the table below answer the associated questions. You will compare your responses to 3 other groups who have analysed different data in the next step. Your response Compare 1
Is the slope positive or negative? According to your trend line is the flowering of the Japanese Cherry happening earlier or later as time progresses? Assuming the trend continues, predict when flowering should occur in the year 2050. What was the earliest DOY your data showed the trees flowering What year did this earliest DOY occur? What is the relationship between the temperature graph and the First Flowering graph? Do you think temperature has an effect on the First Flowering of the Japanese Cherry?
Compare 2
Compare 3
7. Fill in the rest of the table by visiting 3 other groups. 8. Describe the similarities of your data with other groups data.
9. What were the differences between the groups?
10. The data you graphed is for Japanese Cherry in a specific city. Do you think the flowering would be the same in different parts of Japan?
11. There are many Japanese Cherry trees growing in Washington D.C. Do you think the graph of data for those trees would be identical to the one you created? a. Why or why not?
12. Write a summary of your findings.