6.2
Comparing and Ordering Fractions, Decimals, and Percents
How can you order numbers that are written as fractions, decimals, and percents?
1
ACTIVITY: Using Fractions, Decimals, and Percents Work with a partner. Decide which number form (fraction, decimal, or percent) is more common. Then find which is greater. a. 7% sales tax
1 20
or — sales tax
b. 0.37 cup of flour
5 8
c. —-inch wrench
3 5
d. 12 — dollars
or
e. 93% test score
5 6
f. 5 — fluid ounces
COMMON CORE Fractions, Decimals, and Percents In this lesson, you will ● compare and order fractions, decimals, and percents. ● solve real-life problems. Learning Standard 7.EE.3
220
Chapter 6
2
1 3
— cup of flour
or
or
0.375-inch wrench
12.56 dollars
or
or
7 8
— test score
5.6 fluid ounces
ACTIVITY: Ordering Numbers Work with a partner to order the following numbers. 1 8
—
11%
3 20
—
0.172
0.32
43%
7%
0.7
5 6
—
a. Decide on a strategy for ordering the numbers. Will you write them all as fractions, decimals, or percents? b. Use your strategy and a number line to order the numbers from least to greatest. (Note: Label the number line appropriately.)
Percents
3
ACTIVITY: The Game of Math Card War Preparation:
Math Practice Make Sense of Quantities
●
Cut index cards to make 40 playing cards.
●
Write each number in the table onto a card.
To Play:
What strategies can you use to determine which number is greater?
●
Play with a partner.
●
Deal 20 cards facedown to each player.
●
Each player turns one card faceup. The player with the greater number wins. The winner collects both cards and places them at the bottom of his or her cards.
●
Suppose there is a tie. Each player lays three cards facedown, then a new card faceup. The player with the greater of these new cards wins. The winner collects all 10 cards and places them at the bottom of his or her cards.
●
Continue playing until one player has all the cards. This player wins the game.
75%
—
3 4
—
1 3
—
3 10
0.3
25%
0.4
0.25
100%
0.27
0.75
66 —%
2 3
12.5%
40%
—
1 4
4%
0.5%
0.04
—
1 100
—
0
30%
5%
—
27 100
0.05
33 —%
1 3
—
2 5
0.333. . .
27%
1%
1
0.01
—
1 20
—
1 8
0.125
—
1 25
—
1 200
0.005
0.666. . .
0%
2 3
4. IN YOUR OWN WORDS How can you order numbers that are written as fractions, decimals, and percents? Give an example with your answer. 5. All but one of the U.S. coins shown has a name that is related to its value. Which one is it? How are the names of the others related to their values?
Use what you learned about ordering numbers to complete Exercises 4 –7, 16, and 17 on page 224. Section 6.2
Comparing and Ordering Fractions, Decimals, and Percents
221
6.2
Lesson
Lesson Tutorials
When comparing and ordering fractions, decimals, and percents, write the numbers as all fractions, all decimals, or all percents.
EXAMPLE
Comparing Fractions, Decimals, and Percents
1
3 20
a. Which is greater, — or 16%? ×5
3 20
Study Tip
3 20
=
Write — as a percent: —
It is usually easier to order decimals or percents than to order fractions.
15 100
— = 15%
×5
15% is less than 16%. So, 16% is the greater number. b. Which is greater, 79% or 0.08? Write 79% as a decimal: 79% = 79.% = 0.79 0.79 is greater than 0.08. So, 79% is the greater number.
7 25
1. Which is greater, 25% or — ? Exercises 4 –15
EXAMPLE
2. Which is greater, 0.49 or 94%?
Real-Life Application
2
You, your sister, and a friend each take the same number of shots 19 25
at a soccer goal. You make 72% of your shots, your sister makes — of her shots, and your friend makes 0.67 of his shots. Who made the fewest shots? 19 25
Remember
Write 72% and — as decimals.
To order numbers from least to greatest, write them as they appear on a number line from left to right.
You: 72% = 72.% = 0.72
×4 19 25
0.66
You: 72% â 0.72
0.68
0.70
0.72
— = 0.76
×4
Graph the decimals on a number line. Friend: 0.67
76 100
=
Sister: —
0.74
Sister:
0.76
19 â 0.76 25
0.78
0.67 is the least number. So, your friend made the fewest shots. 222
Chapter 6
Percents
13 20
3. You make 75% of your shots, your sister makes — of her shots, Exercises 16 –21
EXAMPLE Washington: Wa ash shin ingt gton:
1 50
and your friend makes 0.7 of his shots. Who made the most shots?
3
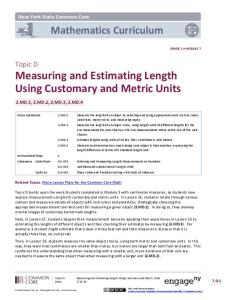
Real-Life Application The map shows the portions of the U.S. population that live in five states.
Michigan: 0.03
York: New Y 6%
California: 0.12
Ohio:
List the five states in order by population from least to greatest.
1 2 25
Begin by writing each portion as a fraction, a decimal, and a percent. State
Fraction
Decimal
Percent
3 100 6 — 100 1 — 50 12 — 100
0.03
3%
0.06
6%
0.02
2%
0.12
12%
0.04
4%
—
Michigan New York Washington California
1 25
—
Ohio
Graph the percent for each state on a number line. Michigan: 3% New York: 6% California: 12% Washington: 2% Ohio: 4%
0%
2%
4%
6%
8%
10%
12%
14%
The states in order by population from least to greatest are Washington, Michigan, Ohio, New York, and California.
2 25
4. The portion of the U.S. population that lives in Texas is —. The
portion that lives in Illinois is 0.042. Reorder the states in Example 3 including Texas and Illinois.
Section 6.2
Comparing and Ordering Fractions, Decimals, and Percents
223
Exercises
6.2
Help with Homework
1. NUMBER SENSE Copy and complete the table.
Fraction
Decimal
18 25
0.72
Percent
2. NUMBER SENSE How would you decide whether 3 5
—
— or 59% is greater? Explain.
3. WHICH ONE DOESN’T BELONG? Which one does not belong with the other three? Explain your reasoning.
17 20 13 50
—
2 5
40%
85%
—
—
0.62 0.04
0.4
45%
6)=3 9+(- 3)= 3+(- 9)= 4+(- = 1) 9+(-
Tell which number is greater. 1
37 50
5. 20%, 0.02
8. 0.086, 86%
9. 76%, 0.67
10. 60%, —
13. 140%, 0.14
14. —, 30%
4 25
12. 17%, —
13 25
6. —, 37%
4. 0.9, 95%
7. 50%, —
5 8
11. 0.12, 1.2%
1 3
7 9
15. 80%, —
Use a number line to order the numbers from least to greatest. 8 25
13 20
2 16. 38%, —, 0.41 43 50
17. 68%, 0.63, —
7 8
3 20
18. —, 0.91, —, 84%
19. 0.15%, —, 0.015 87 200
2 5
21 50
21. —, 0.44, 43.7%, —
20. 2.62, 2 —, 26.8%, 2.26, 271%
22. TEST You answered 21 out of 25 questions correctly on a test. Did you reach your goal of getting at least 80%? 23. POPULATION The table shows the portions of the world population that live in four countries. Order the countries by population from least to greatest.
224
Country
Brazil
India
Russia
United States
Portion of World Population
2.8%
—
7 40
—
1 50
0.044
Chapter 6
Percents
PRECISION Order the numbers from least to greatest. 2 — 11 25. —, 21%, 0.21, —
2 3
24. 66.1%, 0.66, —, 0.667
9
50
Tell which letter shows the graph of the number. 2 5
26. —
27. 45.2% A 0.40
B 0.41
0.42
0.43
C 0.44
4 9
29. —
28. 0.435 D 0.45
0.46
0.47
0.48
0.49
0.50
30. TOUR DE FRANCE The Tour de France is a bicycle road race. The whole race is made up of 21 small races called stages. The table shows how several stages compare to the whole Tour de France in a recent year. Order the stages from shortest to longest. Stage Portion of Total Distance
1
7
8
17
21
11 200
0.044
—
6 125
0.06
4%
—
31. SLEEP The table shows the portions of the day that several animals sleep. a. Order the animals by sleep time from least to greatest.
32.
b. Estimate the portion of the day that you sleep.
Animal
Portion of Day Sleeping
c. Where do you fit on the ordered list?
Dolphin
0.433
Lion Li
56.3% 56 3%
Tell what whole number you can substitute for a in each list so the numbers are ordered from least to greatest. If there is none, explain why. a.
2 a —, —, 33% a 22
b.
1 a —, —, 33% a 8
19 40
Rabbit
—
Squirrel
—
31 50
Tiger
65.8%
Tell whether the ratios form a proportion. (Section 5.2) 6 9 10 15
7 28 16 80
33. —, —
20 35 12 21
34. —, —
35. —, —
36. MULTIPLE CHOICE What is the solution of 2n − 4 > −12? A n < −10 ○
Section 6.2
B n < −4 ○
(Section 4.4)
C n > −2 ○
D n > −4 ○
Comparing and Ordering Fractions, Decimals, and Percents
225