S I N G A P O R E
R e t a i l
M a r k e t
M o n i t o r
Thursday, 16 July 2015
MONEY TALK
BUY
SINGAPORE O&G LTD (SOG SP)
(Initiate Coverage)
Life Begins Here
Share Price
Singapore O&G Ltd. (SOG) was formed in Jan 11 through the efforts of obstetrics and gynaecology (O&G) specialists Dr Lee Keen Whye, Dr Heng Tung Lan and SOG’s CEO Dr Ng Koon Keng. The group currently has 7 physicians, comprising 6 O&G specialists and 1 breast and general surgeon. It operates 8 clinics in 5 different locations in Singapore.
Target Price
S$0.87
Upside
+19.2%
SOG is one of Singapore’s leading niche groups specialising in women’s
Singapore O&G Ltd operates specialist health care facilities catered toward woman in Singapore. The Company provides services in obstetric, gynecology, gyne-oncology, breast and surgical care.
healthcare. Currently, the group has three core business segments: a) obstetrics, b) gynaecology & gynaeoncology, and c) breast disease and general surgery. Most of the group’s medical practitioners have a track record of more than 10 years, while two of the founders, Dr Lee Keen Whye and Dr Heng Tung Lan, hold more than 20 years of experience each.
Well-positioned within the healthcare sector, where market dynamics for private O&G clinics remain lucrative. Compared with the public sector, private O&G clinics offer a wider range of services, boast greater flexibility and could potentially house more experienced specialist medical practitioners. Hence, the demand for private healthcare remains strong. In addition, the barriers of entry to the private O&G sector remain high as it takes about six years to become a fully-registered doctor and another six years to be trained and accredited as an O&G specialist. As a result of both stronger demand and limited supply, private practitioners are able to command a premium over their public sector counterparts.
A solid growth play. We expect SOG’s top-line and bottom line to grow at a 3-year CAGR of 17.1% and 18.6% as SOG’s gynaecology and obstetrics segments grow at a 3-year CAGR of 18% and 15% respectively. The stronger growth from the gynaecology segment is a result of higher revenue intensity as the group undertakes more complicated procedures. In addition, the newly-joined specialists (Dr Cindy Pang and Dr Radhika Lakshmanan) are likely to further contribute to a revenue uplift in 2015.
Attractive dividend payout of up to 90%. Although the group has the intention to distribute up to 90% of its net profit after tax in dividend payouts, we have conservatively assumed an 85% payout for 2015. This implies decent 2015-17 dividend yields of 3-4%. Given that SOG is debt-free, highly cash generative and growing in profitability, we think there is minimal downside risk to its payout commitments.
S$0.73
COMPANY DESCRIPTION
GICS sector
Health Care
Bloomberg ticker:
SOG SP
Shares issued (m):
218.0
Market cap (S$m):
158.1
Market cap (US$m):
116.0
3-mth avg t’over (US$m):
3.0
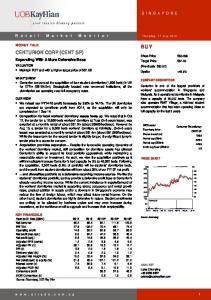
PRICE CHART SINGAPORE O&G LTD
(lcy)
Singapore O&G Ltd/FSSTI Index
0.80
(%) 320 290
0.70
260 0.60
230
0.50
200 170
0.40
140 0.30
110
0.20 100
80 Volume (m)
50 0 Jun 15
Jun 15
Jul 15
Jul 15
Source: Bloomberg
Initiate coverage with a BUY and target price of S$0.87 based on the industry’s average PEG ratio of 1.71x. We conservatively adopted the industry’s average despite SOG having the potential to grow quicker than some of its larger comparables such as Talkmed and Raffles Medical. KEY FINANCIALS Year to 31 Dec (S$m) Net turnover EBITDA EBIT Net profit Adj. net profit EPS (S cent) Adj. EPS (S cent) P/E (x) P/BV (x) EV/EBITDA (x) Dividend yield (%) PATMI margin (%) Net gearing (%) Interest cover (x) ROE (%) Consensus PATMI UOBKH/Consensus (x)
ANALYSTS 2013 8.6 3.8 3.7 3.1 3.1 1.4 1.4 50.7 21.7 31.2 36.1 (0.9) 2,460.0 53.7
2014 13.5 5.2 5.0 4.2 4.2 1.9 1.9 37.2 13.6 22.0 2.4 31.4 (1.0) 5,045.3 45.6
2015F 15.8 6.2 6.0 5.1 5.1 2.3 2.3 31.3 8.0 21.7 2.7 32.0 (0.9) n.m 25.5 n.m
2016F 18.5 7.2 7.1 6.0 6.0 2.8 2.8 26.3 5.1 18.3 3.2 32.4 (0.8) n.m 19.5 n.m
2017F 21.8 8.5 8.4 7.1 7.1 3.2 3.2 22.3 4.2 15.4 3.8 32.5 (0.7) n.m 19.0 n.m
Bennett Lee, CAIA +65 6590 6616
[email protected] Andrew Chow, CFA +65 6590 6633
[email protected]
Source: SOG, UOB Kay Hian
w w w . u t r a d e . c o m . s g
1
S I N G A P O R E
R e t a i l
M a r k e t
M o n i t o r
Thursday, 16 July 2015
INVESTMENT HIGHLIGHTS Highly cash-generative. Since 2013, the group has been debt free and has always been in a positive net cash position. Operating cash flow has likewise been consistently positive and grew from S$2.1m in 2012 to S$4.9m in 2014. We expect operating cash flow to grow to S$7.3m by 2017. As at end-14, the group held S$11.3m in cash. SOG is expected to require S$0.5m-0.6m annually for capex requirements in 2015-16. The main bulk of these expenses involve investment in medical equipment such as ultrasound machines and laparoscopic machines. We think the group is not likely to undertake any debt in the next two years and will internally fund these requirements.
In a strong expansionary mode. The recently bolstered gynaecology and breast surgery segments will likely boost growth further. By 2017, gynaecology revenue is expected to grow at a 3-year CAGR of 18% and increase to S$9.1m. In addition, we are projecting revenue from the breast disease and general surgery segment to grow from S$774,000 in 2015 to S$1m in 2017. We think the group will continue to look out for opportunities to improve on its holistic approach towards women’s healthcare services and we do not rule out an expansion into in vitro fertilisation, gynecological cancer specialties, neo-natal and paediatric services which will further propel growth.
SOG remains differentiated from other medical companies. We note that unlike some of its competitors with heavy cost structures, the group has solid control over its operating costs. SOG’s operating expenses to revenue ratio of 63% is notably lower than its peer average of 75%. This is mainly attributed to the alignment of employee benefits and tighter control over consumable expenses. In addition, we are encouraged by the alignment of interests between the group and the specialists as most of them have equity in SOG. Dr Lee Keen Whye and Dr Heng Tung Lan have a combined stake of more than 50% of the total shareholding in SOG.
Net profit projected to grow at a 3-year CAGR of 18.6% in 2014-17F. We expect strong net profit growth on the back of expanding margins and patient volumes. Revenue will likely outpace operating expenses given SOG’s solid cost control and its ability to expand per patient revenue intensity on the back of a more complex patient profile for its gynaecology consultations. We expect contributions from Dr Cindy Pang and Dr Radhika Lakshmanan to be more significant in 2015 as they ramp up services. We also see room for further upside if patient volumes increase faster than expected or consultation profiles gets unexpectedly more complex.
Room for further margin expansion. We remain optimistic that the group will be able to sustain its strong performance for the rest of 2015 and expect further improvements in margins as SOG ramps up its revenue mix. We think that the group is likely to focus on the higher-margin gynaecology, and breast disease & general surgery businesses while expanding its team of specialists. The operating margin for the group’s gynaecology segment is estimated at 70% while that of its obstetrics segment is at 50%.
Attractive dividend payout of up to 90%. Although SOG has the intention to distribute up to 90% of its net profit after tax in dividend payouts, we have conservatively assumed 85% for 2015. This implies decent 2015-17 dividend yields of 3-4%. Given that SOG is debt-free, highly cash generative and growing in profitability, we think there is minimal downside risk to the payout commitments.
Key risks. The group is subjected to: a) regulations and licensing requirements for its operations, b) its ability to obtain the requisite approvals, licenses and or permits, and c) changes in a competitve environment, and d) dependence on key specialist medical practitioners. We note that contribution from Dr Lee Keen Whye, Dr Heng Tung Lun and Dr Beh Suan Tion accounts for about 67% of our core obstetrics and gynaecology revenue estimate in 2015.
w w w . u t r a d e . c o m . s g
2
S I N G A P O R E
R e t a i l
M a r k e t
M o n i t o r
Thursday, 16 July 2015
VALUATION Initiate coverage with a BUY and target price of S$0.87 based on the industry’s average PEG ratio of 1.71x. We conservatively adopted the industry’s average despite SOG having the potential to grow quicker than some of its larger comparables such as Talkmed and Raffles Medical.
Possibility for a target PEG premium should any of the following potential growth drivers materialise: a) SOG extending into other areas of women’s healthcare such as in vitro fertilisation, gynaecological cancer specialties, neo-natal and paediatric services, b) upward price adjustment for the group’s service charges, c) engaging in M&A opportunities, and d) overseas expansion into other high growth regions in Asia. FIGURE 1: PEER COMPARISON Share Price (lccy) AMAT SP SGD HMI SP MYR HMED SP SGD IHH SP MYR PACH SP SGD RFMD SP SGD SMG SP SGD TKMED SP SGD ISEC SP SGD
Market PE Cap FY14 FY15F (US$m) (x) (x) Asiamedic Ltd 21.9 44.4 n.a. Health Management Intl Ltd 152.6 36.2 n.a. Healthway Medical Corp Ltd 99.0 13.5 n.a. Ihh Healthcare Bhd 12,429.6 62.5 46.0 Pacific Healthcare Holdings 2.9 n.a. n.a. Raffles Medical Group Ltd 1,965.6 40.9 35.0 Singapore Medical Group Ltd 27.3 337.5 n.a. Talkmed Group Ltd 544.9 19.0 18.2 Isec Healthcare Ltd 100.9 55.6 23.1 Sector Average 76.2 30.6 Sector Average (Excl. AMAT SP, IHH SP, SMG SP, TKMED SP) 36.5 29.0 Singapore O&G Ltd SOG SP SGD 116.0 37.2 31.3 Company
Ticker
P/B ROE Yield PEG FY14 FY15F FY15F FY15F FY15F (x) (x) (%) (%) (X) 2.14 n.a. n.a. n.a. n.a. 5.25 n.a. n.a. n.a. n.a. 0.70 n.a. n.a. n.a. n.a. 2.42 2.33 5.2 0.4 1.14 2.20 n.a. n.a. n.a. n.a. 4.89 4.52 13.5 1.2 1.66 4.90 n.a. n.a. n.a. n.a. 14.91 12.56 75.0 4.1 3.59 3.13 n.a. 12.4 1.0 0.43 4.5 6.5 26.5 1.7 1.71 3.2 4.5 12.9 1.1 1.05 13.6 8.0 25.5 2.7 1.67
Source: Bloomberg, UOB Kay Hian
Potential for valuation expansion. A compelling investment thesis is SOG’s strong cash generating capabilities. Assuming a dividend pay out of 85%, implies decent 2015-17 dividend yields of 3-4%. We think that there is potential for valuation expansion going forward should the group post an earnings surprise on the upside. Compared with its listed peers, we note that SOG offers one of the highest dividend payout ratios due to its strong net cash balances, solid cash generation capabilities and growing profitability. In addition, we are encouraged by the alignment of interests between the group and the specialists as most of them have equity in SOG. FIGURE 2: VALUATION RANGE
10% Discount Industry Mean 10% Premium 15% Premium 20% Premium
Target PEG
2016F Net Profit
2016F EPS
(x)
(S$m)
(S Cents)
Target Price (S$)
1.54 1.71 1.88 1.96 2.05
6.0 6.0 6.0 6.0 6.0
2.75 2.75 2.75 2.75 2.75
0.79 0.87 0.96 1.00 1.05
Source: UOB Kay Hian
w w w . u t r a d e . c o m . s g
3
S I N G A P O R E
R e t a i l
M a r k e t
M o n i t o r
Thursday, 16 July 2015
COMPANY BACKGROUND In 2010, Dr Lee Keen Whye and Dr Heng Tung Lan, together with the group’s CEO, Dr Ng Koon Keng, identified women’s health as a field within the specialist healthcare industry with good potential for growth. The group’s vision was to bring on board like-minded professionals to establish a private healthcare organisation that provides a wide range of premier specialist services catering to the medical needs of women at reasonable prices.
In Jan 11, Singapore Medicine Specialists was incorporated. However, the company was renamed Singapore O&G Pte. Ltd. on 26 Aug 11 to better reflect the nature of the group’s core services. The group first acquired Heng’s Clinic for Women followed by KW Lee Clinic and Surgery for Women from Dr Heng Tung Lan and Dr Lee Keen Whye respectively in 2014.
In 2014, Choo Wan Ling Women’s Clinic and Beh’s Clinic for Women and ST Surgery was acquired. Dr Natalie Chua Weilyn joined the group on 1 Aug 13. Dr Natalie Chua operates out of SOG Clinic for Women in Parkway East Medical Centre and also under the umbrella of Heng Clinic for Women in Cassia Crescent.
In 2014, the group completed a rebranding and restructuring exercise for its specialist clinics. A member clinic of the SOG group can now be recognised by the abbreviation “SOG” at the front of the clinic’s name. In Dec 14, SOG added two new physicians, Dr Cindy Pang and Dr Radhika Lakshmanan.
As at Dec-14, the group has 7 physicians comprising, 6 O&G specialists and 1 breast and general surgeon, and it operates 8 clinics in 5 different locations in Singapore.
FIGURE 3: GROUP STRUCTURE
Singapore O&G
100%
Beh’s Clinic For Women Pte. Ltd.
100%
Choo Wan Ling Women’s Clinic Pte. Ltd.
100%
Heng Clinic For Women Pte. Ltd.
100%
KW Lee Clinic & Surgery for women Pte. Ltd.
100%
SOGRadhika Breast & General Surgicare Pte. Ltd.
100%
SOGCindy Pang Clinic for women Pte. Ltd.
100%
ST Surgery1 Pte. Ltd.
Source: SOG
FIGURE 4: MAJOR SHAREHOLDERS Dr Lee Keen Whye Dr Heng Tung Lan Dr Beh Suan Tiong Dr Choo Wan Ling Total
19.24% 32.19% 10.99% 8.44% 70.86%
Source: SOG 1 As at the date hereof, ST Surgery Pte. Ltd. is undergoing a members voluntary winding-up. ST Surgery Pte. Ltd. is a company incorporated for the administration of hospital receipts for work done by Dr. Beh Suan Tiong at private hospitals only. As such, it is not associated with and did not operate any medical clinics. Since the Group’s acquisition of ST Surgery Pte. Ltd. on 11 February of 2014, it has not been a significant revenue generator or profit contributor. ST Surgery’s Pte. Ltd. business had been amalgated into Beh’s Clinic for Women Pte. Ltd. with effect from June 2014. ST Surgery Pte. Ltd. is expected to be dissolved in May 2015.
w w w . u t r a d e . c o m . s g
4
S I N G A P O R E
R e t a i l
M a r k e t
M o n i t o r
Thursday, 16 July 2015
CLINIC LOCATIONS FIGURE 5: SOG CLINIC FOR WOMEN & SOG-HENG CLINIC FOR WOMEN
FIGURE 6: SOG-HENG CLINIC FOR WOMEN
Source: SOG
Source: SOG
FIGURE 7: SOG-KW LEE CLINIC FOR WOMEN, SOG-CHOO WAN LING CLINIC FOR WOMEN & SOG-RADHIKA BREAST AND GENERAL SURGICARE
FIGURE 8: SOG-BEH CLINIC FOR WOMEN
Source: SOG
Source: SOG
FIGURE 9: SOG CLINIC FOR WOMEN & SOG-HENG CLINIC FOR WOMEN
Source: SOG
w w w . u t r a d e . c o m . s g
5
S I N G A P O R E
R e t a i l
M a r k e t
M o n i t o r
Thursday, 16 July 2015
FIGURE 10: DR NATALIE (L) AND DR HENG (R)
COMPANY OUTLOOK SOG, one of Singapore’s leading groups specialising in women’s healthcare plans to build a medical platform focused on women’s health. The group has three core business segments: a) obstetrics, b) gynaecology & gynaeoncology and c) breast disease & general surgery. Most of the group’s specialist medical practitioners have a track record of more than 10 years while two of the founders, Dr Lee Keen Whye and Dr Heng Tung Lan, have more than 20 years’ experience each. The group currently has 7 physicians, comprising 6 O&G specialists and 1 breast and general surgeon, and it operates 8 clinics in 5 different locations in Singapore, which provides a seamless diagnostic process for women’s healthcare. In Dec 14, the group expanded its services to include surgical solutions to cancers of the breast and female productive system. We expect top-line and bottom line to grow at a 3year CAGR of 17.1% and 18.6 % respectively.
This is where life begins. Obstetrics comes from a Latin word which means “to stand by” and represents a medical specialty that deals with pregnancy, childbirth, and the pre- and post-partum period. The obstetrics segment accounted for about 60% of the group’s 2014 revenue and we expect it to grow at a 3-year CAGR of 15.0%. Despite the fall in Singapore’s total fertility rate (TFR) over the years, the obstetrics segment is expected to remain resilient as the actual numbers of live births and Singapore’s TFR have remained consistent over the past few years. Since 2010, the number of live births has been above 39,000, growing in tandem with the steady increase in Singapore’s total population.
Source: SOG, UOB Kay Hian
FIGURE 11: LIVE BIRTHS TRENDS Surge in 2012 due to the Dragon Year (Chinese Zodiac)
44,000 43,000 42,000 41,000 40,000 39,000 38,000 37,000 36,000 35,000 34,000
2003 2004 2005 2006 2007 2008 2009 2010 2011 2012 2013 2014
Source: SOG, UOB Kay Hian
FIGURE 12: OBSTETRICS SERVICES
Source: SOG, UOB Kay Hian
FIGURE 13: TOTAL POPULATION, TFR, LIVE BIRTHS Total Population (thousand) TFR Live Births
2011 5,183.7 1.20 39,654
2012 5,312.4 1.29 42,663
2013 5,399.2 1.19 39,720
2014 5,469.7 1.25 42,217
Source: Singstat, UOB Kay Hian
w w w . u t r a d e . c o m . s g
6
S I N G A P O R E
R e t a i l
M a r k e t
M o n i t o r
Thursday, 16 July 2015
Growing into a one-stop medical centre for women. In addition to obstetrics services, the group also provides gynaecology & gynaeoncology services which are expected to contribute 35-40% of the group’s total revenue. Among the specialists, Dr Lee Keen Whye, Dr Heng Tung Lan and Dr Beh Suan Tiong take on the most gynaecology cases as these specialists are highly skilled in endoscopic work, especially in hysteroscopy, and laparoscopy. We expect this segment to grow at a 3year CAGR of 18.0%. FIGURE 14: GYNAECOLOGY SERVICES
FIGURE 15: GYNAEONCOLOGY SERVICES
Source: SOG, UOB Kay Hian
Source: SOG, UOB Kay Hian
SOG will benefit from an expected increase in gynaecological problems from an
FIGURE 16: ILLUSTRATION OF AN OVARIAN CYST
ageing population. The three most common gynaecological issues which may require surgery are ovarian cysts, uterine fibroids, and heavy menstrual bleeding.
An ovarian cyst is a fluid-filled tumour that arises from one or both ovaries. The cyst wall or capsule is soft and may appear round, oval or irregular in shape. The cyst content is mostly fluid, filled with water (clear cyst), blood (haemorrhagic or chocolate cyst) or mixed with other human tissues like hair, fat, tooth, cartilage, bone etc (dermoid cyst). (Figure 16.)
A fibroid is caused by a growth or tumour arising from the smooth muscles of the uterus (womb). These non-cancerous growths are commonly found in 10-20% of women in the reproductive age group. Female hormones and drugs or herbs containing traces of oestrogen can stimulate the growth of fibroids. However, the risk of fibroids turning cancerous is less than 0.5%. (Figure 17.)
Source: Biosphere Medical
FIGURE 17: ILLUSTRATION OF A FIBROID
Source: Biosphere Medical
w w w . u t r a d e . c o m . s g
7
S I N G A P O R E
R e t a i l
M a r k e t
M o n i t o r
Thursday, 16 July 2015
Recent expansion likely to further spur growth. In Sep 14, SOG incorporated SOG-Radhika Breast & General Surgicare and engaged Dr Radhika Lakshmanan as a general surgeon with a special interest in breast cancer. With breast cancer as the most diagnosed form of cancer among women in Singapore, we expect this segment to contribute S$1.0m to 2017 revenue. In addition, we think the group will likely expand its service range in the near term and continue adopting a holistic approach to women’s healthcare. These could include in vitro fertilisation, gynaecological cancer specialties, neo-natal and paediatric services, which will further propel growth.
FIGURE 18: 2013 REVENUE BREAKDOWN (%)
40%
Obstetrics
60% Gynaecology & GynaeOncology
Strong network of clinics located in the central and eastern regions of Singapore. Most of SOG’s clinics are located in Gleneagles Medical Centre, Thomson Medical Centre and Parkway East Medical Centre and they are easily accessible to both pregnant mothers and female patients. We think that with 8 clinics in 5 different locations, SOG provides a more flexible point of consultation as compared with some of its competitors that are located only in the city centre. The group plans to extend this reach by opening clinics in the northern and western regions of Singapore. This ensures a significant presence that gives female patients easy access to effective, affordable and friendly healthcare services.
Source: SOG, UOB Kay Hian
FIGURE 19: 2015F REVENUE BREAKDOWN (%)
5%
Debt-free and cash-generative: Well-positioned to support capex needs. The group incurred very minimal debt in its history and has been debt-free since 2013. SOG has always been in a net cash position and operating cash flow has consistently grown, rising from S$2.1m in 2012 to S$4.9m in 2014. As at 2014, the group held S$11.3m in cash. In addition, we expect 2015 and 2016 capex requirements of S$500,000 and S$600,000 respectively. In our view, these requirements could easily be funded with internal cash and SOG will continue to be debt-free in the next couple of years. We expect the group to remain cash flow positive with minimal annual maintenance capex.
As of 2013, the group derived 60% of its revenue from obstetrics and 40% from
38% 57%
Obstetrics
Gynaecology & GynaeOncology Breast & General Surgery
Source: SOG, UOB Kay Hian
gynaecology. We expect the group’s revenue breakdown in 2015 for SOG’s obstetrics, gynaecology & gynaeoncology, and breast disease & general surgery to be 57%, 38% and 5% respectively.
Room for further margin expansion. We remain optimistic that the group will be able to sustain its strong performance for the rest of 2015 and project that there will be further improvements in margins as SOG improves its revenue mix. We think the group is likely to focus on the higher-margin gynaecology and breast disease & general surgery businesses while expanding its team of specialists. We expect higher margins from the gynaecology and breast disease & general surgery segments as the group undertakes more complex procedures, such as myomectomy and hysterectomy. The operating margin for the group’s gynaecology segment is about 70% as compared to that of the obstetrics segment of 50%. FIGURE 20: OBSTETRICS VS GYNAECOLOGY AND GYNAE-ONCOLOGY MARGIN IN 2014 100 90 90 80 80 70 70 60 60 50 50 40 40 30 20 10 0 Gros s Margin Obs tetrics
Operating Margin
Net Margin
Gynaecology & GynaeOncology
Source: SOG, UOB Kay Hian
w w w . u t r a d e . c o m . s g
8
S I N G A P O R E
R e t a i l
M a r k e t
M o n i t o r
Thursday, 16 July 2015
SOG remains differentiated from other medical companies. We note that unlike some of its competitors with higher cost structures, the group has solid control over its operating costs. SOG’s operating expenses to revenue ratio of 63% is lower than its peer average of 75%. This is mainly attributed to the alignment of employee benefits and tighter control over consumable expenses. In addition, we are encouraged by the alignment of interests between the group and the specialists as most of them have equity in SOG. Dr Lee Keen Whye and Dr Heng Tung Lan have a combined stake of more than 50% of the total shareholdings in SOG. FIGURE 21: PEER COMPARISON Peers Asiamedic Ltd
Operating Expenses / Revenue 104%
Health Management Intl Ltd
15%
Healthway Medical Corp Ltd
129%
IHH Healthcare Bhd
86%
Pacific Healthcare Holdings
120%
Raffles Medical Group Ltd
80%
Singapore Medical Group Ltd
36%
Talkmed Group Ltd
27%
Average
75%
Source: Bloomberg, UOB Kay Hian
w w w . u t r a d e . c o m . s g
9
S I N G A P O R E
R e t a i l
M a r k e t
M o n i t o r
Thursday, 16 July 2015
COMPETITION SOG has strong competitors in Singapore. The specialist healthcare industry in Singapore is highly competitive. In general, the group competes with both public and private specialist healthcare institutions.
FIGURE 22: MAIN COMPETITORS Competing Service Offering
Competitors Thomson Women’s Clinics The Obstetricians and Gynaecology Centre The O&G departments of all restructured hospitals in Singapore save the Institute of Mental Health, such as KK Women’s and Children’s Hospital, National University Hospital and Singapore General Hospital Private surgical clinics such as the general surgery department at Raffles Medical Hospital. The breast department of all restructured hospitals in Singapore save the Institute of Mental Health, such as KK Women’s and Children’s Hospital, National University Hospital and the National Cancer Centre
O&G Services
Breast related services Source:SOG Offer Document
FIGURE 23: MAJOR SUPPLIERS Suppliers Apex Pharma Marketing Pte. Ltd. Pharmacon Pte Ltd Pharmed Import & Export Pte Ltd Zuellig Pharma Pte Ltd. Medicell Pharmaceutical Pte Ltd
2012 12.9 5.9 4.1 47.2 -
As % of group's total purchases 2013 12.6 5.4 2.0 54.8 -
2014 12.6 6.6 3.6 35.1 6.8
Source:SOG Offer Document
w w w . u t r a d e . c o m . s g
10
S I N G A P O R E
R e t a i l
M a r k e t
M o n i t o r
Thursday, 16 July 2015
MANAGEMENT FIGURE 24: SELECTED DIRECTORS/PERSONNEL FIGURE 24.1: DR LEE KEEN WHYE
FIGURE 24.2: DR HENG TUNG LAN
FIGURE 24.3: DR BEH SUAN TIONG
Dr Lee Keen Whye is a Consultant Obstetrician and Gynecologist at the Gleneagles Medical Centre. He was the Chairman of the Minimally Invasive Surgery Centre, Gleneagles Hospital between 2001 and 2008. Dr Lee Keen Whye has a special interest and skill set in endoscopic work, especially in hysteroscopy, laparoscopy and vaginal rejuvenation, and has done many international lectures and preceptored many endoscopic workshops in Asia.
Dr Heng Tung Lan is a leading Consultant Obstetrician and Gynecologist practicing in Parkway East Medical Centre. She graduated from the National University of Singapore with a Bachelor’s degree in Medicine and Surgery. Dr Heng Tung Lan then specialised in women’s medical and surgery, was awarded a Masters in Medicine and was admitted to the Academy of Medicine, Singapore.
Dr Beh Suan Tiong is a Consultant Obstetrician and Gynaecologist and operates his own practice at the Thomson Medical Centre. He graduated in 1987 and obtained his specialist medical practitioner membership from The Royal College of Obstetricians and Gynecologists in London, the United Kingdom in 1993. Source: SOG
Source: SOG
Source: SOG
FIGURE 24.4: DR CHOO WAN LING
FIGURE 24.5: DR NATALIE CHUA
FIGURE 24.6: DR RADHIKA LAKSHMANAN
Dr Choo Wan Ling is a Consultant Obstetrician and Gynaecologist who graduated from the National University of Singapore in 1994 with a Bachelor's degree in Medicine and Surgery.
Dr Natalie Chua Weilyn graduated from the National University of Singapore with a Bachelor’s degree in Medicine and Surgery in 2004. She attained and continued with her specialist obstetrics and gynecology traineeship at Kandang Kerbau Hospital and obtained her Membership from the Royal College of Obstetricians and Gynecologists in London, the United Kingdom in 2009.
Dr Radhika Lakshmanan graduated from the National University of Singapore with a Bachelor’s degree in Medicine and Surgery in 1997. She subsequently obtained her fellowship in General Surgery from the Royal College of Surgeons of Edinburgh.
Source: SOG
Source: SOG
Source: SOG
w w w . u t r a d e . c o m . s g
11
S I N G A P O R E
R e t a i l
M a r k e t
M o n i t o r
Thursday, 16 July 2015
FIGURE 24.7: DR CINDY PANG
Dr Cindy Pang Yi Ping graduated from the National University of Singapore with a Bachelor’s degree in Medicine and Surgery in 2002 and subsequently completed 6 years of specialist medical practitioner training in Obstetrics & Gynecology in Singapore. Source: SOG
w w w . u t r a d e . c o m . s g
12
S I N G A P O R E
R e t a i l
M a r k e t
M o n i t o r
Thursday, 16 July 2015
COMPETITIVE STRENGTHS We identify the group’s strengths, among others as follows:
Specialist medical practitioners in women’s healthcare. Most of the group’s clinics and specialist medical practitioners have a track record of more than 10 years each in the O&G field. Two of the group’s founders, Dr Lee Keen Whye and Dr Heng Tung Lan, have more than 20 years experience each.
Dedicated management team with relevant industry experience. The group is led by its Executive Director, Dr Lee Keen Whye and CEO, Dr Ng Koon Keng. Dr Lee Keen Whye has more than 20 years of experience in the O&G industry. Dr Ng Koon Keng has business development, management, marketing and publishing experience.
Disciplined and focused direction. The specialist medical practitioners and CEO are focused on women’s healthcare. By pooling their clinics and expertise, the group is able to deliver a wider range of services catering to patients, and are able to provide a seamless diagnostic process for women including mammograms and pap smears.
Well-located clinics in the central and eastern regions of Singapore. Most of the group’s O&G clinics are located in Gleneagles Medical Centre, Thomson Medical Centre and Parkway East Medical Centre and are easily accessible by public transport. The group also operates an O&G clinic in a residential neighbourhood in Cassia Crescent. The group plans to expand its reach across Singapore by opening more neighbourhood clinics, particularly in the northern and western regions of Singapore.
w w w . u t r a d e . c o m . s g
13
S I N G A P O R E
R e t a i l
M a r k e t
M o n i t o r
FINANCIALS 3-year projected revenue CAGR of 17.1% based on stronger growth from the obstetrics and gynaecology segments. We expect a 3-year CAGR of 18.0% for the gynaecology and gynae-oncology segments to outpace the 15% growth from the group’s obstetrics operations. The stronger growth from the gynaecology segment is a result of higher revenue intensity as the group undertakes more complicated procedures like myomectomy and hysterectomy.
Obstetrics segment expected to remain resilient as number of deliveries will likely increase. We are projecting obstetrics revenue to increase to S$11.6m in 2017 as the number of deliveries grows. The growth in the number of deliveries is underpinned by a growing population and the rising affluence of Singaporeans who choose private doctors over public doctors. As at 2013, the majority (60.2%) of pregnant mothers delivered their babies through private sector hospitals. Dr Lee Keen Whye, Dr Heng Tung Lan and Dr Beh Suan Tiong are expected to account for about 70% of the group’s total deliveries for 2015.
Looking to the gynaecology and breast surgery segments to further boost growth. 2017 gynaecology revenue is expected to grow at a 3-year CAGR of 18.0% to S$9.1m. In addition, we are projecting revenue from the breast disease & general surgery segment to grow at from S$774,000 in 2015 to S$1.0m in 2017. We think the group will continue to look out for opportunities to improve on its holistic approach towards women’s healthcare services and not rule out an expansion into in vitro fertilisation, gynaecological cancer specialties, and neo-natal and paediatric services, which will further propel growth.
Newly-joined specialists likely to further contribute to 2015 revenue uplift. In Dec 14, Dr Cindy Pang and Dr Radhika Lakshmanan joined SOG as the group’s women cancer specialists. Dr Radhika Lakshmanan is a breast specialist trained in reconstructive breast surgery. Both specialists are expected to fully contribute to 2015’s top-line. Dr Cindy Pang is expected to operate mainly (70%) in the gynaecology and gynae-oncology segment. Both Dr Cindy Pang and Dr Radhika Lakshmanan are expected to contribute to about 8.2% of the group’s 2015 revenue.
Room for margin expansion. We remain optimistic that there will be further improvements in margins as SOG improves its revenue mix. The group is likely to focus on the higher-margin gynaecology and breast disease & general surgery businesses while expanding its team of specialists. As a result of SOG undertaking higher-intensity cases such as myomectomy and hysterectomy, while ramping up the group’s gynaecology and breast disease segmental operations, we expect operating margin in 2017 to expand to 38.7% and net margin to improve by 1.2ppt from 31.4% in 2014 to 32.5% in 2017.
Projected net profit CAGR of 18.6% in 2014-17. We expect stronger profit growth on the back of expanding margins and patient volumes. Revenue growth will likely outpace operating expenses, given SOG’s solid cost control and its ability to expand per patient revenue intensity on the back of a more complex profile for its gynaecology consultations. We expect contributions from Dr Cindy Pang and Dr Radhika Lakshmanan to be more significant from 2015 as they ramp up their services. There could be room for further upside if patient volumes increase faster than expected or the consultation profiles gets unexpectedly more complex.
Thursday, 16 July 2015
FIGURE 25: TOTAL REVENUE TRAJECTORY (S$M) 25.0
21.8 18.5
20.0 15.8 13.5
15.0 10.0
8.1
8.6
FY12
FY13
5.0 0.0 FY14
FY15F
FY16F
FY17F
Source: SOG, UOB Kay Hian
FIGURE 26: OBSTETRICS REVENUE TRAJECTORY (S$M) 14.0 11.6
12.0
10.3 9.0
10.0 7.7
8.0 6.0
4.9
5.2
FY12
FY13
4.0 2.0 0.0 FY14
FY15F
FY16F
FY17F
Source: SOG, UOB Kay Hian
FIGURE 27: GYNAECOLOGY & GYNAE-ONCOLOGY REVENUE TRAJECTORY (S$M) 10.0 9.0 8.0 7.0 6.0 5.0 4.0 3.0 2.0 1.0 0.0
9.1 7.3 5.6 3.2
3.5
FY12
FY13
FY14
6.0
FY15F
FY16F
FY17F
Source: SOG, UOB Kay Hian
FIGURE 28: EBIT MARGIN (%) 39.0
38.7 38.5
38.5 38.0 38.0 37.5
37.2
37.0 36.5 36.0 FY14
FY15F
FY16F
FY17F
Source: SOG, UOB Kay Hian
w w w . u t r a d e . c o m . s g
14
S I N G A P O R E
R e t a i l
M a r k e t
M o n i t o r
Thursday, 16 July 2015
FIGURE 32: PROFIT AND LOSS Year to 31 Dec (S$m) Net Turnover EBITDA Deprec. & amort. EBIT Total other non-operating income Associate and JV contributions Net interest income/(expense) Pre-tax profit Tax Net profit Net profit (adj.)
FIGURE 29: NET MARGIN (%) 2013 8.6 3.8 (0.1) 3.7 0.0 0.0 0.0 3.7 (0.6) 3.1 3.1
2014 13.5 5.2 (0.2) 5.0 0.0 0.0 (0.0) 5.0 (0.8) 4.2 4.2
2015F 15.8 6.2 (0.2) 6.0 0.0 0.0 0.0 6.0 (1.0) 5.1 5.1
2016F 18.5 7.2 (0.1) 7.1 0.0 0.0 0.0 7.1 (1.1) 6.0 6.0
2017F 21.8 8.5 (0.1) 8.4 0.0 0.0 0.0 8.4 (1.3) 7.1 7.1
32.8 32.6 32.4 32.2 32.0 31.8 31.6 31.4 31.2 31.0 30.8 30.6
32.5 32.4 32.0
31.4
FY14
Source: SOG, UOB Kay Hian
FIGURE 33: BALANCE SHEET Year to 31 Dec (S$m) Fixed assets Other LT assets Cash/ST investment Other current assets Total assets ST debt Other current liabilities LT debt Other LT liabilities Shareholders' equity Total liabilities & equity
FY15F
FY16F
FY17F
Source: SOG, UOB Kay Hian
2013 0.4 0.0 6.4 1.6 8.4 0.0 1.7 0.0 0.0 6.8 8.4
2014 0.6 0.8 11.3 2.1 14.9 0.0 3.0 0.0 0.0 11.9 14.9
2015F 0.8 4.6 24.3 2.0 31.7 0.0 3.9 0.0 0.0 27.8 31.7
2016F 1.2 9.0 25.6 2.3 38.2 0.0 4.3 0.0 0.0 33.8 38.2
2017F 1.8 14.2 27.1 2.7 45.8 0.0 4.9 0.0 0.0 40.9 45.8
FIGURE 30: CASH BALANCES (S$M) 30.0 24.3
25.0
25.6
27.1
20.0 15.0
11.3
10.0
6.4
4.6 5.0
Source: SOG, UOB Kay Hian
0.0 FY12
FY13
FY14
FY15F
FY16F
FY17F
FIGURE 34: CASH FLOW Year to 31 Dec (S$m)) Operating Pre-tax profit Tax Deprec. & amort. Associates Working capital changes Non-cash items Other operating cashflows Investing Capex (growth) Investments Proceeds from sale of assets Others Financing Issue of shares Proceeds from borrowings Loan repayment Others/dividends/interest paid Net cash inflow (outflow) Beginning cash & cash equivalent Forex Ending cash & cash equivalent
2013 3.4 3.7 (0.5) 0.1 0.0 (0.0) (0.0) 0.0 (0.2) (0.3) 0.0 0.1 0.0 (1.3) 0.0 0.0 (0.1) (1.2) 1.8 4.6 0.0 6.4
2014 4.9 5.0 (0.5) 0.2 0.0 0.1 0.0 0.1 2.1 (0.4) 2.5 0.0 0.0 (2.2) 0.0 0.0 (0.0) (2.2) 4.9 6.4 0.0 11.3
2015F 6.2 6.0 (1.0) 0.2 0.0 1.0 (0.0) 0.0 (0.5) (0.5) 0.0 0.0 0.0 7.3 10.9 0.0 0.0 (3.6) 13.0 11.3 0.0 24.3
2016F 6.2 7.1 (1.1) 0.1 0.0 0.1 (0.0) 0.0 (0.6) (0.6) 0.0 0.0 0.0 (4.3) 0.0 0.0 0.0 (4.3) 1.3 24.3 0.0 25.6
2017F 7.3 8.4 (1.3) 0.1 0.0 0.1 (0.0) 0.0 (0.7) (0.8) 0.0 0.0 0.0 (5.1) 0.0 0.0 0.0 (5.1) 1.5 25.6 0.0 27.1
Source: SOG, UOB Kay Hian
FIGURE 31: OPERATING CASH FLOW, NET PROFIT (S$M) 8
7.3
7
6.2
6.2
6 4.9
5 4 3
3.4 7.1
2.1
6.0 5.1 4.2
2 3.0
3.1
1 0 FY12
FY13
Net Profit
FY14
FY15F
FY16F
FY17F
Net Cash Generated From Operating Activities
Source: SOG, UOB Kay Hian
Source: SOG, UOB Kay Hian
w w w . u t r a d e . c o m . s g
15
S I N G A P O R E
R e t a i l
M a r k e t
M o n i t o r
Thursday, 16 July 2015
FIGURE 35: RATIOS Year to 31 Dec (%) Growth Turnover EBITDA Pre-tax profit Net profit Net profit (adj.) EPS Profitability EBITDA margin EBIT margin Pre-tax margin Net margin ROE ROA Leverage Debt to total capital Debt to equity Net debt/ (cash) to equity Interest cover (x)
2013
2014
2015F
2016F
2017F
6.5 9.7 8.6 4.0 4.0 4.0
56.8 35.9 35.5 36.1 36.1 36.1
16.7 17.9 19.4 19.0 19.0 19.0
17.3 17.6 18.7 18.7 18.7 18.7
17.4 17.1 18.1 18.1 18.1 18.1
44.5 43.0 43.1 36.1 53.7 43.7
38.6 37.2 37.2 31.4 45.6 36.5
39.0 38.0 38.1 32.0 25.5 21.7
39.1 38.5 38.5 32.4 19.5 17.2
39.0 38.7 38.7 32.5 19.0 16.9
(0.9) 2,460.0
(1.0) 5,045.3
(0.9) n.m
(0.8) n.m
(0.7) n.m
Source: SOG, UOB Kay Hian
Attractive dividend payout of up to 90%. Although there is an intention to distribute up to 90% in dividend payouts, we have conservatively assumed 85% in 2015. Given that SOG is debt-free, highly cash generative and is growing in profitability, we think there is minimal downside risk to the payout commitments.
SOG is in a net cash position and unlikely to take on debt in the near term. Since 2013, the group has been debt-free and has always been in a net cash position. Operating cash flow has likewise been consistently positive and grew from S$2.1m in 2012 to S$4.9m in 2014. We expect operating cash flow to be S$7.2m by 2017. As of end-14, the group held S$11.3m in cash. SOG is expected to require S$0.5m-0.6m annually for capex requirements in 2015-16. The main bulk of these expenses involve investment in medical equipment such as ultrasound machines and laparoscopic machines. We think the group is not expected to undertake any debt in the next 2 years and will internally fund these requirements.
w w w . u t r a d e . c o m . s g
16
S I N G A P O R E
R e t a i l
M a r k e t
M o n i t o r
Thursday, 16 July 2015
INDUSTRY OUTLOOK The industry is a beneficiary of rising affluence and higher educational levels. Gross national income per capita (at current market prices) increased from about S$40,767 in 2000 to S$67,385 in 2013, while the average monthly resident household income increased at a 10-year CAGR of 5.8% from S$5,666 in 2004 to S$9,982 in 2014. The economic progress in Singapore has resulted in greater affluence and has likely led to an increase in demand for SOG’s services as the group provides quality specialist services with its comprehensive focus on women’s healthcare.
Growing number of cancer notifications drives demand for solid healthcare providers. We note that the number of cancer diagnosis cases has been on the uptrend and the market outlook for cancer services is positive. The number of cancer notifications increased from 11,680 in 2011 to 13,416 in 2014. In addition, from 1975 to 2014, the age-standardised incidence rate of newly-diagnosed ovarian cancer in females had increased and almost doubled from 7.3 per 100,000 persons after the years 1975 to 1979, to 12.7 per 100,000 persons after the years 2010 to 2014. A total of 1,719 new cases of ovarian cancer were diagnosed from 2010 to 2014. We expect demand for SOG’s gynaecology & gynaeoncology services to remain strong as the number of female cancer cases increases.
FIGURE 36: AVERAGE MONTHLY HOUSEHOLD INCOME (S$) 12,000
10,000
8,000
6,000
4,000
2,000
0 2004
2005
2006
2007
2008
2009
2010
2011
2012
2013
2014
Source: Singstat
FIGURE 37: AGE-STANDARDISED INCIDENCE RATE FOR OVARIAN CANCER, 1974 - 2014
FIGURE 31: NUMBER OF CANCER NOTIFICATIONS Year of Diagnosis Number of Cancer Notifications
2011 11,726
2012 12,295
2013 12,651
2014 13,416
Source: Health Promotion Board
O&G services likely to be bolstered by pro-TFR government initiatives. Since 2001, the Singapore government has introduced a slew of policies in an attempt to increase national birth rates, and these include an enhanced marriage & parenthood package budgeted at S$2b in 2013 in support of a pro-family environment. Among the stated, the government plans to co-fund Assisted Conception Procedures (ACP) such as Assisted Reproduction Technology (ART) treatments, to cover up to 75% of treatment costs, capped at S$6,300 per cycle and S$1,200 per cycle for three fresh and three frozen treatment cycles. In addition, there is an enhanced baby bonus cash gift of S$6,000 per child for the first two births and S$8,000 per child for the third/fourth births. These financial incentives and support provided will encourage married couples to have more children and hence will likely improve the demand for SOG’s obstetrics services.
Source: Singstat
FIGURE 38: POPULATION GROWTH (M)
Market dynamics for private O&G clinics remain lucrative...Compared with the public sector, private O&G clinics offer a wider range of services, greater flexibility and could potentially house more experienced specialist medical practitioners. Hence, demand for private healthcare remains strong. In addition, the barriers of entry to the private O&G sector remain high as it takes about 6 years to become a fully-registered doctor and another 6 years to be trained and accredited as an O&G specialist. As a result of both stronger demand and steeper supply, private practitioners are able to command a premium over their public sector counterparts. As of 2013, the majority (60.2%) of pregnant mothers delivered their babies through private sector hospitals.
Source: Singstat
…as increase in total and ageing population is likely to sustain growth. Singapore’s total population (residents and non-residents) increased at a 5-year CAGR of 1.9% from 4.98m in 2009 to 5.47m as of Jun 14 and is likely to grow to 6.5m-6.9m in 2030. In addition, at current birth rates and without immigration, the median age of Singapore’s population will be around 47 years old by 2030. As the population of Singapore ages, it is likely that incidences of females suffering from certain diseases such as breast cancer will increase. The change in Singapore’s demographics bodes well for medical services demand.
Medical tourism remains a bright spot. Singapore is a recognised medical hub which attracts many overseas patients annually for excellent, accessible and a wide w w w . u t r a d e . c o m . s g
17
S I N G A P O R E
R e t a i l
M a r k e t
M o n i t o r
Thursday, 16 July 2015
range of medical services. Singapore Medicine, a multi-agency government initiative, was launched in 2003 to promote and establish Singapore as one of Asia’s leading medical hubs. Annually, about 400,000 foreigners travel to Singapore to seek medical treatment. We think Singapore’s strong reputation for its medical advancement and quality service will continue to attract foreigners seeking treatments and consultations, which will boost demand for SOG’s services.
w w w . u t r a d e . c o m . s g
18
S I N G A P O R E
R e t a i l
M a r k e t
M o n i t o r
Thursday, 16 July 2015
RISK FACTORS We highlight the following as key risks, among others.
Changes in regulations and licensing requirements. The healthcare industry is highly-regulated and healthcare professionals are subject to various laws and regulations. Any adverse changes in such laws and regulations or the introduction of new applicable laws and regulations could result in, among others, more stringent requirements and an increase in compliance costs. This could materially and adversely affect the group’s business, financial condition and the results of its operations.
May not be able to obtain the requisite approvals, licenses and/or permits or renew current approvals, licenses and/or permits upon their expiration. The group and its healthcare professionals require various approvals, licenses and/or permits to operate, and the obtaining of these requisite approvals, licenses and/or permits and the renewal of the same are subject to compliance with the relevant laws and regulations. In the event that the group is unable to obtain or renew the requisite approvals, licenses and/or permits, or such approvals, licenses and/or permits are withdrawn from the group, the group may be required to cease development or operations and the group’s business, financial condition and results of operations may be adversely affected.
Dependence on key specialist medical practitioners. The continued success of the group is dependent on certain members of its management team, including some who have been with the group since its inception, to manage its current operations and meet future business challenges. The group’s executive directors and executive officers are responsible for formulating and implementing its growth, corporate development and overall business strategies. Any loss of the services of any key management personnel of the group without a suitable and timely replacement could materially and adversely affect SOG’s business, financial condition and the results of its operations. We note that Dr.Lee Keen Whye, Dr. Heng Tung Lun and Dr. Beh Suan Tion accounts for about 67% of our estimated core obstetrics and gynaecology revenue in 2015.
Competition. The healthcare industry is highly competitive and the group faces competition from other healthcare service providers in Singapore and overseas from both the public and private sectors. Such competitors may be in a better position to expand their market share and the increased competition may result in lower profit margins and a loss of market share for the group.
Political, economic and social developments in Singapore. The group’s business, prospects, financial position and the results of its operations may be adversely affected by political, economic, social and legal developments beyond its control. Such political and economic uncertainties include, but are not limited to, the risks of war, terrorism, changes in interest rates, rates of economic growth, fiscal and monetary policies of the government and other matters that influence consumer confidence, spending and tourism. Increasing volatility in financial markets may cause these factors to change with a greater degree of frequency and magnitude.
w w w . u t r a d e . c o m . s g
19
S I N G A P O R E
R e t a i l
M a r k e t
M o n i t o r
Thursday, 16 July 2015
Disclosures/Disclaimers This report is prepared by UOB Kay Hian Private Limited (“UOBKH”), which is a holder of a capital markets services licence and an exempt financial adviser in Singapore. This report is provided for information only and is not an offer or a solicitation to deal in securities or to enter into any legal relations, nor an advice or a recommendation with respect to such securities. This report is prepared for general circulation. It does not have regard to the specific investment objectives, financial situation and the particular needs of any recipient hereof. Advice should be sought from a financial adviser regarding the suitability of the investment product, taking into account the specific investment objectives, financial situation or particular needs of any person in receipt of the recommendation, before the person makes a commitment to purchase the investment product. This report is confidential. This report may not be published, circulated, reproduced or distributed in whole or in part by any recipient of this report to any other person without the prior written consent of UOBKH. This report is not directed to or intended for distribution to or use by any person or any entity who is a citizen or resident of or located in any locality, state, country or any other jurisdiction as UOBKH may determine in its absolute discretion, where the distribution, publication, availability or use of this report would be contrary to applicable law or would subject UOBKH and its connected persons (as defined in the Financial Advisers Act, Chapter 110 of Singapore) to any registration, licensing or other requirements within such jurisdiction. The information or views in the report (“Information”) has been obtained or derived from sources believed by UOBKH to be reliable. However, UOBKH makes no representation as to the accuracy or completeness of such sources or the Information and UOBKH accepts no liability whatsoever for any loss or damage arising from the use of or reliance on the Information. UOBKH and its connected persons may have issued other reports expressing views different from the Information and all views expressed in all reports of UOBKH and its connected persons are subject to change without notice. UOBKH reserves the right to act upon or use the Information at any time, including before its publication herein. Except as otherwise indicated below, (1) UOBKH, its connected persons and its officers, employees and representatives may, to the extent permitted by law, transact with, perform or provide broking, underwriting, corporate finance-related or other services for or solicit business from, the subject corporation(s) referred to in this report; (2) UOBKH, its connected persons and its officers, employees and representatives may also, to the extent permitted by law, transact with, perform or provide broking or other services for or solicit business from, other persons in respect of dealings in the securities referred to in this report or other investments related thereto; (3) the officers, employees and representatives of UOBKH may also serve on the board of directors or in trustee positions with the subject corporation(s) referred to in this report. (All of the foregoing is hereafter referred to as the “Subject Business”); and (4) UOBKH may otherwise have an interest (including a proprietary interest) in the subject corporation(s) referred to in this report. As of the date of this report, no analyst responsible for any of the content in this report has any proprietary position or material interest in the securities of the corporation(s) which are referred to in the content they respectively author or are otherwise responsible for. IMPORTANT DISCLOSURES FOR U.S. PERSONS This research report was prepared by UOBKH, a company authorized, as noted above, to engage in securities activities in Singapore. UOBKH is not a registered broker-dealer in the United States and, therefore, is not subject to U.S. rules regarding the preparation of research reports and the independence of research analysts. This research report is provided for distribution by UOBKH (whether directly or through its US registered broker dealer affiliate named below) to “major U.S. institutional investors” in reliance on the exemption from registration provided by Rule 15a-6 of the U.S. Securities Exchange Act of 1934, as amended (the “Exchange Act”). All US persons that receive this document by way of distribution from or which they regard as being from UOBKH by their acceptance thereof represent and agree that they are a major institutional investor and understand the risks involved in executing transactions in securities. Any U.S. recipient of this research report wishing to effect any transaction to buy or sell securities or related financial instruments based on the information provided in this research report should do so only through UOB Kay Hian (U.S.) Inc (“UOBKHUS”), a registered brokerdealer in the United States. Under no circumstances should any recipient of this research report effect any transaction to buy or sell securities or related financial instruments through UOBKH. UOBKHUS accepts responsibility for the contents of this research report, subject to the terms set out below, to the extent that it is delivered to and intended to be received by a U.S. person other than a major U.S. institutional investor. The analyst whose name appears in this research report is not registered or qualified as a research analyst with the Financial Industry Regulatory Authority (“FINRA”) and may not be an associated person of UOBKHUS and, therefore, may not be subject to applicable restrictions under FINRA Rules on communications with a subject company, public appearances and trading securities held by a research analyst account.
w w w . u t r a d e . c o m . s g
20
S I N G A P O R E
R e t a i l
M a r k e t
M o n i t o r
Thursday, 16 July 2015
Analyst Certification/Regulation AC Each research analyst of UOBKH who produced this report hereby certifies that (1) the views expressed in this report accurately reflect his/her personal views about all of the subject corporation(s) and securities in this report; (2) the report was produced independently by him/her; (3) he/she does not carry out, whether for himself/herself or on behalf of UOBKH or any other person, any of the Subject Business involving any of the subject corporation(s) or securities referred to in this report; and (4) he/she has not received and will not receive any compensation that is directly or indirectly related or linked to the recommendations or views expressed in this report or to any sales, trading, dealing or corporate finance advisory services or transaction in respect of the securities in this report. However, the compensation received by each such research analyst is based upon various factors, including UOBKH’s total revenues, a portion of which are generated from UOBKH’s business of dealing in securities. Reports are distributed in the respective countries by the respective entities and are subject to the additional restrictions listed in the following table. General This report is not intended for distribution, publication to or use by any person or entity who is a citizen or resident of or located in any country or jurisdiction where the distribution, publication or use of this report would be contrary to applicable law or regulation. Hong Kong This report is distributed in Hong Kong by UOB Kay Hian (Hong Kong) Limited ("UOBKHHK"), which is regulated by the Securities and Futures Commission of Hong Kong. Neither the analyst(s) preparing this report nor his associate, has trading and financial interest and relevant relationship specified under Para. 16.4 of Code of Conduct in the listed corporation covered in this report. UOBKHHK does not have financial interests and business relationship specified under Para. 16.5 of Code of Conduct with the listed corporation covered in this report. Where the report is distributed in Hong Kong and contains research analyses or reports from a foreign research house, please note: (i) recipients of the analyses or reports are to contact UOBKHHK (and not the relevant foreign research house) in Hong Kong in respect of any matters arising from, or in connection with, the analysis or report; and (ii) to the extent that the analyses or reports are delivered to and intended to be received by any person in Hong Kong who is not a professional investor, or institutional investor, UOBKHHK accepts legal responsibility for the contents of the analyses or reports only to the extent required by law. Indonesia This report is distributed in Indonesia by PT UOB Kay Hian Securities, which is regulated by Financial Services Authority of Indonesia (OJK). Where the report is distributed in Indonesia and contains research analyses or reports from a foreign research house, please note recipients of the analyses or reports are to contact PT UOBKH (and not the relevant foreign research house) in Indonesia in respect of any matters arising from, or in connection with, the analysis or report. Malaysia Where the report is distributed in Malaysia and contains research analyses or reports from a foreign research house, the recipients of the analyses or reports are to contact UOBKHM (and not the relevant foreign research house) in Malaysia, at +603-21471988, in respect of any matters arising from, or in connection with, the analysis or report as UOBKHM is the registered person under CMSA to distribute any research analyses in Malaysia. Singapore This report is distributed in Singapore by UOB Kay Hian Private Limited ("UOBKH"), which is a holder of a capital markets services licence and an exempt financial adviser regulated by the Monetary Authority of Singapore.Where the report is distributed in Singapore and contains research analyses or reports from a foreign research house, please note: (i) recipients of the analyses or reports are to contact UOBKH (and not the relevant foreign research house) in Singapore in respect of any matters arising from, or in connection with, the analysis or report; and (ii) to the extent that the analyses or reports are delivered to and intended to be received by any person in Singapore who is not an accredited investor, expert investor or institutional investor, UOBKH accepts legal responsibility for the contents of the analyses or reports only to the extent required by law. Thailand This report is distributed in Thailand by UOB Kay Hian Securities (Thailand) Public Company Limited, which is regulated by the Securities and Exchange Commission of Thailand. United This report is being distributed in the UK by UOB Kay Hian (U.K.) Limited, which is an authorised person in the meaning Kingdom of the Financial Services and Markets Act and is regulated by The Financial Conduct Authority. Research distributed in the UK is intended only for institutional clients. United This report cannot be distributed into the U.S. or to any U.S. person or entity except in compliance with applicable U.S. States of laws and regulations. It is being distributed in the U.S. by UOB Kay Hian (US) Inc, which accepts responsibility for its America contents. Any U.S. person or entity receiving this report and wishing to effect transactions in any securities referred to in (‘U.S.’) the report should contact UOB Kay Hian (US) Inc. directly.
Copyright 2015, UOB Kay Hian Pte Ltd. All rights reserved. http://research.uobkayhian.com RCB Regn. No. 197000447W
w w w . u t r a d e . c o m . s g
21