R e g i o n a l
M o r n i n g
N o t e s
Wednesday, 13 May 2015
COMPANY RESULTS
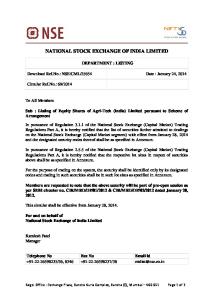
BUY (Maintained)
Bumitama Agri Ltd (BAL SP) 1Q15: No Surprises BAL’s operational core net profit fell 22.7% yoy (-29.7% qoq). This was within our expectation as 1Q is seasonally weaker for plantation companies. We expect production to continue picking up going into 2H15 and the increase in production cost to normalise in the coming quarters. Maintain BUY with a lower target price of S$1.35 as we lower our earnings on the back of lowered CPO price assumptions. 1Q15 RESULTS
Year to 31 Dec (Rpb) Revenue - CPO - PK EBIT PBT Net Profit Operational Core Net Profit Sales Volume ('000 tonnes) - CPO - PK ASP (Rp/kg) CPO PK
Share Price Target Price Upside (Previous TP
S$0.98 S$1.35 +37.8% S$1.45)
COMPANY DESCRIPTION The youngest pure upstream palm oil player
1Q14
4Q14
1Q15 1,334 1,189 145 357 274 182 213
qoq % chg (15.0) (17.1) 7.4 (22.4) (39.7) (31.8) (29.7)
yoy % chg (1.7) (2.0) 0.4 (17.1) (39.4) (41.0) (22.7)
1,357 1,213 145 430 452 308 276
1,570 1,435 135 460 454 266 303
138.0 25.8
183.2 34.0
152.9 29.7
(16.5) (12.6)
10.8 14.8
8,786 5,591
7,832 8,104
7,773 4,891
(0.8) (39.6)
(11.5) (12.5)
STOCK DATA GICS sector Consumer Staples Bloomberg ticker: BAL SP 1,757.5 Shares issued (m): Market cap (S$m): 1,722.4 1,290.5 Market cap (US$m): 3-mth avg daily t'over (US$m): 0.2 Price Performance (%) 52-week high/low
1mth
S$1.27/S$0.950
3mth
6mth
1yr
YTD
(6.7)
(9.3)
(16.9)
(6.2)
(3.0)
Major Shareholders
Source: Bumitama Agri Ltd, UOB Kay Hian
RESULTS Results within expectation. Bumitama Agri (BAL) reported operational core net profit of Rp213b (-29.7% qoq, -22.7% yoy). Results were within our expectation. 1Q is seasonally the weakest quarter for plantation companies. In 1Q15, EBIT fell 17.1% yoy mainly due to lower CPO ASP and higher cost despite better sales volume growth of 10.8% yoy (-16.5% qoq). CPO ASP was down 11.5% yoy (0.8% qoq) in 1Q15, offsetting the rise in sales volume. Also, higher cost of sales was recorded this quarter due to increased application of fertiliser and higher third-party purchases. The qoq decline in EBIT was mainly due to lower FFB production on seasonality.
%
Fortune Holdings Ltd
50.9
IOI Corporation
30.4
FY15 NAV/Share (Rp)
4,155
FY15 Net Debt/Share (Rp)
2,736
PRICE CHART (lcy)
BUMITAMA AGRI LTD
BUMITAMA AGRI LTD/FSSTI INDEX
(%)
120
1.40 1.30
110
1.20 100 1.10 90 1.00
KEY FINANCIALS Year to 31 Dec (Rpb) Net turnover EBITDA Operating profit Net profit (rep./act.) Net profit (adj.) EPS (Rp) PE (x) P/B (x) EV/EBITDA (x) Dividend yield (%) Net margin (%) Net debt/(cash) to equity (%) Interest cover (x) ROE (%) Consensus net profit UOBKH/Consensus (x)
80
0.90
2013 4,063 1,468 1,335 855 879 500.1 19.4 3.0 15.4 1.5 21.1 65.0 42.6 16.3 -
2014 5,757 2,119 1,935 1,153 1,257 715.4 13.5 2.6 10.7 1.4 20.0 61.2 n.a. 19.0 -
2015F 5,800 2,007 1,764 1,057 1,057 601.2 16.1 2.3 11.3 1.4 18.2 65.8 27.3 15.3 1,370 0.77
2016F 7,026 2,660 2,358 1,469 1,469 835.7 11.6 2.1 8.5 3.0 20.9 64.7 40.5 18.9 1,655 0.89
2017F 7,716 2,995 2,638 1,631 1,631 926.9 10.4 1.8 7.6 3.4 21.1 61.5 31.6 18.6 1,902 0.86
70
0.80 4 3
Volume (m)
2 1 0
May 14
Jul 14
Sep 14
Nov 14
Jan 15
Mar 15
May 15
Source: Bloomberg
ANALYSTS Singapore Research Team +65 6535 6868
[email protected] Chan Yuan She +603 2147 1995
[email protected]
Source: Bumitama Agri Ltd, Bloomberg, UOB Kay Hian n.m. : not meaningful; negative P/E, EV/EBITDA reflected as "n.m."
Refer to last page for important disclosures.
131
R e g i o n a l
M o r n i n g
N o t e s
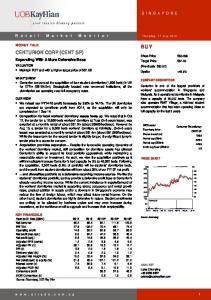
BAL reported nucleus FFB production growth of 10.7% yoy (-12.1% qoq) for the quarter, supported by its young age profile and increase in new mature area. Besides that, it has increased its external crop intakes by 52% yoy (+0.2% qoq) in 1Q15 to maximise the utilisation rate of its new mills and boosted up the CPO production growth to 16.0% yoy (8.0% qoq). Its finance cost jumped by 173.8% yoy (+87.9% qoq) due to higher borrowing from MTN and new revolving credit facility as well as lower capitalised finance cost as a result of a higher portion of mature plantation to total planted area. At the same time, interest income has increased by more than 4x yoy (-49.9% qoq) due to higher average cash and short-tem deposit balance and interest income earned from advances given to plasma farmers. Share of loss from associate companies has increased substantially to Rp43b (1Q14: Rp1b; 4Q14: 2b) due to share of losses from associate companies being affected by the low yield of their newly mature plantation and unrealised forex loss on their US dollardenominated borrowings.
Wednesday, 13 May 2015
STRONG YOY GROWTH IN FFB PRODUCTION ('000 tonne) 450
(%) 60.0
FFB Production FFB (LHS) yoy % chg (RHS)
400
50.0
350
40.0
300
30.0
250
20.0
200
10.0
150
0.0 1Q12
3Q12
1Q13
3Q13
1Q14
3Q14
1Q15
Source: BAL
KEY STATISTICS SUMMARY ('000 tonnes)
1Q15
qoq% chg
yoy % chg
Production
STOCK IMPACT
FFB
487.8
(11.1)
6.8
FFB production growth on track to meet expectation. We are expecting strong FFB production of 20-22% for 2015, in line with management’s guidance of 20% yoy. The growth would be supported by newly mature areas of 10,000ha (14% of total mature areas) as well as its young age oil palm trees approaching their prime age. Production is expected to pick up in the coming quarters as we are entering into high production season.
- nucleus
340.8
(12.1)
10.7
- plasma
147.0
(8.6)
(1.3)
FFB external
205.7
0.2
52.0
CPO
160.4
(8.0)
16.0
PK
30.6
(8.4)
18.8
Cost of production to normalise in coming quarters. BAL reported higher cash cost of production of Rp3,896/kg (+8.0% yoy) in 1Q15 due to increased fertiliser application as compared with last year as well as an increase in dosage for mature area. There was a deferment of fertiliser application in 1Q14 due to the delay in arrival of fertilizer to the estates. However, we believe the high cost would be normalised in the coming quarters. For full-year 2015, we are still expecting its production cost per tonne to stay flat at a similar level as 2014’s Rp3,704/kg on the back of higher production.
4.1
(18.0)
(2.4)
OER (%) Source: BAL
23.3
0.9
(0.4)
Productivity FFB Yield (tonne/ha)
New planting on track to meet target. BAL has planted about 736ha in 1Q15, of which about 472ha is nucleus area. It is on track to meet its target of 4,000ha in 2015. BAL has deliberately slowed down its new planting progress since 2014 due to the new planting procedure implementation. EARNINGS REVISION/RISK We have revised our earnings downward by 7-17% for 2015-17 to factor in the lower CPO price assumption of RM2,200/tonne for 2015 and RM2,300/tonne for both 2016 and 2017. The lower adjustment in earnings was because the weakening in the rupiah cushioned the decline of CPO price in US dollars. We are expecting BAL to deliver a net profit of Rp1,057b, Rp1,469b and Rp1,631b for 2015, 2016 and 2017 respectively. VALUATION/RECOMMENDATION Maintain BUY with a lower target price of S$1.35 (previously S$1.45), based on 15x 2016F PE. We like BAL for its young age profile that can deliver strong production as well as hands-on estate management which consistently delivers high OER. SHARE PRICE CATALYST Surge in CPO prices. BAL is highly leveraged to CPO prices. A surge in CPO prices will boost its earnings.
Refer to last page for important disclosures.
142
R e g i o n a l
M o r n i n g
N o t e s
PROFIT & LOSS Year to 31 Dec (Rpb)
BALANCE SHEET 2014
2015F
2016F
2017F
Year to 31 Dec (Rpb)
Net turnover
5,757
5,800
7,026
7,716
Fixed assets
EBITDA
2,119
2,007
2,660
2,995
Other LT assets
Deprec. & amort. EBIT Total other non-operating income Associate contributions Net interest income/(expense)
Wednesday, 13 May 2015
2014
2015F
2016F
2017F
11,655
13,596
15,508
17,374
805
805
805
805
184
243
302
357
Cash/ST investment
311
1,172
834
652
1,935
1,764
2,358
2,638
Other current assets
1,033
1,053
1,206
1,290
13,803
16,625
18,352
20,120
589
589
589
589
Total assets
0
0
0
0
(17)
(55)
(19)
(19)
ST debt
1
(74)
(66)
(95)
Other current liabilities
1,334
1,340
1,504
1,597
Pre-tax profit
1,805
1,636
2,274
2,525
LT debt
3,691
5,391
5,591
5,791
Tax
(433)
(392)
(546)
(606)
Other LT liabilities
1,081
1,192
1,340
1,468
Minorities
(219)
(186)
(259)
(288)
Shareholders' equity
6,483
7,302
8,257
9,317
Net profit
1,153
1,057
1,469
1,631
Minority interest
Net profit (adj.)
1,257
1,057
1,469
1,631
Total liabilities & equity
2014
2015F
2016F
2017F
Operating
2,124
1,399
1,976
2,189
Profitability
Pre-tax profit
1,805
1,636
2,274
2,525
Tax
(291)
(392)
(546)
(606)
184
243
302
357
Working capital changes
60
(14)
11
9
Other operating cashflows
366
(74)
(66)
(95)
Investing
(1,888)
(2,000)
(2,000)
(2,000)
Capex (maintenance)
(1,985)
(2,000)
(2,000)
(2,000)
107
0
0
0
0
0
0
0
(9)
0
0
0
Financing
(386)
1,462
(314)
Dividend payments
(290)
(238)
0
625
812
1,071
1,359
13,803
16,625
18,352
20,120
2014
2015F
2016F
2017F
EBITDA margin
36.8
34.6
37.9
38.8
Pre-tax margin
31.3
28.2
32.4
32.7
Net margin
20.0
18.2
20.9
21.1
ROA
9.0
6.9
8.4
8.5
ROE
19.0
15.3
18.9
18.6
Turnover
41.7
0.8
21.1
9.8
EBITDA
44.3
(5.2)
32.5
12.6
Pre-tax profit
42.3
(9.4)
39.0
11.0
(371)
Net profit
34.8
(8.4)
39.0
11.0
(514)
(571)
Net profit (adj.)
43.0
(16.0)
39.0
11.0
0
0
0
EPS
43.0
(16.0)
39.0
10.9
3,580
2,000
500
500 Debt to total capital
37.6
42.4
39.9
37.4
Debt to equity
66.0
81.9
74.9
68.5
Net debt/(cash) to equity
61.2
65.8
64.7
61.5
Interest cover (x)
n.a.
27.3
40.5
31.6
CASH FLOW Year to 31 Dec (Rpb)
Deprec. & amort.
Investments Proceeds from sale of assets Others
Issue of shares Proceeds from borrowings Loan repayment
KEY METRICS
(3,439)
(300)
(300)
(300)
Others/interest paid
(237)
0
0
0
Net cash inflow (outflow)
(151)
861
(338)
(182)
Beginning cash & cash equivalent
482
311
1,172
834
Changes due to forex impact
(20)
0
0
0
Ending cash & cash equivalent
311
1,172
834
652
Refer to last page for important disclosures.
Year to 31 Dec (%)
Growth
Leverage
153
R e g i o n a l
M o r n i n g
N o t e s
Wednesday, 13 May 2015
Disclosures/Disclaimers This report is prepared and/or distributed by UOB Kay Hian Pte Ltd (“UOBKH”), which is a holder of a capital markets services licence and an exempt financial adviser in Singapore. This report is provided for information only and is not an offer or a solicitation to deal in securities or to enter into any legal relations, nor an advice or a recommendation with respect to such securities. This report is prepared for general circulation. It does not have regard to the specific investment objectives, financial situation and the particular needs of any recipient hereof. Advice should be sought from a financial adviser regarding the suitability of the investment product, taking into account the specific investment objectives, financial situation or particular needs of any person in receipt of the recommendation, before the person makes a commitment to purchase the investment product. This report is confidential. This report may not be published, circulated, reproduced or distributed in whole or in part by any recipient of this report to any other person without the prior written consent of UOBKH. This report is not intended for distribution, publication to or use by any person in any jurisdiction outside Singapore or any other jurisdiction as UOBKH may determine in its absolute discretion, where the distribution, publication or use of this report would be contrary to applicable law or would subject UOBKH and its connected persons (as defined in the Financial Advisers Act, Chapter 110 of Singapore) to any registration, licensing or other requirements within such jurisdiction. The information or views in the report (“Information”) has been obtained or derived from sources believed by UOBKH to be reliable. However, UOBKH makes no representation as to the accuracy or completeness of such sources or the Information and UOBKH accepts no liability whatsoever for any loss or damage arising from the use of or reliance on the Information. UOBKH and its connected persons may have issued other reports expressing views different from the Information and all views expressed in all reports of UOBKH and its connected persons are subject to change without notice. UOBKH reserves the right to act upon or use the Information at any time, including before its publication herein. Except as otherwise indicated below, (1) UOBKH, its connected persons and its officers, employees and representatives may, to the extent permitted by law, transact with, perform or provide broking, underwriting, corporate finance-related or other services for or solicit business from, the subject corporation(s) referred to in this report; (2) UOBKH, its connected persons and its officers, employees and representatives may also, to the extent permitted by law, transact with, perform or provide broking or other services for or solicit business from, other persons in respect of dealings in the securities referred to in this report or other investments related thereto; (3) the officers, employees and representatives of UOBKH may also serve on the board of directors or in trustee positions with the subject corporation(s) referred to in this report. (All of the foregoing is hereafter referred to as the “Subject Business”); and (4) UOBKH may otherwise have an interest (including a proprietary interest) in the subject corporation(s) referred to in this report. As of the date of this report, no analyst responsible for any of the content in this report has any proprietary position or material interest in the securities of the corporation(s) which are referred to in the content they respectively author or are otherwise responsible for. Each research analyst of UOBKH who produced this report hereby certifies that (1) the views expressed in this report in any event accurately reflect his/her personal views about all of the subject corporation(s) and securities in this report; (2) the report was produced independently by him/her; (3) he/she does not carry out, whether for himself/herself or on behalf of UOBKH or any other person, any of the Subject Business involving any of the subject corporation(s) or securities referred to in this report; and (4) he/she has not received and will not receive any compensation that is directly or indirectly related or linked to the recommendations or views expressed in this report or to any sales, trading, dealing or corporate finance advisory services or transaction in respect of the securities in this report. However, the compensation received by each such research analyst is based upon various factors, including UOBKH’s total revenues, a portion of which are generated from UOBKH’s business of dealing in securities. IMPORTANT DISCLOSURES FOR INCLUDED RESEARCH ANALYSES OR REPORTS OF FOREIGN RESEARCH HOUSES Where the report is distributed in Singapore and contains research analyses or reports from a foreign research house, please note: (i) recipients of the analyses or reports are to contact UOBKH (and not the relevant foreign research house) in Singapore in respect of any matters arising from, or in connection with, the analysis or report; and (ii) to the extent that the analyses or reports are delivered to and intended to be received by any person in Singapore who is not an accredited investor, expert investor or institutional investor, UOBKH accepts legal responsibility for the contents of the analyses or reports IMPORTANT DISCLOSURES FOR U.S. PERSONS This research report was prepared by UOBKH, a company authorized, as noted above, to engage in securities activities in Singapore. UOBKH is not a registered broker-dealer in the United States and, therefore, is not subject to U.S. rules regarding the preparation of research reports and the independence of research analysts. This research report is provided for distribution by UOBKH (whether directly or through its US registered broker dealer affiliate named below) to “major U.S. institutional investors” in reliance on the exemption from registration provided by Rule 15a-6 of the U.S. Securities Exchange Act of 1934, as amended (the “Exchange Act”). All US persons that
Refer to last page for important disclosures.
404
R e g i o n a l
M o r n i n g
N o t e s
Wednesday, 13 May 2015
receive this document by way of distribution from or which they regard as being from UOBKH by their acceptance thereof represent and agree that they are a major institutional investor and understand the risks involved in executing transactions in securities. Any U.S. recipient of this research report wishing to effect any transaction to buy or sell securities or related financial instruments based on the information provided in this research report should do so only through UOB Kay Hian (U.S.) Inc (“UOBKHUS”), a registered brokerdealer in the United States. Under no circumstances should any recipient of this research report effect any transaction to buy or sell securities or related financial instruments through UOBKH. UOBKHUS accepts responsibility for the contents of this research report, subject to the terms set out below, to the extent that it is delivered to and intended to be received by a U.S. person other than a major U.S. institutional investor. The analyst whose name appears in this research report is not registered or qualified as a research analyst with the Financial Industry Regulatory Authority (“FINRA”) and may not be an associated person of UOBKHUS and, therefore, may not be subject to applicable restrictions under FINRA Rules on communications with a subject company, public appearances and trading securities held by a research analyst account. Analyst Certification/Regulation AC As noted above, each research analyst of UOBKH who produced this report hereby certifies that (1) the views expressed in this report accurately reflect his/her personal views about all of the subject corporation(s) and securities in this report; (2) the report was produced independently by him/her; (3) he/she does not carry out, whether for himself/herself or on behalf of UOBKH or any other person, any of the Subject Business involving any of the subject corporation(s) or securities referred to in this report; and (4) he/she has not received and will not receive any compensation that is directly or indirectly related or linked to the recommendations or views expressed in this report or to any sales, trading, dealing or corporate finance advisory services or transaction in respect of the securities in this report. However, the compensation received by each such research analyst is based upon various factors, including UOBKH’s total revenues, a portion of which are generated from UOBKH’s business of dealing in securities.
Copyright 2015, UOB Kay Hian Pte Ltd. All rights reserved. http://research.uobkayhian.com RCB Regn. No. 197000447W
Refer to last page for important disclosures.
415