Journal of The Electrochemical Society, 148 共4兲 A299-A304 共2001兲
A299
0013-4651/2001/148共4兲/A299/6/$7.00 © The Electrochemical Society, Inc.
LiquidÕSolid Phase Diagrams of Binary Carbonates for Lithium Batteries Part II Michael S. Ding,*,z Kang Xu,** Shengshui Zhang,* and T. Richard Jow* Army Research Laboratory, Adelphi, Maryland 20783, USA With a differential scanning calorimeter, we mapped five liquid/solid phase diagrams of binary carbonates: propylene carbonate 共PC兲-dimethyl carbonate 共DMC兲, PC-diethyl carbonate 共DEC兲, DEC-ethylene carbonate 共EC兲, DEC-DMC, and DEC-ethyl methyl carbonate 共EMC兲. These phase diagrams, together with the ones we had published earlier, provided a complete representation for all the binary combinations of these five common carbonates: EC, PC, DMC, EMC, DEC. The results showed that all the combinations formed simple eutectic systems, although details of their phase diagrams greatly varied, that DEC melted at ⫺74.3°C instead of the currently accepted value of ⫺43°C, and that DEC was less effective than either EMC or DMC in bringing down the liquidus temperatures of their binary mixtures with EC. These results followed the trend we had observed earlier that an expansion toward low temperature of the liquid region of a binary system was facilitated by the two components having close melting points and similar molecular structures. © 2001 The Electrochemical Society. 关DOI: 10.1149/1.1353568兴 Manuscript submitted July 28, 2000; revised manuscript received December 27, 2000.
The purpose of this work was to experimentally map out and graphically present the liquid/solid phase diagrams for these five binary carbonate systems: propylene carbonate 共PC兲-dimethyl carbonate 共DMC兲, PC-diethyl carbonate 共DEC兲, DEC-ethylene carbonate 共EC兲, DEC-DMC, and DEC-ethyl methyl carbonate 共EMC兲. These phase diagrams, together with the phase diagrams of DMCEC, EMC-EC, EMC-PC, PC-EC, and EMC-DMC we had published earlier,1 provided a complete representation for all the binary combinations of these five common carbonates: EC, PC, DMC, EMC, DEC. The phase diagrams of binary carbonates are important for many reasons.1 First, such a diagram assists in the estimation of the liquid range of an electrolyte made from a binary carbonate system whose phases it delineates, thus providing guidance to the formulation of the electrolyte with respect to its liquid range requirements. This liquid range is an essential property for the proper use of an electrolyte at low temperatures, since any prolonged operation below this range will likely cause precipitation in the electrolyte.2 Second, these binary diagrams will be valuable as the basis for the construction of ternary phase diagrams of carbonates. As more and more ternary carbonate solvents come into use for lithium batteries, such ternary diagrams will be increasingly needed. Furthermore, study and comparison of these binary diagrams may reveal important trends and generalities that point the direction for the exploration of new solvents and mixtures. With the exception of DEC, the pure carbonates are all chemically stable against lithium metal, which accounts for their wide use as the electrolyte solvents for lithium batteries. Instability of DEC with lithium and with lithiated carbons has only been observed in its pure form;3,4 carbonate mixtures containing DEC are still frequently used in the lithium battery research and development.4-7 Four of the five binary carbonate systems treated in this paper contain DEC as a component. Table I lists molecular structure and properties of the five carbonate components from which we have constructed phase diagrams for all the binary combinations. Although four of these have been listed in the preceding paper,1 they are relisted here, together with DEC, for ease of reference and discussion in this paper and for the new data that have recently become available.8 In particular, after careful observation and measurement, we gave a value of ⫺74.3°C to the melting point (T m) of DEC, which was more than 30 degrees
* Electrochemical Society Active Member. ** Electrochemical Society Student Member. z
E-mail:
[email protected]
lower than the currently accepted value of ⫺43°C. This point is discussed further in a later section. It is also of interest to note that the properties of the three noncyclic carbonates change regularly with their molecular weights. As in the preceding work,1 we used a differential scanning calorimeter 共DSC兲, either with a refrigeration unit or with liquid nitrogen for cooling, for the experimental mapping of the phase diagrams. The results showed that all of the carbonate pairs from the five common carbonates formed simple eutectic systems, although details of their phase diagrams greatly varied, that DEC melted at ⫺74.3°C instead of the currently accepted value of ⫺43°C, and that DEC was less effective than either EMC or DMC in bringing down the liquidus temperatures of their binary mixtures with EC. These results followed the trend we had observed earlier that an expansion toward low temperature of the liquid region of a binary system was facilitated by the two components having close melting points and similar molecular structures.1 Experimental For the component carbonates, we used DEC 共99.95%兲, EC 共99.95%兲, DMC 共99.98%兲, and PC 共99.98%兲 from Grant Chemical, and EMC 共99.9%兲 from EM Industries, Inc. We handled and prepared the solvents and their DSC samples in a dry glove box filled with argon. We used a Perkin Elmer DSC 7 running Pyris 3.0 to obtain cooling and heating curves of the samples, with one of two cooling mechanisms. We used an intracooler 2 for measurements above ⫺60°C, with the DSC calibrated against n-octane 共⫺56.76°C兲 and hexatriacontane 共72.14°C兲. Alternately, we used liquid nitrogen as the coolant for measurements below ⫺60°C, using n-hexane 共⫺90.56°C兲 and n-octane for calibration.11 Phase transition temperatures were determined from the heating curves of the samples, the heating rate being uniformly 2°C/min. More experimental details can be found in our other papers.1,12 Results Melting point of DEC.—As listed in Table I, our DSC measurement of T m for DEC resulted in a value of ⫺74.3°C, some 30 degrees lower than the currently accepted value of ⫺43°C. As this value seemed highly established, appearing in many books,13 papers,14 and product catalogs15 we took the following measures to ensure the validity and consistency of our new value. 1. T m was measured with DEC samples from three different commercial sources, with nearly identical results. 2. The identity of one of the samples was confirmed with nuclear magnetic resonance 共NMR兲 analysis.
A300
Journal of The Electrochemical Society, 148 共4兲 A299-A304 共2001兲
Table I. Structural formulas and relevant properties of five common carbonate solvents.
3. We visually observed a sample of DEC to verify that the thermal event at ⫺74.3°C was indeed due to the melting of DEC. For this purpose, we placed the solvent into a small vial of clear glass, and capped the vial with a screw-on lid in which a thermocouple had been so fitted that its tip would sit in the middle of the solvent after the capping. Then, the vial was dipped into liquid nitrogen until the solvent inside turned opaque, which should signify crystallization, not vitrification, of the solvent. The vial was then lifted from the liquid nitrogen and left in the air to warm, during which time, both the temperature and the opacity of the solvent were monitored. At about ⫺75°C, the opacity started to fade away and the cleared part of the solvent flowed from side to side when the vial was so tipped, while the rise of temperature was momentarily arrested. These observations were consistent with the melting of the solvent during which it would turn from an opaque solid into a clear liquid while absorbing heat from its surroundings. They also eliminated the possibility of the solvent having a stable crystalline phase above ⫺75°C, since it is not known to be possible that a substance can warm from a crystalline phase directly into a supercooled liquid. 4. We also determined the heat of fusing for DEC to be 8.6 kJ/mol, a reasonable value as compared to that of PC of 9.62 and EC of 13.19.9 Furthermore, as is shown later, the consistency of the new value was supported by the phase diagrams of binary systems with DEC as a component, in which liquidus temperature of the DECrich mixtures progressed consistently into the T m of DEC as their mole fraction of DEC was increased to unity. PC-DMC phase diagram.—This phase diagram 共Fig. 1兲 describes the liquid/solid equilibria of a binary solvent system composed of a cyclic and a noncyclic carbonate. Solubility of DMC in PC at different temperatures is traced out by the sloping curve,
whose equation is T/°C ⫽ 104.8x 3 ⫺ 251.49x 2 ⫹ 246.72x ⫺ 93.826, where x is the mole fraction of DMC. As indicated by the open dots on the curve, this solubility was determined down to about ⫺70°C, with a sample containing only 0.1 mole fraction of DMC, showing the ease with which DMC crystallizes. In contrast, crystallization of PC, either from its melt or from its solutions, was not realized due to its high viscosities at and below its T m . This accounts for the absence of its solubility curve and the solidus line in the figure. The horizontal line at ⫺52.3°C in Fig. 1 describes a phase transition in the solid DMC, with its high and low temperature phases distinguished by subscripts 1 and 2, respectively. That this is a solidsolid phase transition is evidenced by the following observations. First, a thermal event would be observed at ⫺52.3°C whenever there was solid DMC in the sample, the magnitude of the event being proportional to the amount of solid DMC and independent of the amount and nature of the other component. The phase diagram of DEC-DMC as appears later shows a similar phase line. Similar thermal events were also observed in the EMC-DMC system treated in the preceding paper, but we failed to recognize them as signifying such a phase transition, and therefore, missed the phase line in the EMC-DMC phase diagram.1 Contributing to the oversight was the closeness in temperature of this phase transition to the solidus phase transitions of the EMC-DMC mixtures,1 which made the transition heat of the former, often the much weaker of the two, easy to overlook. The second evidence for a solid-solid phase transition is that a thermal event was observable only when there was solid DMC in the sample. For instance, no transition heat was observed in samples with a PC content richer than that corresponding to the intersection of the solubility curve and the transition line of Fig. 1, even though
Journal of The Electrochemical Society, 148 共4兲 A299-A304 共2001兲
Figure 1. Liquid/solid phase diagram of PC-DMC. The open dots represent measured data from which the curve 共solubility of DMC in PC兲 and the horizontal line 共solid-solid phase transition of DMC兲 have been obtained through data fitting. The subscripts 1 and 2 denote the high and low temperature phases of DMC, respectively, and the square represents the T m of PC.
such samples did contain DMC. Third, the constancy of the temperatures at which these thermal events occurred also pointed to a solid-solid phase transition. We propose this solid-solid phase transition in DMC to be a rotational phase transition where the molecules of a solid DMC sample started to rotate along a particular axis when the sample was brought up across the transition temperature. Two observations seemed to support this view: 共i兲 The heat involved in such a transition was small, less than 1% of the heat of fusion for DMC. 共ii兲 The transition was highly reversible, i.e., supercooling of the sample with respect to the transition was limited to only a few degrees. We have also observed the same kind of phase transitions in many onium salts, such as Et4 NPF6 , Et4 NAs6 F6 , Et4 NBF4 , Et4 NCF3 SO3 , Et4 MeNPF6 , Et4 MeN(CF3 SO2 ) 2 N, Et4 MeNI, EtMe3 NPF6 , and Et4 Me6 I. 16 Rotational phase transition has also been observed in many other crystals, such as HCl, NH4 NO3 , N2 , CO, and CH4 . 17 PC-DEC phase diagram.—This phase diagram 共Fig. 2兲 largely resembles that of PC-DMC of Fig. 1. Solubility curve of DEC in PC can be described, as depicted with the curve in the figure, by the expression T/°C ⫽ ⫺18.079x 2 ⫹ 47.486x ⫺ 103.2, where x is the mole fraction of DMC. The extension of this curve toward PC, however, is much more limited than that in the PC-DMC system. This was due to the low liquidus temperatures of the DEC-rich samples as compared to the DMC-rich samples, which necessitated the crystallization of the former at lower temperatures and thus made it more difficult. On the other hand, the consistent progression
A301
Figure 2. Liquid/solid phase diagram of PC-DEC. The open dots represent measured data from which the curve 共solubility of DEC in PC兲 has been obtained through data fitting, and the square represents the T m of PC.
of the liquidus temperature of the samples into the T m of DEC as their mole fraction of DEC was increased to unity can be clearly seen in the existing portion of the solubility curve, adding to the consistency of the new T m value. DEC-EC phase diagram.—This phase diagram 共Fig. 3兲 resembles that of EMC-EC in that the solubility curve of EC in DEC is flat in the middle portion of the composition and the solidus temperature 共⫺74.3°C兲 is close to the T m of DEC.1 The experimentally determined portion of the solubility curve is represented by the solid curve in the figure, with the equation T/°C ⫽ 74.185x 3 ⫺ 122.43x 2 ⫹ 98.038x ⫺ 9.7684, where x is the mole fraction of EC. The dotted curve is an estimate plotted only to indicate how the solubility curve would likely have extended and connected if experimentally determinable. DEC-DMC phase diagram.—This phase diagram 共Fig. 4兲 depicts the liquid/solid equilibria in a binary system composed of two noncyclic carbonates. It carries the basic features of a typical simple eutectic binary system, with the eutectic composition being fairly DEC-rich and the solidus temperature 共⫺77.5°C兲 not too far below the T m of DEC. Solubility curves of DMC in DEC and of DEC in DMC, as depicted by the two curves in the figure, are expressed, respectively, by the equations T/°C ⫽ 81.005x 3 ⫺ 200.19x 2 ⫹ 228.87x ⫺ 102.89 and T/°C ⫽ ⫺64.129x 2 ⫺ 38.301x ⫺ 71.589, where x is the mole fraction of DMC. Again, as indicated by the transition line at ⫺52.6°C, solid DMC, either by itself or in the mixtures, transformed from its low temperature phase (s2 ) to its high temperature phase (s1 ) when it was heated across this temperature.
A302
Journal of The Electrochemical Society, 148 共4兲 A299-A304 共2001兲
Figure 3. Liquid/solid phase diagram of DEC-EC. The open dots represent measured data from which the solid part of the curve 共solubility of EC in DEC兲 and the solidus line at ⫺74.3°C have been obtained through data fitting. The dotted part of the curve is an estimate plotted to indicate a likely extension and connection of the solubility curve.
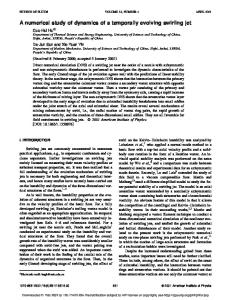
DEC-EMC phase diagram.—The features of this phase diagram 共Fig. 5兲 indicate that DEC is most compatible with EMC than with DMC, PC, or EC in forming liquid mixtures. As Fig. 5 shows, the eutectic composition is a considerable distance away from pure DEC, and the eutectic temperature 共⫺86.8°C兲 is some 12°C below the T m of DEC. The solubility curves of EMC in DEC and of DEC in EMC, respectively, are represented by the curves on the right and the left in the figure, whose equations are T/°C ⫽ 116.7x 3 ⫺ 262.72x 2 ⫹ 234.09x ⫺ 139.33 and T/°C ⫽ ⫺64.129x 2 ⫺ 38.301x ⫺ 71.589, where x is the mole fraction of EMC. Discussion We observed in our previous paper that for carbonate solvents, expansion toward low temperature of the liquid region of a binary system was achieved not by arbitrarily replacing one component with another of a lower-melting carbonate, as intuition would have suggested, but by choosing a balanced pair of components with close melting points and similar molecular structures.1 Comparison of the DEC-containing phase diagrams of this paper with those of the preceding one shows that the above generalization applies to the DEC-containing systems as well. Figure 6 is a replot of a figure from the preceding paper combining the phase diagrams of DMC-EC, EMC-EC, and PC-EC,1 with the addition of DEC-EC. We can see that mixing EC with DEC results in the least expanded liquid region toward low temperature, though DEC has the lowest T m . In fact, comparison of the phase diagrams in Fig. 6 shows that for the three noncyclic carbonates DMC, EMC, and DEC, the more different the T m of a carbonate is from that of EC, the less its binary mixture with EC expands its
Figure 4. Liquid/solid phase diagram of DEC-DMC. The open dots represent measured data from which the curves on the right 共solubility of DMC in DEC兲 and on the left 共solubility of DEC in DMC兲 and the horizontal lines at ⫺52.6°C 共solid-solid phase transition of DMC兲 and at ⫺77.5°C 共solidus line兲 have been obtained through data fitting. The subscripts 1 and 2 denote the high and low temperature phases of DMC, respectively.
liquid region into low temperature. On the other hand, PC forms with EC a binary system whose liquid region expands farthest into low temperature despite the wide difference in its T m from that of EC. This is because the cyclic EC is more compatible with the cyclic PC than with any of the noncyclic carbonates. The two factors at work here are the compatibility in molecular structure works favorably for PC with EC, and the closeness of T m to that of EC works for DMC among the noncyclic carbonates. Further, it can be argued that the proximity of T m is related to the structural compatibility, in that the T m of a crystalline carbonate is a manifestation of the intermolecular forces in the solid, which in turn depend on the molecular structure. An inspection of Table I would show that going from DMC to EMC to DEC, while the difference in T m from that of EC becomes larger, the apparent differences in structural formula and in dielectric constant from those of EC also become larger. These two factors could certainly affect the lattice energy, and therefore, the value of T m , of the crystalline carbonates. Conceivably, an increase in the number of carbon-carbon bonds in the molecules of a carbonate could enable them to assume confirmations that result in their looser packing in the solid state and thus a reduced lattice energy. The steady decrease of liquid density from DMC to EMC to DEC shown in Table I seems to point to such a mechanism. Furthermore, a decrease in dielectric constant, which is an indication of the polarity of the molecules, could reduce the dipole-dipole attractive forces in the solid, further weakening the lattice energy. Working against this trend of weakening lattice energy is the van der Waals’ intermolecular forces that would increase
Journal of The Electrochemical Society, 148 共4兲 A299-A304 共2001兲
Figure 5. Liquid/solid phase diagram of DEC-EMC. The open dots represent measured data from which the curves on the right 共solubility of EMC in DEC兲 and on the left 共solubility of DEC in EMC兲 and the solidus line at ⫺86.8°C have been obtained through data fitting.
with the molecular size. But this last factor is apparently the least influential in determining the overall lattice energy of the carbonates. Consideration of more DEC-containing binary systems in relation to each other and to other binary series reveals the same trend. A plot of all the DEC-containing phase diagrams together would show that the eutectic point of these diagrams shifts progressively toward the T m of DEC in going from EMC to DMC to EC. This has been observed and discussed in the preceding paper for the EMCcontaining series.1 Or, if the DMC-containing series were considered, they would show that the solubility curves of DMC in EC and PC lie above those in EMC and DEC, demonstrating the higher compatibility of DMC with the noncyclic EMC and DEC than with the cyclic EC and PC. Conclusions All the binary carbonate solutions made from carbonates EC, PC, DMC, EMC, and DEC formed simple eutectic systems, although details of their phase diagrams greatly varied. The melting temperature of DEC was determined to be ⫺74.3°C, a value some 30 degrees below the currently accepted value of ⫺43°C. In forming binary solutions with EC, DEC was the least effective among the noncyclic carbonates in bringing down the liquidus temperatures, signifying low compatibility between the molecules of DEC and EC. Comparison of the binary phase diagrams showed that an expansion toward low temperature of the liquid region of a binary system was achieved not by arbitrarily replacing one component with another of a lower T m but by choosing two components with closer match in melting temperature and higher compatibility in molecular structure. The Army Research Laboratory asisted in meeting the publication costs of this article.
A303
Figure 6. Liquid/solid phase diagrams of DEC-EC, EMC-EC, DMC-EC, and PC-EC combined with EC as the common component.
References 1. M. S. Ding, K. Xu, and T. R. Jow, J. Electrochem. Soc., 147, 1688 共2000兲. 2. S. P. Ding, K. Xu, S. S. Zhang, T. R. Jow, K. Amine, and G. L. Henriksen, J. Electrochem. Soc., 146, 3974 共1999兲. 3. Y. Ein-Eli, S. F. McDevitt, and R. Laura, J. Electrochem. Soc., 145, L1 共1998兲. 4. M. C. Smart, B. V. Ratnakumar, and S. Surampudi, J. Electrochem. Soc., 146, 486 共1999兲. 5. M. C. Smart, B. B. Ratnakumar, S. Surampudi, Y. Wang, X. Zhang, S. G. Greenbaum, A. Hightower, C. C. Ahn, and B. Fultz, J. Electrochem. Soc., 146, 3963 共1999兲. 6. J. M. Paulsen, J. R. Mueller-Neuhaus, and J. R. Dahn, J. Electrochem. Soc., 147, 508 共2000兲. 7. Y.-C. Chang, J-H Jong, and G. T.-K. Fey, J. Electrochem. Soc., 147, 2033 共2000兲. 8. Electrolyte Data Collection, Part 1d, Conductivities, Transference Numbers and Limiting Ionic Conductivities of Solutions of Aprotic, Protophobic Solvents II. Carbonates, J. Barthel and R. Neueder, Editors, Chemistry Data Series, Vol. XII, DECHEMA, Frankfurt 共2000兲. 9. Handbook of Organic Solvents, D. R. Lide, Editor, CRC Press, Boca Raton, FL 共1995兲. 10. S. Hossain, in Handbook of Batteries, 2nd ed., D. Linden, Editor, p. 36.14, McGraw-Hill, Inc., New York 共1995兲. 11. Help documents to Pyris 3.01 Thermal Analysis Software, Perkin Elmer Instruments, Norwalk, CT. 12. M. S. Ding, K. Xu, and T. R. Jow, J. Therm. Anal. Cal., 62, 177 共2000兲. 13. Beilstein Handbook of Organic Chemistry, Supplement 2, Vol. 3 共Syst. Nr. 199兲, p. 4; CRC Handbook of Chemistry and Physics, 81st ed., D. R. Lide, Editor, p. 3-111, CRC Press, Boca Raton, FL 共2000兲; Handbook of Organic Solvents, D. R. Lide, Editor, CRC Press, Boca Raton, FL 共1995兲; Lange’s Handbook of Chemistry, 15th ed., J. A. Dean, Editor, p. 1.181, McGraw-Hill, Inc., New York, 共1999兲; Handbook of Physical Properties of Organic Chemicals, P. H. Howard and W. M. Meylan, Editors, p. 170, CRC Press, Boca Raton, FL 共1997兲; Handbook of Data on Organic Compounds, 2nd ed., Vol. III, R. C. Weast and J. G. Grasselli, Editors, p. 1602, CRC Press, Boca Raton, FL 共1989兲; S. Hossain, in Handbook of Bateries, 2nd ed., D. Linden, Editor, p. 36.14, McGraw Hill, New York 共1995兲; C. Reichardt, Solvents and Solvent Effects in Organic Chemistry, 2nd ed., p. 409, VCH, Weinheim 共1988兲. 14. J. Timmermans and Th. J. F. Mattaar, Bull. Soc. Chim. Belg., 30, 215 共1921兲; J.
A304
Journal of The Electrochemical Society, 148 共4兲 A299-A304 共2001兲
Timmermans and Th. J. F. Mattaar, in Chemisches Zentralblatt, 1921 Band III, p. 1266; M. J. Timmermans and Nme Hennaut-Roland, J. Chim. Phys. Phys.-Chim. Biol., 27, 434 共1930兲; Y. Ein-Eli, S. F. McDevitt, and R. Laura, J. Electrochem. Soc., 145, L1 共1998兲; M. C. Smart, B. V. Ratnakumar, and S. Surampudi, J. Electrochem. Soc., 146, 486 共1999兲.
15. Acros Organics 2000/01, p. 705, Aldrich, Milwaukee, WI 共1998-1999兲, p. 569; Grant Chemical; EM Industries, Inc. 16. M. S. Ding, K. Xu, and T. R. Jow, Unpublished results. 17. S. Glasstone, Textbook of Physical Chemistry, 2nd ed., p. 422, D. Van Nostrand Company, Inc., New York 共1946兲.