JOURNAL OF APPLIED PHYSICS
VOLUME 87, NUMBER 11
1 JUNE 2000
Spatial variation of ferroelectric properties in Pb„Zr0.3 , Ti0.7…O3 thin films studied by atomic force microscopy James A. Christman, Seung-Hyun Kim, Hiroshi Maiwa, Jon-Paul Maria, Brian J. Rodriguez, Angus I. Kingon, and Robert J. Nemanicha) Department of Physics and Department of Materials Science and Engineering, North Carolina State University, Raleigh, North Carolina 27695-8202
共Received 5 November 1999; accepted for publication 29 February 2000兲 Imaging of the phase and magnitude of the piezoelectric strain in Pb共Zr0.3 , Ti0.7兲O3 共PZT兲 capacitors is performed with an atomic force microscope. The imaging reveals a significant spatial dependence of the ferroelectric properties of both fatigued and unfatigued PZT films. We propose that the variation is related to the domain structure of the PZT. Through the measurement of local piezoelectric hysteresis loops and imaging of the piezoelectric strain, areas are observed in fatigued PZT that exhibit hysteresis loops shifted along the polarization axis. In some regions of fatigued samples, the hysteresis loops are shifted such that both remanent points of the hysteresis curve have the same polarization direction. These results have important implications for the scalability of nonvolatile ferroelectric random access memory to higher device densities. © 2000 American Institute of Physics. 关S0021-8979共00兲09811-X兴
I. INTRODUCTION
sured the ‘‘piezoresponse’’ of the fatigued region. Colla et al.8 recently observed ‘‘ferroelectrically dead’’ regions in fatigued PZT. They employed AFM piezoelectric phase imaging at the remanent points of the hysteresis curve. In this article we report the spatial variation of ferroelectric properties with submicron lateral resolution using an AFM piezoelectric measurement technique. We present the first images of the piezoelectric phase and magnitude ( 兩 d 33兩 ), combined with local piezoelectric hysteresis (d 33 – E) loops of both unfatigued and fatigued PZT. Note that the phase of the piezoelectric response is related to the polarization direction in the ferroelectric material.9 Phase images represent the polarization direction, while contrast in the amplitude images shows the spatial variation in 兩 d 33兩 . The local piezoelectric loops provide previously unavailable information about the local properties of PZT.
One widely investigated application of ferroelectric materials is in nonvolatile ferroelectric random access memory 共NV-FRAM兲.1,2 For this type of memory, the bit value is represented by one of the two distinguishable remanent polarization states of a ferroelectric material in a capacitor configuration. Polarization fatigue is one mechanism that can cause bit failure in NV-FRAM based upon (Pbx Zr1⫺x )TiO3 共PZT兲. As the PZT is repeatedly switched between polarization states, the magnitude of the switchable polarization decreases, or ‘‘fatigues.’’ The spatial variation of ferroelectric properties, including polarization fatigue, becomes critical as the storage capacitor in NV-FRAM decreases in lateral dimensions. If the ferroelectric properties of a material vary on a micron scale, then micron-sized capacitors would exhibit a significant capacitor-to-capacitor variation in their electrical properties. In fact, Gruverman has recently employed atomic force microscopy 共AFM兲 to derive the variation of properties of SrBi2Ta2O9 films resulting from the random grain orientations, and discussed the implications for micron-scale capacitors.3 In the case of PZT, polarization hysteresis ( P – E) measurements have been performed upon micron-sized PZT capacitors,4,5 but the statistical variation of the ferroelectric properties has not been reported. Furthermore, Zavala et al.6 observed more variability in piezoelectric magnitude when measured by AFM as opposed to double beam interferometry. Recently, AFM has been used to measure the spatial variation of ferroelectric properties in fatigued PZT. Gruverman et al.7 examined fatigue in a PZT sample using a conducting AFM tip as the top electrode, and subsequently mea-
II. EXPERIMENT
In this study, measurements are performed with the AFM tip in contact with a top electrode. Besides the previously discussed advantages of this method,10 the top electrode allows the PZT to be fatigued by standard methods, and verification of the fatigue can be accomplished with standard polarization measurements. Also, having a top electrode is relevant since the electrode material is a critical component of the fatigue process.11,12 Piezoelectric measurements were performed in contact mode using a commercially available AFM 共PSI M5兲 that employed conducting diamond tips. The experimental setup is an improved version of a previously described apparatus.10 The phase and amplitude of the piezoelectric response are recorded using a dual-phase lock-in amplifier 共SR830兲. The voltage applied to the ferroelectric capacitor structure is an ac voltage with a dc offset. For all measurements reported here, the ac signal is at 1 kHz with a constant amplitude of
a兲
Author to whom correspondence should be addressed; electronic mail: Robert –
[email protected]
0021-8979/2000/87(11)/8031/4/$17.00
8031
© 2000 American Institute of Physics
8032
Christman et al.
J. Appl. Phys., Vol. 87, No. 11, 1 June 2000
TABLE I. Comparison of macroscopic polarization measurements with AFM piezoelectric measurements for unfatigued PZT. The percent deviations are for 1 s.d. The positive remanent voltage is ‘‘0⫹’’ and the negative remanent voltage is ‘‘0⫺.’’ The 兩 d 33兩 measurements are performed upon a single electrode with the AFM by measuring ten points spaced by 1 m along a line. The polarization measurements are taken on ten separate electrodes 225 m in diameter. Measurement
Average
% Deviation
d 33(0⫹) d 33(0⫺) d 33(0⫹)⫺d 33(0⫺) P(0⫹) P(0⫺) ⫺ P(0⫹)⫺ P(0⫺)
0.43 Å/V 0.41 Å/V 0.84 Å/V 22.8 C/cm2 22.0 C/cm2 44.8 C/cm2
23% 18% 16% 1.9% 2.3% 2.0%
0.25 VRMS . When measuring d 33 – E loops, the dc offset is stepped through computer control, and the lock-in outputs are recorded by the same computer. For d 33 – E hysteresis loop measurements the tip is stationary at a single point on the surface of the electrode. The PZT films (Zr/Ti⫽30/70) were prepared by chemical solution deposition onto Pt/SiO2 /Si共111兲. 13 The films are fully 共111兲 oriented with a thickness of 200 nm and an average grain diameter of 100 nm. Circular Pt electrodes ⬃100 nm thick and 225 m in diameter were sputtered onto the PZT thin film samples. P – E measurements were performed with a Radiant Technologies RT-66A. III. RESULTS AND DISCUSSION
To demonstrate the local variation of the ferroelectric properties in unfatigued PZT, P – E measurements of capacitors were compared to AFM piezoelectric measurements. The distribution of polarization loops for the PZT sample was quantified by performing P – E measurements on ten different electrodes. Table I shows the average values for the positive remanent polarization value, negative remanent value, and difference between the remanent values. It is seen that the variability of the average remanent polarizations from capacitor to capacitor on the same wafer is small. A similar measurement was performed upon a single electrode with the AFM by measuring ten d 33 – E loops spaced by 1 m along a line. The average values for the positive remanent d 33 value, negative remanent value, and difference between the remanent values are also shown in Table I. The variation of the 兩 d 33兩 values is larger than the variation of the macroscopic polarization values. The measured spatial variation of 兩 d 33兩 is an indication of a spatial variation of 兩 d 33兩 values, and the distribution of a larger statistical population is discussed later in the letter. The measurement technique has a precision of better than ⫾10% and thus, the larger measured variation is statistically significant. The AFM measurements reveal a local variation in the ferroelectric properties of unfatigued PZT that is not observable with P – E measurements upon large capacitors. This spatial variation is not likely to be due to second phases as none are observed to the limit of detection by x-ray diffraction, and as the phase images indicate all regions to be switching at the resolution of the AFM.
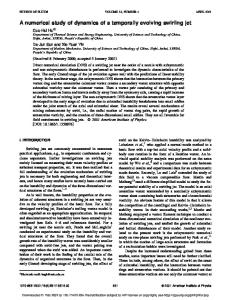
FIG. 1. Images of the piezoelectric constant for a 43% fatigued tetragonal PZT thin film. An image of the magnitude of the piezoelectric constant 共upper images兲 was measured simultaneously with the phase image directly below it. The dc offset voltage applied during the measurement is under the lower left corner of the 兩 d 33兩 image. The piezoelectric phase for a capacitor polarized with a positive voltage 共on the top electrode兲 was experimentaly set to ⫹90°.
Fatigued PZT capacitors also show a spatial variation of 兩 d 33兩 . Images of the piezoelectric phase and magnitude of fatigued PZT are shown in Fig. 1. This particular PZT sample was field cycled at an applied voltage of 5 V peakto-peak at 500 kHz for 109 cycles. After this treatment 43% of the initial remanent polarization was lost. Piezoelectric imaging was performed at four points on the hysteresis curve: at the saturation points 共⫾ 5 V兲 and at the remanent points 共both at 0 V兲. The images labeled 0⫹ and 0⫺ refer to the positive and negative remanent points. The 0⫹ image was generated with 0 V applied to the capacitor after 5 V was applied to the capacitor for several seconds. The 0⫺ image was similarly obtained after ⫺5 V was applied to the capacitor for several seconds. For all applied dc voltages the 兩 d 33兩 images show repeatable local contrast. This contrast in the 兩 d 33兩 images exists even though the corresponding phase images are uniform. This indicates that while all points of the area being scanned are oscillating in phase with each other; the amplitude of the oscillation is spatially dependent. Also, while there is no correlation between local variation of 兩 d 33兩 and the topography of the sample, the local variation of 兩 d 33兩 could be due to local variations in the polarization, the intrinsic contribution of the dielectric constant, and the electrostrictive constant, since these material parameters determine the magnitude of the piezoelectric effect.14 It is important to emphasize that unfatigued films also exhibit local variations in 兩 d 33兩 , so having contrast in the 兩 d 33兩 images in Fig. 1 is not unique to fatigued PZT films. The phase image in Fig. 1 measured at ⫺5 V shows a phase shift of 180 ° relative to the ⫹5 V phase image, indicating that the polarization direction has been switched. The polarization direction in both of these images is uniform. The phase image measured at 0⫹ V appears nearly identical to that obtained at ⫹5 V. Therefore, the polarization direction in the scanned area remains unchanged when the positive
J. Appl. Phys., Vol. 87, No. 11, 1 June 2000
FIG. 2. Images of the magnitude 共left兲 and phase 共right兲 of the piezoelectric constant in an area showing contrast in the phase image. This is an image of the negative remanent piezoelectric constant 共0-兲 of a 43% fatigued PZT film. Below the images are piezoelectric hysteresis loop measurements at three points on the images. The sign of the piezoelectric constant reflects the phase of the piezoelectric response.
voltage is removed. In the phase image measured at 0⫺ V, the phase is fairly uniform except for small areas where contrast exists. Identical measurements of unfatigued PZT show uniform polarization directions in the ⫾5 V and 0⫾ V images. Figure 2 shows a smaller scan of a region with contrast in the 0⫺ phase image. This image is obtained at the negative remanent point 共0⫺V兲. Features in the phase image correspond to dark 共low 兩 d 33兩 兲 areas in the corresponding 兩 d 33兩 image. In these areas of low 兩 d 33兩 the signal/noise ratio is reduced; and therefore, the measured phase in such a region will have a wider variation than the surrounding regions of higher 兩 d 33兩 . One must be cautious when interpreting phase images, since contrast in the phase image can be due to the spatial variation of the signal/noise ratio as 兩 d 33兩 varies from point to point. For instance, a nonpiezoelectric region surrounded by piezoelectric areas would be visible in the phase image. In the nonpiezoelectric region the measured phase would be random, and in the piezoelectric region, the phase would assume some value. As a film is further fatigued, the signal/noise ratio decreases and features in the phase image become more difficult to interpret. To further explore the nature of the contrast in the phase image in Fig. 2, local measurements of d 33 – E hysteresis loops were performed. Measurements of piezoelectric loops have a higher signal/noise ratio since they are single point
Christman et al.
8033
measurements that can be performed with longer lock-in amplifier time constants. Note the variation in the locally measured piezoelectric hysteresis loops. Also, the negative remanent points of each d 33 – E loop correspond to the value expected from the location in the image where the loop was measured. At the three points measured, the upper portions of the hysteresis loops are spaced fairly closely; whereas the lower portions of the hysteresis loops are spaced further apart. These three loops exhibit similar switching characteristics in the positive direction, whereas in the negative direction, the switching in loop 共c兲 is severely inhibited. The region where curve 共c兲 was obtained exhibits an upwardly shifted hysteresis loop such that both remanent points show a positive polarization. Such an area still switches between polarization states; however, it would not be useful in memory applications. In unfatigued PZT, we have never observed loops with both remanent points having the same polarization direction. The spatial variation observed in the phase images of fatigued PZT is similar to that observed by Colla et al.8 However, the local piezoelectric hysteresis loop measurements shown here demonstrate that these regions are not ferroelectrically dead. The polarization can still be switched between two distinct remanent values, so the areas are ferroelectric. The remanent points have the same polarization direction, so if only the remanent points 共0⫾兲 were imaged these areas would appear to be ferroelectrically dead. The observation of upward shifts of the hysteresis loops in fatigued PZT are consistent with other recent measurements.7,9 Each piezoelectric image contains 256⫻256 data points, and the histograms corresponding to the 兩 d 33兩 images in Fig. 1 are shown in Fig. 3. Histograms from images measured on unfatigued PZT are also shown in Fig. 3. After fatigue there is a consistent drop in the piezoelectric constant as can be seen by the shift of the 兩 d 33兩 distributions to smaller values. These histograms also demonstrate the position dependence of 兩 d 33兩 for both fatigued and unfatigued films, and provide a larger statistical population for the 兩 d 33兩 variation than the d 33 – E loops. In this letter, the d 33 – E loops have been compared to a parallel set of polarization measurements in order to emphasize the relationship between spatial variation and spatial scales. Two observations regarding fatigued PZT films have been made in this study. In fatigued films, some areas exhibit hysteresis loops shifted along the polarization direction 共Fig. 2兲. After fatigue, there is a consistent drop in the piezoelectric constants measured at the four points on the hysteresis loop 共Fig. 3兲. The first observation is consistent with the idea of fatigue resulting from inhibition of nucleation at the ferroelectric–electrode interface.15 Inhibition of switching in one polarization direction would result in the tail of the hysteresis loop shifting upward as was observed in Fig. 2. The consistent drop in the piezoelectric constants after fatigue implies that the switching is inhibited in both directions. Independent of the fatigue mechanism, we have observed that fatigue has a significant spatial dependence. From our results, one would expect that for submicron-sized capacitors, the fatigue properties could vary widely from capacitor to capacitor. A NV-FRAM capacitor in an area such
8034
Christman et al.
J. Appl. Phys., Vol. 87, No. 11, 1 June 2000
IV. CONCLUSIONS
In summary, we have performed piezoelectric measurements upon both unfatigued and fatigued PZT capacitors and observed a micron or submicron-scale spatial variation in the ferroelectric properties. In fatigued PZT films, some areas exhibit upwardly shifted d 33 – E hysteresis loops in which both remanent points have the same polarization direction. These results suggest that micron-sized capacitors for high density NV-FRAM will exhibit significant capacitor-tocapacitor variations even in the unfatigued state. And in the fatigued state, the problem is exacerbated. ACKNOWLEDGMENTS
The authors acknowledge support from Ramtron International Corporation 共including supply of Pt-coated wafers兲, and from ATMI under Grant No. 98-76013. J. F. Scott and C. A. P. D. Araujo, Science 246, 1400 共1989兲. J. T. Evans and R. Womack, IEEE J. Solid-State Circuits 23, 1171 共1988兲. 3 A. Gruverman, Appl. Phys. Lett. 75, 1452 共1999兲. 4 S. Kobayashi, N. Tanabe, Y. Maejima, Y. Hayashi, and T. Kunio, Integr. Ferroelectr. 17, 81 共1997兲. 5 J. Lee, R. Ramesh, V. G. Keramidas, and D. K. Fork, Integr. Ferroelectr. 8, 35 共1995兲. 6 G. Zavala, J. H. Fendler, and S. Trolier-McKinstry, J. Appl. Phys. 81, 7480 共1997兲. 7 A. Gruverman, O. Auciello, and H. Tokumoto, Appl. Phys. Lett. 69, 3191 共1996兲. 8 E. L. Colla, S. Hong, D. V. Taylor, A. K. Tagantsev, N. Setter, and K. No, Appl. Phys. Lett. 72, 2763 共1998兲. 9 A. Kholkin, E. L. Colla, A. K. Tagantsev, D. V. Taylor, and N. Setter, Appl. Phys. Lett. 68, 2577 共1996兲. 10 J. A. Christman, R. R. Woolcott, A. I. Kingon, and R. J. Nemanich, Appl. Phys. Lett. 73, 3851 共1998兲. 11 H. N. Al-Shareef, K. R. Bellur, A. I. Kingon, and O. Auciello, Appl. Phys. Lett. 66, 239 共1995兲. 12 D. P. Vijay and S. B. Desu, J. Electrochem. Soc. 140, 2640 共1993兲. 13 S-H. Kim, J. G. Hong, J. C. Gunter, S. K. Streiffer, and A. I. Kingon, Mater. Res. Soc. Symp. Proc. 493, 131 共1998兲. 14 H. Maiwa, J-P. Maria, J. A. Christman, S-H. Kim, S. K. Streiffer, and A. I. Kingon, Integr. Ferroelectr. 24, 139 共1999兲. 15 E. L. Colla, D. V. Taylor, A. K. Tagantsev, and N. Setter, Appl. Phys. Lett. 72, 2478 共1998兲. 1 2
FIG. 3. Histograms of the 兩 d 33兩 images shown in Fig. 1. The upper plot is for unfatigued PZT at the given points on the hysteresis curve. The lower plot is for the 43% fatigued PZT whose images are shown in Fig. 1.
as measured in Fig. 2 would fatigue more severely and potentially fail after fewer switching cycles than other capacitors. Even though the 225 m capacitor is 43% fatigued as determined by macroscopic polarization measurements, the loops in Fig. 2 demonstrate that some areas are considerably more fatigued than others.