PROOF COPY 031305JOE
Photoacoustic study of the effect of doping concentration on the transport properties of GaAs epitaxial layers
OF
O PR
Sajan D. George S. DiIna R. Prasanth P. Radhakrishnan C. P. G. Vallabhan V. P. N. Nampoori Cochin University of Science and Technology International School of Photonics Cochin-682 022, India E-mail:
[email protected]
CO
Abstract. We report a photoacoustic (PA) study of the thermal and transport properties of a GaAs epitaxial layer doped with Si at varying doping concentration, grown on GaAs substrate by molecular beam epitaxy. The data are analyzed on the basis of Rosencwaig and Gersho’s theory of the PA effect. The amplitude of the PA signal gives information about various heat generation mechanisms in semiconductors. The experimental data obtained from the measurement of the PA signal as a function of modulation frequency in a heat transmission configuration were fitted with the phase of PA signal obtained from the theoretical model evaluated by considering four parameters—viz., thermal diffusivity, diffusion coefficient, nonradiative recombination time, and surface recombination velocity—as adjustable parameters. It is seen from the analysis that the photoacoustic technique is sensitive to the changes in the surface states depend on the doping concentration. The study demonstrates the effectiveness of the photoacoustic technique as a noninvasive and nondestructive method to measure and evaluate the thermal and transport properties of epitaxial layers. © 2003 Society of Photo-Optical
Instrumentation Engineers. [DOI: 10.1117/1.1564101]
Subject terms: photoacoustics; semiconductors; thermal and transport properties.
PY
Paper 020286 received Jul. 5, 2002; revised manuscript received Oct. 28, 2002; accepted for publication Oct. 28, 2002.
Introduction
OE
0091-3286/2003/$15.00
J 05
Opt. Eng. 42(5) 1–0 (May 2003) PROOF COPY 031305JOE
13
In recent years, the laser-induced photoacoustic 共PA兲 technique has been effectively employed to characterize semiconductor materials because of its versatility as a nondestructive and noninvasive method for the evaluation of material parameters.1–10 All the photothermal methods are based on the detection, by one means or other, of thermal waves generated in the sample after excitation with modulated optical radiation. In the simple and elegant PA technique these thermal waves produce density fluctuations in the specimen and the surrounding medium, which can be detected either by a sensitive microphone or by a piezoelectric transducer. In the past, much work has been done in the characterization of both direct- and indirect-bandgap semiconductors using the PA technique.5–7 A detailed discussion of the contribution of various factors to the thermal flux in semiconductors under periodic optical excitation is given by Pinto Neto et al.6 Dramicanin et al.7 gave an analytical solution for various factors contributing to heat generation in semiconductors that has resulted in a major renaissance in the application of the PA effect to the characterization of transport properties of semiconductors. However, not much work has been done to study the influence of doping concentration on the thermal and transport properties of epitaxially grown semiconductor layers. Some of the recent investigations show that doping can definitely influence the
thermal diffusivity and surface recombination velocity of compound semiconductors.9–12 In this paper, we present the results of our PA measurements on an epitaxial layer of GaAs doped with different concentration of Si, grown on a GaAs substrate by molecular beam epitaxy 共MBE兲. Amplitude of the PA signal gives a clear picture of the various heat generation mechanisms in semiconductors. The phase of the PA signal is fitted with the theoretical model by taking the thermal diffusivity, diffusion coefficient, surface recombination velocity, and nonradiative recombination time as adjustable parameters to solve the heat diffusion equation.
03
1
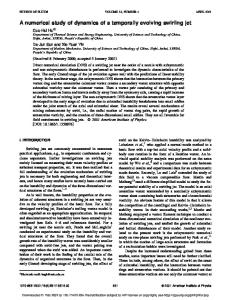
2 Experimental Setup A schematic representation of the open photoacoustic cell 共OPC兲 used here is given in Fig. 1. Optical radiation from an argon ion laser at 488 nm 共Liconix 5000兲 is used as the source of excitation, which is intensity-modulated using a mechanical chopper 共Stanford Research Systems SR 540兲 before it reaches the sample surface. Detection of the PA signal in the cavity is made using a sensitive electret microphone 共Knowles BT 1754兲. Details of the PA cell are explained elsewhere.13 The cell has flat response in the frequency range 40 to 4000 Hz. The phase of the photoacoustic signal is measured using a dual-phase digital lock-in amplifier 共Stanford Research Systems SR 830兲, which is highly sensitive and can read a change of 0.01 deg in phase angle, which corresponds to a very a small variation in © 2003 Society of Photo-Optical Instrumentation Engineers
1
PROOF COPY 031305JOE George et al.: Photoacoustic study . . .
sample due to absorption of the intensity-modulated laser radiation. In semiconductors, if the incident energy is greater than the bandgap of the semiconductor, then thermal power density Q(x,t) mainly arises from three different processes.
O PR
Fig. 1 PA cell geometry for the heat transmission configuration.
OF
chopping frequency 共⬃2 Hz兲, so that the data obtained have a high degree of accuracy. The laser power used for the present studies is 50 mW with a stability of ⫾0.5%. The samples are fixed on the OPC using vacuum grease at the edges, and the illumination by periodically modulated light is done on the exposed portion of the sample. The samples used for the present investigation are Sidoped GaAs epitaxial layers grown on GaAs substrates of thickness 400 m by MBE. The epitaxial layers have thicknesses of 10.25, 3, and 2 m, and the respective carrier concentrations are 2⫻1014, 2⫻1016, and 2⫻1018 cm⫺3 . Theoretical Background
2 T 1 T Q 共 x,t 兲 ⫺ ⫽ , x2 ␣s t ks
共2兲
where ␣ s (k s ) is the sample thermal diffusivity 共conductivity兲, and Q(x,t) is the heat power density generated in the 2 Optical Engineering, Vol. 42 No. 5, May 2003 PROOF COPY 031305JOE
Eg n 共 x,t 兲 ,
共4兲
where n(x,t) is the density of the photoexcited carriers. 3. The nonradiative recombination of the photoexcited carriers at the surface of the material also contributes to the total heat power density, and it is given by QSR⫽E g 关v ␦ 共 x 兲 ⫹ v 0 ␦ 共 x⫹l s 兲兴 n 共 x,t 兲 ,
共5兲
where v 0 is the carrier recombination velocity at the heating surface and v is the surface recombination velocity at the sample-gas interface at x⫽0.
OE
where P 0 (T 0 ) is the ambient pressure 共temperature兲, l g is the length of the gas chamber, g ⫽(1⫹ j)a g , where a g ⫽( f / ␣ g ) 1/2⫽1/ g , with g the thermal diffusion length in the gas with thermal diffusivity ␣ g , and ⌰ the sample temperature fluctuation at the sample-gas interface (x ⫽0). Also, ⫽2 f , where f is the modulation frequency. In the remaining sections we are considering the PA cell geometry for the heat transmission configuration shown schematically in Fig. 1. The temperature fluctuation ⌰ can be obtained from the solution of the thermal diffusion equation given by
QNRR⫽
J 05
共1兲
共3兲
where  is the optical absorption coefficient for photons having energy E, incident at x⫽⫺l s with an intensity I 0 共W/cm2兲. 2. The second component is due to the recombination of the photoexcited carriers in the bulk of the material after they travel a finite distance (D ) 1/2, where D is the carrier diffusion coefficient and is the recombination time. The heat power density due to nonradiative bulk recombination is given by
13
P 0⌰ jt e , T 0l g g
共E⫺Eg兲 I0 exp关共x⫹ls兲兴 e jt, E
03
The transport properties of Ge-doped GaAs epitaxial layers have already been treated using the monolayer approximation.10 The differences between the two-layer approximation and the monolayer method for photothermal experiments are apparent only at high frequencies,14 viz., in the hundreds of kilohertz. Hence our semiconductor samples can be explained in terms of thermal piston model of Rosencwaig and Gersho,15 according to which, the pressure fluctuations in the PA cell due to periodic heating of the sample are given by
␦ P⫽
QD⫽
PY
CO
3
1. The thermalization component arises from fast nonradiative intraband transitions in the conduction band of semiconductors. This occurs mainly due to the electron-phonon interaction, which happens typically on the time scale of picoseconds. Hence this process can be taken as instantaneous for the modulation frequencies usually used in the photoacoustic experiment. The heat power density due to this process is denoted by
From the above analysis, it is obvious that the solution to Eq. 共2兲 depends on the density of photoexcited carriers, which obeys the carrier diffusion equation, namely,
n 2n n  I 0 ⫽D 2 ⫺ ⫹ exp共 x⫹l s 兲 e j t ⫺ v n 共 x,t 兲 ␦ 共 x 兲 t x h ⫺ v 0 n 共 ⫺l s ,t 兲 ␦ 共 x⫹l s 兲 .
共6兲
For 488-nm radiation from an argon ion laser we can assume that all the incident radiation is absorbed at the x ⫽⫺l s surface, so that we can replace  I 0 exp关(x⫹ls)兴 in Eqs. 共3兲 and 共6兲 by I 0 (x⫹l s ). Since the thermal conductivity of the surrounding air is very small, we neglect the diffusion of heat into it. Then the solution of the coupled equations 共2兲 and 共6兲 leads to the expression for pressure fluctuations for the thermally thick sample as
PROOF COPY 031305JOE George et al.: Photoacoustic study . . .
␦ P⫽
冋
⫺1 2I 0 P 0 exp共 ⫺l s s 兲 T 0l g gk s s ⫹
冉
1 Fs v ⫹ D ␥ s2 ⫺ ␥ 2 s
冊册
共7兲
,
where s ⫽(1⫹ j)a s , a s ⫽( f / ␣ s ) 1/2⫽(1/ s ) with s the thermal diffusion length of the sample, ␥ ⫽ 关 (1 ⫹ j )/D 兴 1/2 is the carrier diffusion coefficient, ⫽E g /h , r⫽ v /D ␥ , r 0 ⫽ v 0 /D ␥ , and F⫽
1 . 共 1⫹r 0 兲共 1⫹r 兲 e ⫺ 共 1⫺r 兲共 1⫺r 0 兲 e ⫺ ␥ l
共8兲
␥l
O PR
冉
冊
1 2 f 0 P 0 F v , 2 2⫹ T 0 l g k s D ␥ g s ⫺ ␥ s
and the phase of the OPC signal is given by
⫹⌬⌽, 2
where 共 aD/ v 兲共 eff⫹1 兲 共 aD/ v 兲共 1⫺ eff兲 ⫺1⫺ 共 eff兲 2
共10兲
共11兲
OE
J 05
4 Results and Discussion Log-log plots of the amplitude of the PA signal against chopping frequency for the samples under investigation are given in Fig. 2. The three different heat generation mechanisms are evident from the figure. In the low choppingfrequency range, thermalization is the dominating process in heat generation, followed by bulk and surface recombination of photoexcited carriers, respectively. Figure 3 shows the best theoretical fit to the experimentally obtained phase of the photoacoustic signal. The values obtained as the best fitting parameters for the theoretical model is given in Table 1. The fitting program follows essentially the leastsquares method developed using MATLAB. The fitting analysis resulted in the following accuracy of the fitted parameters: thermal diffusivity ⫾2%, diffusion coefficient ⫾ 5%, nonradiative recombination time ⫾3%, and surface recombination velocity ⫾8%. It is seen from the figure that there is a minimum in the phase plot of all the specimens
13
with eff⫽关(D/␣s)⫺1兴. We took the thermal diffusivity, diffusion coefficient, surface recombination velocity, and relaxation time as adjustable parameters, and then we fitted the variable part of Eq. 共10兲 to the experimentally obtained phase angle ⌬⌽.
PROOF COPY 031305JOE
under investigation. Many authors have attributed this change in shape as due to the change in heat generation mechanism in semiconductors from bulk nonradiative recombination to surface recombination of photoexcited carriers.6 From the present studies, it is seen that the frequency at which the phase data show a minimum changes with the concentration of dopant. This may be due to the increase in recombination centers with increase in doping concentration, which in turn enhances heat generation due to bulk recombination. It is seen from Table 1 that the thermal diffusivity of the specimen under consideration is less than that of the earlier reported bulk GaAs sample.6 Thermal diffusivity is an important thermophysical parameter, which determines the distribution of temperature in systems where heat flow occurs. It was reported earlier that the thermal diffusivity in semiconductor films can deviate from the corresponding values in the bulk material.12 It is seen clearly from Table 1 that the thermal diffusivity of the epitaxial layer decreases with increase in doping concentration. In semiconductors heat is transported by both phonons and charge carriers.
03
tan ⌬⌽⫽
Fig. 2 Log-log plot of PA amplitude against chopping frequency.
PY
⌽⫽
共9兲
CO
␦ P⫽
OF
In the experimental frequency range used here, Ⰶ1, so that F, r, r 0 become real constants independent of the modulation frequency. It is reported by Pinto Neto et al.6 that the OPC signal for a semiconductor sample in the thermally thick region is essentially determined by nonradiative recombination. Thus the expression for the pressure fluctuation in the experimental frequency range for which Ⰶ1 is given by
Fig. 3 OPC phase angle versus modulation frequency for the samples under investigation. The solid lines represents the fits of Eq. (10) to the data. Optical Engineering, Vol. 42 No. 5, May 2003
3
PROOF COPY 031305JOE George et al.: Photoacoustic study . . . Table 1 Thermal and transport properties of GaAs epitaxial layers with various doping concentrations of Si. Sample number
1
Thickness of epitaxial layer (m) Thickness of substrate (m) Concentration of silicon (cm⫺3) 2
⫺1
Thermal diffusivity (cm s ) Diffusion coefficient (cm2 s⫺1) Surface recombination velocity (cm s⫺1) Nonradiative recombination time (s)
2
3
10.25
3
2
400
400
400
2⫻1014 2⫻1016 2⫻1018 0.26 5.2
0.23 4.9
0.21 4.5
415 11.2
476 9.8
525 7
O PR
OF
But the contribution to thermal conductivity from phonons is much greater than that from carriers, especially for carrier concentrations less than 1020 cm⫺3 . The decrease in thermal diffusivity can be explained in terms of the dominant phonon contribution. Phonon scattering is a key source of thermalization processes and limits the performance of both electronic and optoelectronic devices. Addition of the dopants, which can be considered as point defects, enhances the scattering of phonons, which results in a reduction of phonon mean free path and consequently a decrease in the thermal conductivity. It is shown in Ref. 16 that the lattice thermal conductivity k is governed by the lattice thermal resistivity W through the relation k⫽1/W⫽AT ⫺n . At 300 K, n⫽1.25 for GaAs, and A is a parameter that decreases with increase in doping concentration. Since the thermal diffusivity and thermal conductivity are directly related to each other through ␣ ⫽k/ c, where is the density and c is the specific heat, the reduction in thermal conductivity with increased doping concentration directly leads to a smaller value for the thermal diffusivity. The diffusion coefficient of a semiconductor is a very important quantity, which determines the distance traveled by the photoexcited carriers before their recombination. It is seen from the values obtained for the diffusion coefficient that it is not the ambipolar transport but the diffusion coefficient of minority carriers that essentially determines the PA signal generation. This means that at an incident power of 50 mW, the photoinduced carrier population is less than the impurity concentration. It is also seen from the table that the diffusion coefficient decreases with increase in doping concentration. The diffusion coefficient is directly related to the mobility of carriers through the Einstein relation D⫽kT /e, where k is the Boltzmann constant, T is the temperature, e is the carrier charge, and is the carrier mobility. At a constant temperature, the diffusion coefficient is essentially determined by the mobility of photoexcited carriers. The mobility of holes decreases with increase in doping concentration, which results in a reduced value of the diffusion coefficient. Additions of dopants have a strong influence on surface topology. The dopants act as scattering centers, which cause deterioration in the transport properties of the photoexcited carriers. One of the effects of incorporation of dopant is the generation of macrosteps 共terraces兲, and the bunched macrosteps give rise to striation. It was reported earlier that the surface recombination velocity of the photoexcited carriers increases with increase in doping concen-
PY
CO
tration of Ge on an epitaxial layer of GaAs,10 which agrees with our experimental result. It can be understood from the relation ⫽ thN st 共where is the capture cross section for the photoexcited carriers, th is the thermal velocity of the photoexcited carriers, and N st is the number of trapping centers per unit area兲 that the surface recombination velocity is directly proportional to the density of surface trapping centers. The number of trapping centers for the photoexcited carriers at the surface of the epitaxial layer increases with doping, leading to an increase in the surface recombination velocity, which is in agreement with our experimental result. The doping concentration influences the recombination time of the photoexcited carriers. It is important to point out that the photoacoustic signal is very sensitive to the carrier lifetime, so that the proper choice of this parameter is a significant step in the simulation process. The total carrier lifetime depends on various recombination processes. In the indirect-bandgap semiconductors like Si, nonradiative recombination is the dominant process, whereas in the direct-bandgap semiconductors like GaAs, radiative recombination dominates. Hence the evaluation of nonradiative recombination in GaAs and the study of variation of the nonradiative recombination time with doping have great physical significance, especially with respect to design and fabrication of semiconductor light sources. It is seen from our experiment that the recombination time decreases with increase in doping concentration. This is because the recombination time is directly related to the mobility of the photoexcited carriers. Since the mobility of carriers decreases with increase in doping concentration, the recombination time also decreases with increase in doping concentration. Our values for the recombination time are well within the range of earlier reported values for doped samples.6 In conclusion, we have demonstrated in this paper the capability of the PA technique in general and OPC detection in particular to study the thermal and transport properties of photoexcited carriers in layered semiconductor structures. We have investigated the influence of doping on the thermal and transport properties of the epitaxial layer of GaAs doped with Si of various concentrations, using thermal wave transmission and detection technique. From the analysis of experimental data, it is obvious that the thermal diffusivity of epitaxial layers decreases with increase in doping concentration. It is likewise seen that the diffusion coefficient of the minority carriers decreases with increase in doping concentration, which is due to the reduction in the mobility of carriers with doping. Doping also influences the surface recombination velocity and the nonradiative recombination time. The surface recombination velocity of the photoexcited carriers increases with increasing doping concentration, whereas the nonradiative recombination time decreases. This paper shows that the PA technique in the transmission detection configuration is a simple and effective method for the study of thermal and transport properties in semiconductors.
OE
J 05
13
03
4 Optical Engineering, Vol. 42 No. 5, May 2003 PROOF COPY 031305JOE
Acknowledgments This work is supported by Netherlands University Federation for International Collaboration 共NUFFIC兲. The authors wish to thank Prof. J. H. Wolter and Prof. J. E. M.
PROOF COPY 031305JOE George et al.: Photoacoustic study . . .
Haverkort 共COBRA group, Technical University of Eindhoven, the Netherlands兲 for the semiconductor samples. Sajan D. George wishes to acknowledge the Council of Scientific and Industrial Research, New Delhi for providing financial assistance. S. Dilna acknowledges the Department of Science and Technology, India, for her research fellowship. V. P. N. Nampoori thanks the UGC for financial assistance through a research award program.
S. Dilna received her MSc degree in physics with specialization in quantum electronics from Cochin University of Science and Technology, India, in 2000. She is currently a research fellow working towards her PhD degree at the International School of Photonics, Cochin University of Science and Technology, India. Her research interest includes laser-produced plasmas, laserinduced ablation in materials, and photothermal imaging.
References R. Prasanth received his MSc degree in physics with specialization in electronics from the University of Kerala, India, in 1995, and his MTech degree in optoelectronics and laser technology at Cochin University of Science and Technology, India, in 1998. Presently, he is working towards his PhD in a joint project between the Technical University of Eindhoven and the International School of Photonics. His research interest includes semiconductor nanostructures and laser-matter interactions.
OF
O PR
1. A. Mandelis, Ed., Photoacoustic and Thermal Wave Phenomena in Semiconductors, Elsevier Scientific, North-Holland, New York 共1987兲. 2. H. Vargas and L. C. M. Miranda, ‘‘Photoacoustic and related photothermal techniques,’’ Phys. Rep. 161共12兲, 43–101 共1988兲. 3. E. Marin, I. Riech, P. Diaz, J. J. Alvarado-Gil, J. G. Mendoza-Alvarez, H. Vargas, A. Cruz-Orea, and M. Vargas, ‘‘Photoacoustic investigation of nonradiative carrier life times,’’ J. Appl. Phys. 83共5兲, 2604 –2609 共1998兲. 4. N. A. George, C. P. G. Vallabhan, V. P. N. Nampoori, and P. Radhakrishnan, ‘‘Photoacoustic studies on n-type InP,’’ Opt. Eng. 41, 251–255 共2002兲. 5. A. Pinto Neto, H. Vargas, N. F. Leite, and L. C. M. Miranda, ‘‘Photoacoustic investigation of semiconductors: influence of carrier diffusion and recombination in PbTe and Si,’’ Phys. Rev. B 40共6兲, 3924 – 3630 共1989兲. 6. A. Pinto Neto, H. Vargas, N. F. Leite, and L. C. M. Miranda, ‘‘Photoacoustic characterization of semiconductors: transport properties and thermal diffusivity in GaAs and Si,’’ Phys. Rev. B 41共14兲, 9971– 9979 共1990兲. 7. M. D. Dramicanin, Z. D. Ristovskvi, P. M. Nikolic, D. G. Vasiljevic, and D. M. Todorovic, Phys. Rev. B 51共20兲, 14226 –14232 共1995兲. 8. A. Fukuyama, Y. Akashi, K. Yoshino, K. Maeda, and T. Ikari, ‘‘Piezoelectric photoacoustic studies of optical recovery of metastable states related to EL2 and EL6 levels in semi-insulating GaAs,’’ Phys. Rev. B 58共19兲, 12868 –12875 共1998兲. 9. S. D. George, C. P. G. Vallabhan, M. Heck, P. Radhakrishnan, and V. P. N. Nampoori, ‘‘Photoacoustic investigation of doped InP using open cell photoacoustic technique,’’ Nondestr. Test. Eval. 18共2兲, 75– 82 共2002兲. 10. I. Riech, E. Marin, P. Diaz, J. J. Alvarado-Gil, J. G. Mendoza-Alvarez, H. Vargas, A. Cruz-Orea, M. Vargas, and J. Bernal-Alvarado, ‘‘On the use of photoacoustic technique for monitoring the doping concentration dependence on surface recombination velocity,’’ Phys. Status Solidi A 169, 275–280 共1998兲. 11. I. Riech, P. Diaz, and E. Marin, ‘‘Study of nonradiative recombination mechanisms in semiconductors by photoacoustic measurements,’’ Phys. Status Solidi B 220, 305–308 共2000兲. 12. R. Castro Rodriguez, M. Zapata Torres, V. Rejoon Moo, P. Bartolo Perez, and J. L. Pena, ‘‘Evidence of scattering effects on the thermal transport in indium-doped CdTe films’’ J. Phys. D 32, 194 –1197 共1999兲. 13. N. A. George and Vinayakrishnan, ‘‘Photoacoustic evaluation of thermal diffusivity of coconut shell,’’ J. Phys.: Condens. Matter 14, 4509– 4513 共2002兲. 14. C. Christofides, F. Diakonos, A. Seas, A. Christou, M. Nestoros, and A. Mandelis, ‘‘Two-layer model for photomodulated thermoreflectance studies on semiconductors,’’ J. Appl. Phys. 80共3兲, 1718 –1725 共1996兲. 15. A. Rosencwaig and A. Gersho, ‘‘Theory of photoacoustic effect with solids,’’ J. Appl. Phys. 47共1兲, 64 – 69 共1976兲. 16. S. Adachi, Physical Properties of III-V Semiconductor Components, p. 59, John Wiley and Sons, New York.
PY
CO
P. Radhakrishnan received his MSc degree in physics from the University of Kerala in 1977, and his PhD degree from Cochin University of Science and Technology in 1986. He has been a lecturer at the Cochin College from 1979 to 1988. Presently he is a professor at the International School of Photonics, Cochin University of Science and Technology. He is a member of the executive committee of the Photonics Society of India. His research interests include laser technology, laser spectroscopy, and fiber optic sensors. He has published more than 70 journal papers in these areas.
OE
J 05
13
PROOF COPY 031305JOE
03
Sajan D. George received his MSc degree in physics with specialization in electronics from the University of Kerala, India, in 1998. He is currently a research fellow working towards his PhD degree at the International School of Photonics, Cochin University of Science and Technology, India. His research interests include thermal and optical characterization of various materials such as compound semiconductors, superlattices, liquid crystals, and ceramics using photothermal techniques.
C. P. Girijavallabhan received his MSc and PhD degrees in 1965 and 1971, respectively, from University of Kerala, India, and did his postdoctoral research at Southampton University in United Kingdom. He was also a visiting professor at Franhaufer Institute, Freiberg, Germany. Currently he is the dean of the Faculty of Technology at Cochin University of Science and Technology. He is the chief coordinator of the Center of Excellence in Lasers and Optoelectronic Sciences (CELOS), the president of Photonics Society of India, the vice president of the Indian Laser Association, and a fellow of the Optical Society of India. His research interests include lasers, laser-matter interactions, optoelectronics, molecular physics, and solid-state physics and photothermal techniques. He has published more than 200 journal papers in these areas. V. P. N. Nampoori received his MSc and PhD degrees from M S University, Baroda, in 1974 and 1978, respectively. He is currently a professor at the International School of Photonics, Cochin University of Science and Technology, India. He is the general secretary of the Photonics Society of India. His research interests include photothermal methods, fluorescence spectroscopy, nonlinear optics, fiber optics, and laser-produced plasmas. He has published more than 200 journal papers in these areas.
Optical Engineering, Vol. 42 No. 5, May 2003
5